Abstract
The effect of copper on photoinhibition of photosystem II in vivo was studied in bean (Phaseolus vulgaris L. cv Dufrix). The plants were grown hydroponically in the presence of various concentrations of Cu2+ ranging from the optimum 0.3 μm (control) to 15 μm. The copper concentration of leaves varied according to the nutrient medium from a control value of 13 mg kg−1 dry weight to 76 mg kg−1 dry weight. Leaf samples were illuminated in the presence and absence of lincomycin at different light intensities (500–1500 μmol photons m−2 s−1). Lincomycin prevents the concurrent repair of photoinhibitory damage by blocking chloroplast protein synthesis. The photoinhibitory decrease in the light-saturated rate of O2 evolution measured from thylakoids isolated from treated leaves correlated well with the decrease in the ratio of variable to maximum fluorescence measured from the leaf discs; therefore, the fluorescence ratio was used as a routine measurement of photoinhibition in vivo. Excess copper was found to affect the equilibrium between photoinhibition and repair, resulting in a decrease in the steady-state concentration of active photosystem II centers of illuminated leaves. This shift in equilibrium apparently resulted from an increase in the quantum yield of photoinhibition (ΦPI) induced by excess copper. The kinetic pattern of photoinhibition and the independence of ΦPI on photon flux density were not affected by excess copper. An increase in ΦPI may contribute substantially to Cu2+ toxicity in certain plant species.
Cu2+ is an essential micronutrient but in excess is toxic for plants. It is a redox-active metal that functions as an enzyme activator and is an important part of prosthetic groups of many enzymes (for review, see Sandmann and Böger, 1983). Copper concentrations in healthy plant tissues range from 5 to 20 mg kg−1 dry weight. In Cu2+-rich environments, accumulation of Cu2+ in plant tissues depends on the species and cultivar. Cu2+ seems to have several sites of action, which vary among plant species. Toxic concentrations of Cu2+ inhibit metabolic activity, which leads to suppressed growth and slow development. Most Cu2+ ions are immobilized to the cell walls of roots or of mycorrhizal fungi (Kahle, 1993).
When the tolerance mechanisms in the root zone become overloaded, Cu2+ is translocated by both the xylem and phloem up to the leaves. Excess Cu2+ may replace other metals in metalloproteins or may interact directly with SH groups of proteins (Uribe and Stark, 1982). Cu2+-induced free-radical formation may also cause protein damage (for review, see Fernandes and Henriques, 1991; Weckx and Clijsters, 1996). High concentrations of Cu2+ may catalyze the formation of the hydroxyl radical from O2 and H2O2. This Cu2+-catalyzed Fenton-type reaction takes place mainly in chloroplasts (Sandmann and Böger, 1980). The hydroxyl radical may start the peroxidation of unsaturated membrane lipids and chlorophyll (Sandmann and Böger, 1980), and these inhibitory mechanisms might contribute to the observed inhibition of photosynthetic electron transport by excess Cu2+ (Clijsters and Van Assche, 1985).
The role of Cu2+ as an inhibitor of photosynthetic electron transport has been studied in vitro. Both the donor (Cedeno-Maldonado and Swader, 1972; Samuelsson and Öquist, 1980; Schröder et al., 1994) and acceptor (Mohanty et al., 1989; Yruela et al., 1992, 1993, 1996a, 1996b; Jegerschöld et al., 1995) sides of PSII have been proposed to be the most sensitive site for Cu2+ action. On the donor side, Cu2+ is thought to inhibit electron transport to P680, the primary donor of PSII (Schröder et al., 1994). On the acceptor side, Cu2+ interactions with the pheophytin-QA-Fe2+-domain or Cu2+-induced modifications in the amino acid or lipid structure close to the QA- and QB-binding sites have been suggested to cause the inhibition of electron transport (Jegerschöld et al., 1995; Yruela et al., 1996a, 1996b).
Celeno-Maldonado and Swader (1972) noticed that preincubation of chloroplasts in the light enhanced the Cu2+-induced inhibition of electron transport, and that PSII was more susceptible to this kind of inhibition than was PSI. The hypothetical acceptor- and donor-side mechanisms of the light-induced inhibition of electron transport, photoinhibition, involve the same domains of attack as Cu2+. Both acceptor- and donor-side photoinhibition trigger the D1 polypeptide of the PSII reaction center for degradation (for review, see Aro et al., 1993). The damaged D1 protein is degraded, and the recovery of PSII activity needs de novo synthesis of D1 protein. Photoinhibition occurs at all light intensities (Tyystjärvi and Aro, 1996); therefore, the cycle of PSII photoinhibition, which is followed by degradation, and, finally, resynthesis of the D1 protein, runs constantly in plant cells in the light. If the photoinhibition-repair cycle is allowed to run for some time at a constant light intensity, equilibrium is reached. At equilibrium (steady state), all three reaction rates (photoinhibition, D1 degradation, and D1 synthesis) are equal. Healthy plants are often able to maintain a high steady-state concentration of active PSII under widely varying light intensities. Even if the concentration of active PSII is lowered by high light, the concentration of D1 protein tends to stay fairly constant (Cleland et al., 1990; Kettunen et al., 1991). In the bean (Phaseolus vulgaris L.) plants used in this study the steady-state D1 protein content remained almost constant even in the presence of excess Cu2+.
The effect of Cu2+ on photoinhibition in vivo has been studied very little. Vavilin et al. (1995) suggest that excess Cu2+ may slow the PSII repair cycle in the green alga Chlorella pyrenoidosa, and Ouzounidou et al. (1997) suggest that Cu2+ inhibits adaptation to light in maize. In the current study we show that excess Cu2+ induces a large increase in the rate constant of photoinhibition in vivo in a higher plant.
MATERIALS AND METHODS
Bean (Phaseolus vulgaris L. cv Dufrix) seeds were sown in vermiculite. After 2 weeks the plantlets were moved to a hydroponic nutrient medium (Hoagland and Arnon, 1950) buffered with 2 mm Mes-KOH, pH 5.5. The nutrient medium was supplemented with nine different concentrations of CuSO4, from 0.3 μm (control) to 15 μm. Nine plants were placed in each container with 5 L of nutrient solution, and the solution was changed twice a week. The plants were grown in a phytotron at 22°C in a 14-h light/2-h twilight/8-h dark rhythm for 2 weeks. The PPFD of the light phase was 250 μmol m−2 s−1, which was reduced to 50 μmol m−2 s−1 during the twilight period. Three plants per treatment were used in each individual experiment, and each experiment was repeated at least three times.
Photoinhibitory Treatments and Fluorescence Induction Measurements
Leaves were harvested at the end of the dark period. The second pair of leaves was detached and the petioles were soaked for 3 h in lincomycin solution (1 g L−1 water) (before and during the measurement of KPI) or in water alone (before and during the measurement of the equilibrium point of PSII photoinhibition and repair). The leaves were then illuminated in a temperature-controlled growth chamber at a PPFD of 500, 1000, or 1500 μmol m−2 s−1 for 4 to 5 h at 20°C with a 1200-W daylight metal halide arc lamp (color temperature 5600 K, Sylvania). Different experiments were done using plants from different cultivation batches.
During the experiment, six leaf discs per treatment were punched from the detached leaves every hour and dark adapted for 1 h between moist paper towels before fluorescence induction was measured with a fluorometer (PAM 101, Heinz Walz, Effeltrich, Germany) using fluorescence software (FIP, QA-Data, Turku, Finland). We also checked that the O2 evolution activity did not change during the incubation period if measured from thylakoids isolated from the leaf discs (data not shown). Initial fluorescence was first measured under a dim-red measuring beam, and Fm was then induced with a 9000 μmol m−2 s−1 white-light pulse (KL-1500 illuminator, Schott, Mainz, Germany). The percentage of photoinhibitory decrease in PSII activity was calculated as 100 × (Fv/Fm[control] − Fv/Fm[treatment])/Fv/Fm(control). The relevance of the fluorescence measurements was checked by measuring O2 evolution from thylakoids isolated from control and Cu2+-treated leaves in the course of the photoinhibitory treatments.
Measurement of O2 Evolution
O2 evolution (water to 2,6-dichlorobenzoquinone) was measured with an O2 electrode (Hansatech, King's Lynn, UK) from isolated thylakoids. Leaves were rapidly ground with a homogenizer (Ultra-Turrax, Janke and Kunkel, Staufen, Germany) in 50 mm Na-phosphate buffer, pH 7.4, 300 mm sorbitol, 5 mm MgCl2, 1 mm EDTA, 1 m Gly-betaine, and 1% (w/v) BSA (added just before isolation). The homogenate was filtered through Miracloth (Calbiochem) and centrifuged for 5 min at 1000g. The chloroplasts were resuspended in 5 mm sorbitol, 10 mm Hepes-KOH, pH 7.4, and 5 mm MgCl2 to cause an osmotic shock. Thylakoids were then collected by centrifugation for 5 min at 2000g and resuspended in storage buffer solution containing 100 mm Suc, 25 mm Tris-HCl, pH 8.5, 5 mm NaCl, and 10 mm MgCl2. PSII activity was measured in 40 mm Hepes-KOH, pH 7.6, 330 mm sorbitol, 5 mm NaCl, 5 mm MgCl2, 1 m Gly-betaine, 1 mm KHPO4, 5 mm NH4Cl, and 0.25 mm 2,6-dichlorobenzoquinone. O2 evolution was measured at 20°C in red light (plexiglass filter with a cutoff at 600 nm) using a slide projector as a light source. The PPFD was approximately 6500 μmol m−2 s−1 as measured by replacing the O2 electrode cuvette with a light meter. It was tested by slightly reducing the light intensity so that the PPFD was high enough to saturate O2 evolution in the samples. The chlorophyll concentration was 10 μg mL−1.
Emission Spectra
Emission spectra of thylakoids isolated from control and Cu2+-treated leaves were measured with a diode array fiber-optic spectrophotometer (S2000, Ocean Optics, Eerbeek, The Netherlands) exciting the samples at 435, 455, and 575 nm (10-nm half width) with a slide projector through an f/3.4 monochromator (Applied Photophysics, Surrey, UK). The wavelength resolution of the diode array was 3 nm. The sample (0.1 mL, 2.5 μg chlorophyll mL−1 storage buffer) was placed in an Eppendorf tube and frozen in liquid N2 with the fiber-optic probe placed 1 mm from the surface. Self-absorption was carefully eliminated by diluting each sample until the ratio of the intensity of the emission band at 735 nm to that at 685 nm no longer changed with chlorophyll concentration.
Leaf Absorptivity
The absorptivity of control leaves and leaves of plants grown with 4 μm Cu2+ was measured with a 60-cm-diameter integrating sphere. The sphere was calibrated using a black standard, as described by Idle and Proctor (1983). Total absorptivity of the leaves was calculated by illuminating each leaf sample with the same lamp used in the photoinhibition experiments and measuring the PPFD inside the sphere with and without the leaf.
Relative Rate of D1-Protein Degradation
D1 protein was quantified by western blotting from thylakoids isolated from Cu2+- and light-treated leaves. Samples were solubilized in Laemmli's solubilization buffer (Laemmli, 1970), except that 100 mm DTT was used instead of β-mercaptoethanol, and heated at 65°C for 5 min. The ratio of SDS to chlorophyll was approximately 800 μg μg−1. The samples were loaded on the basis of their chlorophyll content (1 μg chlorophyll well−1). Proteins were separated by SDS-PAGE using 14% acrylamide gels that contained 4 m urea. The stacking gel contained 4% acrylamide and 4 m urea. Proteins were transferred to PVDF membrane (Millipore). D1-specific antibody (Research Genetics, Huntsville, AL), raised against amino acids 234 to 242 of Synechocystis 6803 D1 protein, was used as primary antibody. Goat anti-rabbit alkaline phosphatase was used as the secondary antibody (Caltag Laboratories, Burlingame, CA), and the immunodetection of the D1 protein was performed using a chemiluminescence kit (Bio-Rad). Immunoblots were quantified with a charge-coupled device camera and software (MCID, St. Catharine's, Ontario, Canada).
Analysis of Basic Elements
The concentrations of basic elements (Ca, Cu, Fe, K, Mg, Mn, P, S, and Zn) in leaves, roots, and stems were measured with a plasma emission spectrophotometer (ICP-AES, Applied Research Laboratories, Lausanne, Switzerland). The number of copper ions per PSII reaction center was calculated by assuming that the antenna size of PSII was 210 and that of PSI was 230 chlorophyll units per reaction center, and that the ratio of PSI to PSII was 1.2.
Chlorophyll Determination
Chlorophyll was measured according to the method of Porra et al. (1989).
Mathematical Modeling
Photoinhibition treatments in the presence of lincomycin were used to measure KPI. KPI was extracted by fitting the photoinhibitory decrease in Fv/Fm to a first-order equation (Tyystjärvi et al., 1994). G was established with the following equation:
 |
1 |
The numerical value of ΦPI was obtained by multiplying the estimated number of PSII centers per unit area in a nonphotoinhibited leaf by KPI, and dividing the result by the number of quanta absorbed by PSII in unit time and unit area. The estimate of the number of PSII centers in the unit area was based on the same assumptions used in calculating the number of Cu2+ ions per PSII center, and 39% of the quanta incident on the leaf were assumed to end up in PSII in control leaves; this number was based on a leaf absorptivity of 75% (Table I). The same assumptions could be used for the Cu2+-treated leaves, despite their lower chlorophyll content, because the number of quanta absorbed per unit time was found to be roughly proportional to the chlorophyll content per unit area (Table I).
Table I.
Dark-adapted Fv/Fm ratios, light-saturated rates of O2 evolution, chlorophyll contents, and leaf absorptivities (400–700 nm)
| Cu2+ Concentration of Growth Medium | Fv/Fm | O2 Evolution | Chl Content | Light Absorptivity |
|---|---|---|---|---|
| μm | μmol mg−1 Chl h−1 | g m−2 | ||
| 0.3 | 0.837 (n = 9) | 439 (n = 6) | 0.16 | 0.75 |
| 1 | 0.850 (n = 6) | *a | * | * |
| 2 | 0.836 (n = 6) | * | 0.16 | * |
| 3 | 0.839 (n = 7) | * | * | * |
| 4 | 0.809 (n = 10) | 402 (n = 5) | 0.15 | 0.59 |
| 6 | 0.751 (n = 6) | * | * | * |
| 8 | 0.744 (n = 6) | * | * | * |
| 12 | 0.750 (n = 6) | * | * | * |
| 15 | 0.738 (n = 6) | * | 0.11 | * |
The light-saturated rate of O2 evolution was measured from thylakoids isolated from bean plants grown for 2 weeks in the presence of 0.3 to 15 μm Cu2+; the other parameters were determined from the leaves. The Fv/Fm and O2 evolution measurements were done on 5 to 10 different cultivation batches, as described, and the chlorophyll (Chl) and absoptivity data are based on measurements from one cultivation batch.
*, Not determined.
We assumed that the D1 protein of the photoinhibited PSII center was degraded in a first-order reaction (Tyystjärvi et al., 1994). The following treatment applies only to the lincomycin-treated leaves with no synthesis of the D1 protein; however, we assume that the KDEG value is the same if protein synthesis is allowed. Equations 2 and 3 describe photoinhibition and degradation of the D1 protein in the presence of lincomycin.
 |
2 |
 |
3 |
In Equations 2 and 3, A, B, and C are the concentrations of active, inhibited, and D1-depleted PSII centers, respectively, and t is time. At the beginning of each photoinhibition experiment, A was set to Fv/Fm of the nonphotoinhibited sample divided by Fv/Fm of the nonphotoinhibited control samples grown without excess Cu2+, B was set to 1 − A, and C was set to 0. The smallest initial value of A was 0.88. Table I lists the Fv/Fm values used. The model was optimized assuming that Cu2+ does not affect KDEG. Thereafter, the optimization was done by assuming a linear effect of leaf Cu2+ content on KDEG. ModelMaker software (Cherwell Scientific Publishing, Oxford, UK) was used for the optimization.
RESULTS
Visible Damage and Copper Concentration of the Leaves
Both root and shoot growth of the bean plants decreased with increasing copper concentration. Chlorosis and necrotic spots increased in the leaves, and browning of the roots increased with increasing Cu2+ concentration in the growth medium. After the 2-week Cu2+ treatment, visible damage was most obvious in the youngest leaves, whereas the primary leaves and the second pair of leaves showed less visible symptoms of Cu2+ stress. The visible symptoms were observed if the Cu2+ concentration in the growth medium was 2 μm or more.
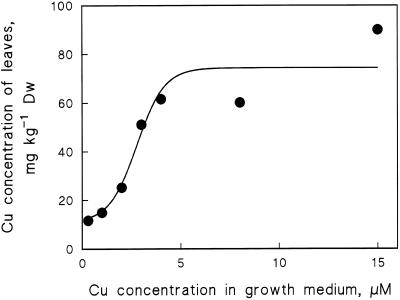
Analysis of basic elements showed that the copper concentration of the second pair of leaves was a sigmoidal function of the Cu2+ concentration of the growth medium. The uptake saturated at 4 to 6 μm. The best fit of the experimental data to a logistic sigmoid curve (Fig. 1; see the figure legend for the equation) was later used as an estimate of the copper content.
Figure 1.
Copper concentration in the second pair of bean leaves after 2 weeks of hydroponic growth at different concentrations of Cu2SO4. The curve represents the best fit (minimum = 11 mg kg−1; maximum = 74 mg kg−1; k = 1.4 μm−1; and ×50 = 2.8 μm) to a logistic sigmoid relationship, [Cu2+](leaf) = minimum + (maximum − minimum)/(1 + e−k([Cu2+]medium − ×50)), between the leaf copper concentration and the concentration of Cu2+ in the medium. Dw, Dry weight.
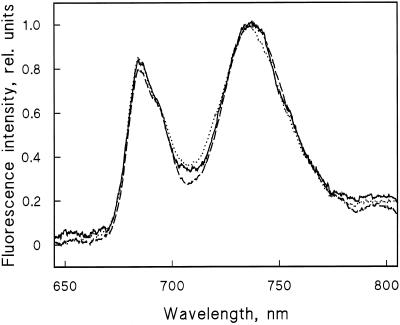
The chlorophyll content of the leaves treated with the highest Cu2+concentration was 69% of control (Table I), but the characteristics of the photosystems were similar. Emission spectra measured with 455 nm excitation (Fig. 2) showed that the Cu2+ treatments did not affect the ratio of PSII to PSI; the same result was obtained by 435 and 575 nm excitation (data not shown). Cu2+ treatment (4 μm) induced a similar decrease in the Fv/Fm ratios of the leaves and in the light-saturated rate of O2 evolution (expressed per milligram of chlorophyll; Table I). The unchanged ratio of active PSII per unit of chlorophyll indicates that the Cu2+ treatment did not induce major changes in the antenna sizes of the photosystems. Based on the measurements of the chlorophyll content of control and Cu2+-treated leaves (Table I), and assuming that each PSII center is associated with 210 and each PSI center with 230 chlorophyll molecules and that the ratio of PSII to PSI is 1.2, the copper concentration of 13 to 76 mg kg−1 dry weight equals 10 to 110 copper ions per PSII reaction center. For measurements of antenna sizes and photosystem stoichiometry in higher plants, see Melis (1996).
Figure 2.
Emission spectra of thylakoids isolated from control (solid line) plants and plants grown with 4 μm (dashed line) or 15 μm Cu2+ (dotted line) measured with a diode-array fiber-optic spectrophotometer at 77 K. The sample volume was 0.1 mL, the chlorophyll concentration was 2.5 μg/mL, and the excitation was 455 nm.
The highest copper concentrations were measured in the roots, where they were 10 to 20 times higher than in the second pair of leaves. The copper concentration per kilogram dry weight had a tendency to decrease with the age of the leaf (data not shown). The concentrations of Fe and Mn in the leaves correlated negatively with the concentration of copper. No differences in the concentrations of other basic elements (Ca, K, Mg, P, S, and Zn) were observed (data not shown).
Effect of Cu2+ on Photoinhibition: The Damaging Reaction
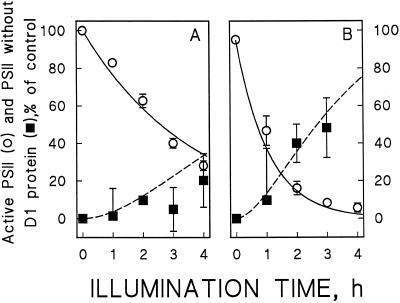
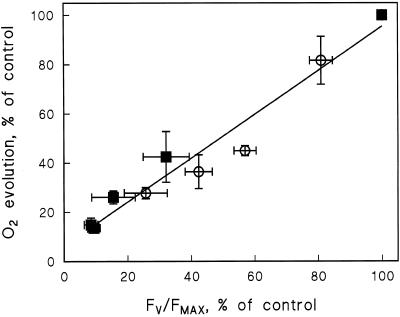
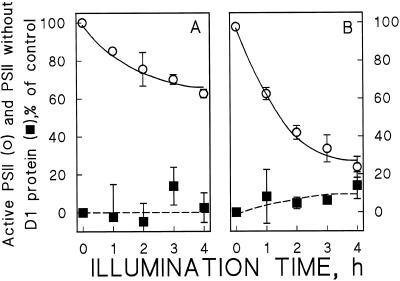
Photoinhibition measured in the presence of lincomycin followed the first-order equation in both the presence and absence of excess Cu2+, as deduced from the decrease in the Fv/Fm ratio (Fig. 3, solid lines). The light-saturated rate of O2 evolution in thylakoids isolated from treated leaves showed a good linear correlation with the Fv/Fm ratio during photoinhibition treatments (Fig. 4).
Figure 3.
Photoinhibition and D1 degradation in the leaves of bean plants grown at two different Cu2+ concentrations. The leaves of control plants (A) and plants grown with 4 μm Cu2+ (B) were illuminated at a PPFD of 1000 μmol photons m−2 s−1 in the presence of lincomycin. The lines show the best fit to the model obtained using data collected from all photoinhibition treatments in the presence of lincomycin. The solid lines indicate the concentration of active PSII centers, measured as 100 × Fv/Fm(sample)÷Fv/Fm(control) (○). The dashed lines represent the number of D1-depleted PSII centers (▪); the KDEG value is 0.3 h−1 in both A and B. Each data point represents the mean of three independent experiments; three leaves from three different plants were used for each experiment, and different experiments were done with plants from different cultivation batches. The error bars indicate se and are shown only if larger than the symbol.
Figure 4.
Correlation of O2 evolution activity with the Fv/Fm ratio (r2 = 0.95). O2 evolution was measured from thylakoids isolated after photoinhibition treatments (1000 μmol photons m−2 s−1) of control leaves (○) and leaves grown with excess (4 μm) Cu2+ (▪). Fv/Fm was measured from leaf discs. Each data point represents the mean of three independent experiments. The error bars indicate se and are shown only if larger than the symbol.
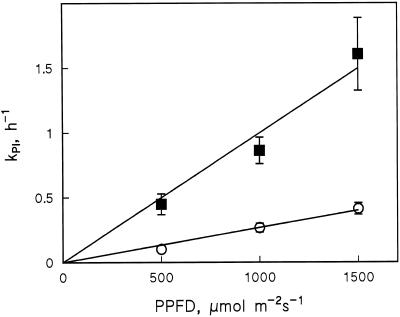
The first-order nature of photoinhibition allowed us to extract KPI. By measuring in three different light intensities (Fig. 5), it was verified that excess Cu2+ did not affect the basic linearity of KPI as a function of light intensity (Tyystjärvi and Aro, 1996). This linearity allowed us to approximate ΦPI, which is the probability that a PSII center becomes photoinhibited upon absorbing a photon.
Figure 5.
KPI in control (○) and 4 μm Cu2+-treated (▪) bean leaves measured at three different light intensities. Each KPI value was determined from a first-order fit to the results of a similar 4-h photoinhibition experiment as shown in Figure 2. Error bars indicate se and are shown only if larger than the symbol.
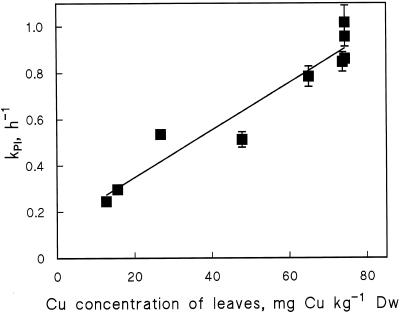
To elucidate an expression for the function G (Eq. 1), leaves with different copper concentrations were illuminated in the presence of lincomycin, and the KPI values were compared. Excess Cu2+ induced an increase in KPI, and this effect depended linearly on the copper concentration of the leaves (Fig. 6). Function G is thus reduced to a constant factor ρPI as follows:
 |
4 |
where ρPI is a constant, [Cu]excess is obtained by subtracting the control value 13 mg kg−1 dry weight from the leaf copper concentration, and Ia is the PPFD absorbed by PSII of the leaf. The excess concentration was used in Equation 4 instead of total copper concentration of the leaf because suboptimal Cu2+ concentrations were not tested. The optimized value of ρPI is 0.047 kg mg−1 dry weight (Table II), which results in a 3.8-fold increase in KPI when going from the control Cu2+ concentration to 15 μm Cu2+ in the growth medium (76 mg kg−1 dry weight in the leaves; Fig. 6).
Figure 6.
KPI measured at a PPFD of 1000 μmol photons m−2 s−1, plotted against the copper concentration of the bean leaves. The copper concentrations of the leaves were read from the curve of Figure 1. The KPI values were determined from first-order kinetic analysis of similar experiments as those shown in Figure 2. Each data point represents a KPI value derived from the curve, which includes Fv/Fm data from three independent experiments. The solid line shows the best linear fit. Error bars indicate se and are shown only if larger than the symbol. DW, Dry weight.
Table II.
Optimized values of the parameters of the model of photoinhibition and D1 protein degradation
| Parametera | Explanation | Value | se |
|---|---|---|---|
| ΦPI | Quantum yield of photoinhibition | 1.7 × 10⁻⁷ | |
| KDEG | Rate constant of degradation of damaged D1 protein | 0.3 h−1 | 0.02 |
| ρPI | Effect of leaf copper concentration on KPI | 0.047 kg mg−1 | 0.02 |
See Equations 1 to 4 for the exact definitions of the parameters.
Effect of Excess Copper on the Repair of Photoinhibited PSII
When bean leaves were illuminated at a PPFD of 1000 μmol photons m−2 s−1, the repair cycle approached an equilibrium after 3 h (Fig. 7). Excess copper lowered the equilibrium level of active PSII, and the extent of the lowering was dependent on the copper concentration of the leaves. At the optimum copper concentration 65% of PSII centers remained active at the equilibrium, whereas only 25% remained active at the highest copper concentration (Fig. 7, ○, solid lines). The same tendency was seen in the Fv/Fm ratios and in the O2 evolution rates measured before the light treatment (Table I), confirming that a slight displacement of the equilibrium occurs also during growth of the plants.
Figure 7.
The effect of excess copper on the equilibrium between photoinhibition and repair. The leaves of control plants (A) and plants grown with 4 μm Cu2+ (B) were illuminated at 1000 μmol photons m−2 s−1 in the absence of lincomycin. The Cu2+ concentrations of the growth media were 0.3 μm (A) and 4 μm (B). The solid lines indicate the concentration of active PSII centers measured with Fv/Fm (○), the dashed lines represent the amount of D1-depleted PSII centers (▪). Each data point represents three independent experiments, three leaves from three different plants were used for each experiment, and different experiments were done with plants from different cultivation batches. The error bars indicate se and are shown only if larger than the symbol.
To find out whether the decrease in the equilibrium level is entirely caused by the copper-induced increase in ΦPI, we measured D1-protein degradation during similar 4-h photoinhibitory treatments in the presence and absence of lincomycin. We have earlier shown that degradation of the damaged D1 protein also obeys first-order kinetics when assayed in vitro or in the presence of a chloroplast protein synthesis inhibitor in vivo (Tyystjärvi et al., 1994). When the model was optimized, allowing excess copper to affect the value of KDEG, the magnitude of the effect was found to be too small to be significant in the limits of accuracy of the D1-protein determinations. The data therefore suggest that after the photoinhibitory loss of PSII activity, the damaged D1 protein was degraded with similar kinetics in control plants and plants grown with excess Cu2+ (Fig. 3). If the degradation of the damaged D1 protein is independent of protein synthesis, as suggested by results in cyanobacteria (Kanervo et al., 1993), then the rate-limiting step of the PSII repair cycle in our bean plants was the degradation of the damaged protein, with a half-time of 2 h (KDEG value of 0.3 h−1; Table II). Figure 7 shows that once the D1 protein is degraded, it is very rapidly replaced by a new copy and, therefore, little loss of D1 protein can be seen in the absence of lincomycin.
DISCUSSION
We examined the effect of excess copper on PSII photoinhibition and the repair cycle in vivo using copper concentrations found in plants growing in polluted areas. Although copper accumulated mainly in roots, the copper level of leaves also increased, causing, in addition to enhancement of photoinhibition, chlorosis and necrotic spots in plants growing in the highest concentrations of Cu2+ used.
The cycle of photoinhibition and repair of PSII consists of a light-induced loss of active PSII reaction centers, which are subsequently repaired via enzymatic degradation and resynthesis of the D1 protein (for reviews, see Prasil et al., 1992; Aro et al., 1993). The damaging step is a first-order reaction and its quantum yield is independent of light intensity (Tyystjärvi and Aro, 1996). These key kinetic features of the damaging reaction were unaffected by toxic concentrations of copper (Figs. 3 and 5), indicating that the effect of excess copper was simply to speed up the same photoinhibition reaction that occurs in the absence of Cu2+ stress. In control leaves, the relationship between KPI and PPFD was virtually the same in this study as it was when measured in pumpkin in our earlier study (Tyystjärvi and Aro, 1996). PSII is thus equally vulnerable to light-induced damage in bean and pumpkin leaves. Slow degradation of the damaged D1 protein (Fig. 3), reflected by the low value of KDEG (Table II), seems to be a frequently occurring feature of higher plants grown under low light (Tyystjärvi et al., 1992; Schnettger et al., 1994). It is possible that this slowness is related to phosphorylation of the D1 protein (Aro et al., 1992).
Simple enhancement of photoinhibition by excess Cu2+ may be restricted to physiologically relevant concentrations. In vitro experiments suggest that illumination in the presence of very high Cu2+ concentrations induces a light-dependent inactivation mechanism different from that functioning in the absence of excess Cu2+ (Jegerschöld et al., 1995; Yruela et al., 1996b). In the present study, leaf Cu2+ concentrations were 10 to 110 Cu2+ ions per PSII reaction center, whereas concentrations far above 250 Cu2+ ions per PSII reaction center have been used in vitro (Jegerschöld et al., 1995; Yruela et al., 1996b).
Copper might cause an increase in ΦPI in two ways: (a) the metal ion may directly participate in the damaging reaction, e.g. by enhancing the production of hydroxyl radicals (Sandmann and Böger, 1980; Yruela et al., 1996b) or chlorophyll triplets (Sandmann and Böger, 1980); or (b) the toxic metal may block a protective reaction or induce a change in the structure of photosynthetic membranes or proteins (DeVos et al., 1989; Weckx et al., 1996), thereby inducing an increase in ΦPI, without taking part in the damaging reaction itself. Indeed, Ouzounidou et al. (1997) suggest that excess Cu2+ inhibits the process of light adaptation in intact leaves. The data presented here cannot unequivocally distinguish between these two possibilities. However, the protective mechanisms are expected to be induced upon saturation of photosynthesis (Demmig-Adams and Adams, 1996), whereas ΦPI was independent of light intensity both in the presence and in the absence of excess copper. This finding suggests that copper directly enhances the damaging reaction.
Elucidation of the mechanism by which copper speeds up photoinhibition is hampered by the fact that the mechanism of photoinhibition is unknown in vivo. Two main hypotheses on the molecular mechanism of photoinhibition have been put forward. The acceptor-side mechanism (Vass et al., 1992) depends on accumulation of double-reduced QA, and would therefore be enhanced by a Cu2+-induced inhibition of electron transfer from QA to QB (Yruela et al., 1991, 1992). However, the acceptor-side mechanism probably is not the mechanism of photoinhibition in vivo (Tyystjärvi and Aro, 1996). On the other hand, Cu2+-induced enhancement of donor-side inhibition would be conceivable, since excess Cu2+ inhibits electron donation from water to PSII (Schröder et al., 1994; Jegerschöld et al., 1995). An argument against this mechanism is that donor-side inhibition proceeds in the absence of O2, and O2 has been shown to affect photoinhibition in vivo (Van Wijk and Krause, 1992; Leitsch et al., 1994). Donor-side-induced inhibition of PSII was seen when a huge Cu2+ concentration was used in vitro (Jegerschöld et al., 1995).
The effect of copper on ΦPI was linear in the range of 10 to 110 copper ions per PSII, suggesting that the copper effect is caused by free copper ions or binding of copper to one binding site in PSII. The copper concentrations of chloroplasts may also differ from the overall concentrations in the leaves.
In an earlier in vivo study, only a minor excess of Cu2+ in the growth medium of the green alga Chlorella pyrenoidosa was found to inhibit the recovery from photoinhibition without affecting the rate of the damaging step (Vavilin et al., 1995). Our results show that in a higher plant excess copper has a major effect on the damaging reaction, but we also addressed the question of whether copper has additional, physiologically important effects on the repair mechanism.
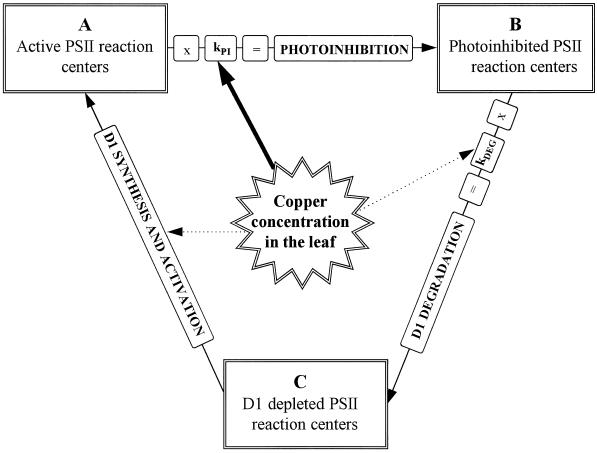
Figure 8 summarizes our findings on the effect of excess copper on photoinhibition in vivo. Our results suggest that the copper-induced decrease in the equilibrium level of active PSII is mainly caused by an increase in ΦPI.
Figure 8.
Model of the effect of copper on the repair cycle of photoinhibition. In the presence of lincomycin the behavior of the model (without copper effects) is determined by Equations 2 and 3.
The repair of PSII after photoinhibition starts with degradation of the damaged D1 protein. The resolution of the D1 data does not allow strong conclusions, but it is clear that the D1 protein of the photoinhibited PSII centers was degraded in both Cu2+-treated and control plants (Fig. 3), and the data do not suggest any retardation of the degradation reaction by excess copper. This result is in contrast with the in vitro results of Yruela et al. (1996b), which essentially showed that the Cu2+-induced enhancement of photoinhibition was not accompanied by enhanced degradation of the D1 protein.
The effects on D1-protein synthesis are not directly accessible from our data because no good mathematical model is available and because PSII heterogeneity may further complicate the cycle (Melis, 1991) from the simple model shown in Figure 8. A feedback mechanism in D1 synthesis of cyanobacteria has been suggested (Tyystjärvi et al., 1996), and in higher plants, D1-protein synthesis is adjusted to match the rate of the photoinhibition-induced degradation (Kettunen et al., 1997). The constancy of the level of D1 protein in photoinhibition experiments both in the presence and absence of excess copper (Fig. 7) suggests that neither the synthesis rate of the D1 protein nor the feedback mechanism is significantly affected by the Cu2+ treatments.
Plants can be divided into three categories according to their reaction to excess Cu2+ (Baker, 1981): an average plant such as bean is of the “indicator” type and takes up metal ions at a linear rate according to the amount of metal ions in the soil; “excluders” are able to keep the metal ions outside of the roots (DeVos et al., 1991); and a few grasses are Cu2+-tolerant “accumulators” or metallophytes (Ernst et al., 1992). Trees usually accumulate heavy metals in their roots (Kahle, 1993), and indeed, our preliminary experiments on birch have shown that under hydroponic growth conditions, translocation of excess Cu2+ to leaves is very slow, and Cu2+-induced damage is mainly targeted to roots (E. Pätsikkä, E. Tyystjärvi, and E.-M. Aro, unpublished results).
It is obvious that no single mechanism can explain everything about copper toxicity in plants. Photoinhibition is a universal cost factor decreasing the overall yield of photosynthesis, and both in vitro (Mohanty et al., 1989; Yruela et al., 1996b) and in vivo evidence (this study) suggests that excess copper speeds up photoinhibition. Like some other environmental constraints such as low temperature, excess copper displaces the equilibrium between photoinhibition and recovery reactions toward a more inhibited state, enhancing the adverse effects of light. Earlier results from a green alga and maize (Vavilin et al., 1995; Ouzounidou et al., 1997) suggest that such displacement may occur in different ways in different photosynthetic organisms. This behavior suggests that photoinhibition may contribute significantly to copper toxicity in indicator-type species.
ACKNOWLEDGMENT
We thank Hannu Raitio from the Finnish Forest Research Institute at Parkano station for friendly, flexible, and valuable services concerning the analysis of basic elements.
Abbreviations:
- Fm
maximal fluorescence
- Fv
variable fluorescence
- Fv/Fm
ratio of variable to maximal fluorescence
- ΦPI
quantum yield of photoinhibition
- G
relationship between leaf copper concentration and the reaction rate constant of photoinhibition
- Ia
photon flux density absorbed by PSII of the leaf
- KDEG
reaction rate constant of D1-protein degradation
- KPI
reaction rate constant of photoinhibition
- QA and QB
primary and secondary electron-accepting plastoquinones of PSII
- ρPI
effect of leaf copper concentration on KPI
Footnotes
This study was supported by the Academy of Finland.
LITERATURE CITED
- Aro E-M, Kettunen R, Tyystjärvi E. ATP and light regulate D1 protein modification and degradation: role of D1* in photoinhibition. FEBS Lett. 1992;297:29–33. doi: 10.1016/0014-5793(92)80320-g. [DOI] [PubMed] [Google Scholar]
- Aro E-M, Virgin I, Andersson B. Photoinhibition of photosystem II: inactivation, protein damage and turnover. Biochim Biophys Acta. 1993;1143:113–134. doi: 10.1016/0005-2728(93)90134-2. [DOI] [PubMed] [Google Scholar]
- Baker AJM. Accumulators and excluders: strategies in the response of plants to heavy metals. J Plant Nutr. 1981;3:643–654. [Google Scholar]
- Cedeno-Maldonado A, Swader JA. The cupric ion as an inhibitor of photosynthetic electron transport in isolated chloroplasts. Plant Physiol. 1972;50:698–701. doi: 10.1104/pp.50.6.698. [DOI] [PMC free article] [PubMed] [Google Scholar]
- Cleland RE, Ramage RT, Critchley C. Photoinhibition causes loss of photochemical activity without degradation of D1 protein. Aust J Plant Physiol. 1990;17:641–651. [Google Scholar]
- Clijsters H, Van Assche F. Inhibition of photosynthesis by heavy metals. Photosynth Res. 1985;7:31–40. doi: 10.1007/BF00032920. [DOI] [PubMed] [Google Scholar]
- Demmig-Adams B, Adams WW., III The role of xanthophyll cycle carotenoids in the protection of photosynthesis. Trends Plant Sci. 1996;1:21–26. [Google Scholar]
- DeVos CHR, Schat H, Vooijs R, Ernst WHO. Copper-induced damage to the permeability barrier in the roots of Silene cucubalus. J Plant Physiol. 1989;135:164–169. [Google Scholar]
- Ernst WHO, Verkleij JAC, Schat H. Metal tolerance in plants. Acta Bot Neerl. 1992;41:229–248. [Google Scholar]
- Fernandes JC, Henriques FS. Biochemical, physiological and structural effects of excess copper in plants. Bot Rev. 1991;57:246–273. [Google Scholar]
- Hoagland DR, Arnon DI. The water culture method for growing plants without soil. Calif Agric Exp Stn Circ. 1950;347:1–32. [Google Scholar]
- Idle PB, Proctor CW. An integrating sphere leaf chamber. Plant Cell Environ. 1983;6:437–439. [Google Scholar]
- Jegerschöld C, Arellano JB, Schöder WP, van Kan PJM, Baron M, Styring S. Copper(II) inhibition of electron transfer through photosystem II studied by EPR spectroscopy. Biochemistry. 1995;34:12747–12754. doi: 10.1021/bi00039a034. [DOI] [PubMed] [Google Scholar]
- Kahle H. Response of roots of trees to heavy metals. Environ Exp Bot. 1993;33:99–119. [Google Scholar]
- Kanervo E, Mäenpää P, Aro E-M. D1 protein degradation and psbA transcript levels in Synechocystis PCC 6803 during photoinhibition in vivo. J Plant Physiol. 1993;142:669–675. [Google Scholar]
- Kettunen R, Pursiheimo S, Rintamäki E, Van Wijk K-J, Aro E-M. Transcriptional adjustments of psbA gene expression in the mature chloroplasts during photoinhibition and subsequent repair of photosystem II. Eur J Biochem. 1997;247:441–448. doi: 10.1111/j.1432-1033.1997.00441.x. [DOI] [PubMed] [Google Scholar]
- Kettunen R, Tyystjärvi E, Aro E-M. D1 protein degradation during photoinhibition of intact leaves. FEBS Lett. 1991;290:153–156. doi: 10.1016/0014-5793(91)81247-6. [DOI] [PubMed] [Google Scholar]
- Laemmli UK. Cleavage of structural proteins during the assembly of the head of bacteriophage T4. Nature. 1970;227:680–685. doi: 10.1038/227680a0. [DOI] [PubMed] [Google Scholar]
- Leitsch J, Schnettger B, Critchley C, Krause GH. Two mechanisms of recovery from photoinhibition in vivo: reactivation of photosystem II related and unrelated to D1-protein turnover. Planta. 1994;194:15–21. [Google Scholar]
- Melis A. Dynamics of photosynthetic membrane composition and function. Biochim Biophys Acta. 1991;1058:87–101. [Google Scholar]
- Melis A. Excitation energy transfer: functional and dynamic aspects of lhc(cab) protein. In: Ort DR, Yocum CF, editors. Oxygenic Photosynthesis: The Light Reactions. Dordrecht, The Netherlands: Kluwer Academic Publishers; 1996. pp. 523–538. [Google Scholar]
- Mohanty N, Vass I, Demeter S. Copper toxicity affects photosystem II electron transport at the secondary quinone acceptor, QB. Plant Physiol. 1989;90:175–179. doi: 10.1104/pp.90.1.175. [DOI] [PMC free article] [PubMed] [Google Scholar]
- Ouzounidou G, Moustakas M, Strasser RJ. Sites of copper in the photosynthetic apparatus of maize leaves: kinetic analysis of chlorophyll fluorescence, oxygen evolution, absorption changes and thermal dissipation as monitored by photoacoustic signals. Aust J Plant Physiol. 1997;24:81–90. [Google Scholar]
- Porra RJ, Thompson WA, Kriedemann PE. Determination of accurate extinction coefficients and simultaneous equations for assaying chlorophyll a and b with four different solvents: verification of the concentration of chlorophyll by atomic absorption spectroscopy. Biochim Biophys Acta. 1989;975:384–394. [Google Scholar]
- Prasil O, Adir N, Ohad I. Mechanism of photoinhibition and recovery processes. In: Barber J, editor. Topics in Photoynthesis, Vol 11. Amsterdam, The Netherlands: Elsevier; 1992. pp. 293–348. [Google Scholar]
- Samuelsson G, Öquist G. Effects of copper chloride on photosynthetic electron transport and chlorophyll-protein complexes of Spinacia oleracea. Plant Cell Physiol. 1980;21:445–454. [Google Scholar]
- Sandmann G, Böger P. Copper-mediated lipid peroxidation processes in photosynthetic membranes. Plant Physiol. 1980;66:797–800. doi: 10.1104/pp.66.5.797. [DOI] [PMC free article] [PubMed] [Google Scholar]
- Sandmann G, Böger P (1983) Enzymological function of heavy metals and their role in electron transfer processes of plants. In Encyclopedia of Plant Physiology, New series. Physiological Plant Ecology III: Responses to Chemical and Biological Environment, Vol 12A. Springer-Verlag, Berlin, pp 246–300
- Schnettger B, Critchley C, Santore UJ, Graf M, Krause GH. Relationship between photoinhibition of photosynthesis, D1 protein turnover and chloroplast structure: effects of protein synthesis inhibitors. Plant Cell Eviron. 1994;17:55–64. [Google Scholar]
- Schöder WP, Arellano JB, Bittner T, Baron M, Eckert H-J, Renger G. Flash-induced absorption spectroscopy studies of copper interaction with photosystem II in higher plants. J Biol Chem. 1994;30:32865–32870. [PubMed] [Google Scholar]
- Tyystjärvi E, Ali-Yrkkö K, Kettunen R, Aro E-M. Slow degradation of the D1 protein is related to the susceptibility of low-light-grown pumpkin plants to photoinhibition. Plant Physiol. 1992;100:1310–1317. doi: 10.1104/pp.100.3.1310. [DOI] [PMC free article] [PubMed] [Google Scholar]
- Tyystjärvi E, Aro E-M. The rate constant of photoinhibition, measured in lincomycin-treated leaves, is directly proportional to light intensity. Proc Natl Acad Sci USA. 1996;93:2213–2218. doi: 10.1073/pnas.93.5.2213. [DOI] [PMC free article] [PubMed] [Google Scholar]
- Tyystjärvi E, Mäenpää P, Aro E-M. Mathematical modelling of photoinhibition and photosystem II repair cycle. I. Photoinhibition and D1 protein degradation in vitro and in the absence of chloroplast protein synthesis in vivo. Photosynth Res. 1994;41:439–449. doi: 10.1007/BF02183046. [DOI] [PubMed] [Google Scholar]
- Tyystjärvi T, Mulo P, Mäenpää P, Aro E-M. D1 polypeptide degradation may regulate psbA gene expression at transcriptional and translational level in Synechocystis sp. PCC 6803. Photosynth Res. 1996;47:111–120. doi: 10.1007/BF00016174. [DOI] [PubMed] [Google Scholar]
- Uribe EG, Stark B. Inhibition of photosynthetic energy conversion by cupric ion. Evidence for Cu2+-coupling factor 1 interaction. Plant Physiol. 1982;69:1040–1045. doi: 10.1104/pp.69.5.1040. [DOI] [PMC free article] [PubMed] [Google Scholar]
- Van Wijk KJ, Krause GH. Oxygen dependence of photoinhibition at low temperature in intact protoplasts of Valerianella locusta L. Planta. 1992;186:135–142. doi: 10.1007/BF00201509. [DOI] [PubMed] [Google Scholar]
- Vass I, Styring S, Hundal T, Koivuniemi A, Aro E-M, Andersson B. Reversible and irreversible intermediates during photoinhibition of photosystem II: stable reduced QA species promote chlorophyll triplet formation. Proc Natl Acad Sci USA. 1992;89:1408–1412. doi: 10.1073/pnas.89.4.1408. [DOI] [PMC free article] [PubMed] [Google Scholar]
- Vavilin DV, Polynov VA, Matorin DN, Venediktov PS. Sublethal concentrations of copper stimulate photosystem II photoinhibition in Chlorella pyrenoidosa. J Plant Physiol. 1995;146:609–614. [Google Scholar]
- Weckx JEJ, Clijsters HMM. Oxidative damage and defense mechanisms in primary leaves of Phaseolus vulgaris as a result of root assimilation of toxic amounts of copper. Physiol Plant. 1996;96:506–512. [Google Scholar]
- Yruela I, Alfonso M, de Zarte IO, Montoya G, Picorel R. Precise location of the Cu(II)-inhibitory binding site in higher plant and bacterial photosynthetic reaction centers as probed by light-induced absorption changes. J Biol Chem. 1993;1993:1684–1689. [PubMed] [Google Scholar]
- Yruela I, Gatzen G, Picorel R, Holzwart AR. Cu(II)-inhibitory effect on photosystem II from higher plants: a picosecond time-resolved fluorescence study. Biochemistry. 1996a;35:9469–9474. doi: 10.1021/bi951667e. [DOI] [PubMed] [Google Scholar]
- Yruela I, Montoya G, Alonso P, Picorel R. Identification of the pheophytin-QA-Fe domain of the reducing side of the photosystem II as the Cu(II)-inhibitory binding side. J Biol Chem. 1991;266:22847–22850. [PubMed] [Google Scholar]
- Yruela I, Montoya G, Picorel R. The inhibitory mechanism of Cu(II) on the photosystem II electron transport from higher plants. Photosynth Res. 1992;33:227–233. doi: 10.1007/BF00030033. [DOI] [PubMed] [Google Scholar]
- Yruela I, Pueyo JJ, Alonso PJ, Picorel R. Photoinhibition of photosystem II from higher plants: effect of copper inhibition. J Biol Chem. 1996b;271:27408–27415. doi: 10.1074/jbc.271.44.27408. [DOI] [PubMed] [Google Scholar]


