

Abstract
Objective
To evaluate the role of cardiac troponin T (cTnT) in predicting death, recurrent ischemic events, and heart failure among community-dwelling persons with first myocardial infarction (MI).
Patients and Methods
Consecutive Olmsted County, Minnesota, residents with an incident MI between November 6, 2002, and December 31, 2007, were studied (N=1177; mean age, 68 years). Maximal cTnT value was measured at a median of 1 day after MI (median, 0.52 ng/mL; interquartile range, 0.16-1.75 ng/mL) and evaluated as a prognostic factor using measures of absolute risk.
Results
During a mean follow-up of 16 months, 276 deaths (23%) occurred, 341 patients (29%) experienced a recurrent ischemic event, and 326 patients (28%) experienced heart failure. A dose-response relationship was demonstrated early after MI between cTnT and the adjusted cumulative incidence of all outcomes. The multivariate-adjusted absolute risk differences (events per 100 patients) between the upper and lower cTnT tertiles at 30 days were 5.8 (95% confidence interval [CI], 1.4-10.2) for death, 5.2 (95% CI, 0.2-10.3) for recurrent ischemic event, and 6.9 (95% CI, 1.4-12.4) for heart failure. These differences were either maintained or increased at 2 years.
Conclusion
In the community, cTnT level predicts death and nonfatal cardiac events independently of other prognostic factors. The increased risk associated with elevated cTnT level appears shortly after MI and persists for at least 2 years.
In 2000, cardiac troponin was recommended as the biomarker of choice for the diagnosis of myocardial infarction (MI) in clinical practice.1,2 Although the association between troponin levels and post-MI prognosis has previously been documented,3-8 these studies consisted mostly of selected clinical trial populations or disease registries, had limited follow-up (eg, 30 days), and reported chiefly on death as the sole outcome. Moreover, published data focus on measures of association that are reported on a relative scale, primarily hazard ratio (HR), which may be less intuitively understood by clinicians and patients than absolute measures of risk.9 We evaluated the prognostic role of cardiac troponin T (cTnT), prospectively measured in all residents of Olmsted County, Minnesota, with a first-ever MI, in subsequent outcomes, including nonfatal events. We used novel methods to assess the adjusted cumulative incidence of outcomes across cTnT categories and to calculate absolute risk differences among these categories, allowing for time-varying associations and accounting for competing risks.10 Our focus on reporting the “real-life” experience of a community resonates with the increasing awareness of and emphasis on comparative effectiveness research,11,12 particularly with the recognized need to study patients who are typical of day-to-day clinical care. Our contemporary cohort, consisting of all incident cases in a geographically defined population with no exclusion criteria, fulfills this need.
Patients and Methods
Study Setting
This research was conducted in Olmsted County, Minnesota, a location well suited for epidemiological studies because complete medical records for residents contain all encounters with medical care professionals in the county. These records are accessible through a centralized system,13 which provides the infrastructure to analyze population-level disease occurrence and outcomes.
Patient Enrollment
After approval by the appropriate institutional review boards, a prospective cohort study was performed. Potential participants included all individuals admitted to an Olmsted County facility between November 6, 2002, and December 31, 2007, with a cTnT level of 0.03 ng/mL or higher (to convert to μg/L, multiply by 1). These persons were prospectively identified through the Department of Laboratory Medicine within 12 hours of their blood draw. Written consent from all patients, or next of kin if consent could not be granted by the patient, was sought by nurse coordinators for inclusion in the study. Unused blood from samples stored for further clinical need was used to measure cardiac biomarkers. If unused blood was not available, another sample was drawn; whenever possible, this draw was in conjunction with another clinically indicated draw. The participation rate in this study was demonstrated to be high, nearly 90% among incident MI patients.14 As part of clinical practice, successive cTnT measurements were performed; this practice did not change during the study period. As recommended, cTnT measurements were made at baseline and after onset of symptoms.1,15 For MI diagnosis, we applied a computerized algorithm that integrated ischemic symptoms, Minnesota code of the electrocardiograms, and cTnT levels.16 This algorithm accounted for circumstances that might invalidate the biomarker values.17 Patients with prior MI were excluded.
cTnT Measurement
The cTnT values were measured repeatedly18 after hospital admission or infarction onset if the patient was already hospitalized (median number of measurements, 5; interquartile range [IQR], 4-7). The highest measurement (maximal cTnT), with a mean value of 1.84 ng/mL, was obtained at a median of 1 day (IQR, 0-2 days) after MI and used for all analyses. Measurements were performed in the Department of Laboratory Medicine and Pathology laboratories (Elecsys 2010; Roche Diagnostics Corp, Indianapolis, IN) using a sandwich electrochemiluminescence immunoassay. The department has robust quality controls in place and is certified by the Clinical Laboratory Improvement Act of 1988 and the College of American Pathologists.16
Additional Clinical Data
The medical record was reviewed to ascertain MI characteristics and severity indices along with cardiovascular risk factors using data recorded as of the index MI hospitalization or at the closest time before hospital admission. Smoking status was classified as current, former, or never. Body mass index was calculated as current weight in kilograms divided by earliest adult height in meters squared. Clinical definitions were used to assess diabetes mellitus,19 hypertension,20 and hyperlipidemia.21 The MI characteristics and severity indices included ST-segment elevation, Q waves, infarct location, left ventricular ejection fraction, and Killip class. Killip class was determined within 24 hours of index MI and analyzed as a categorical variable (class ≥2 vs class 1). Ejection fraction was estimated echocardiographically at the time of the index MI; if ejection fraction was not measured at the time of the MI, the closest measurement within 30 days after MI was used. Echocardiographic data were available for 920 patients (78% of the cohort). Reperfusion therapy or revascularization included coronary artery bypass grafting, percutaneous coronary intervention, or thrombolysis performed during the index hospitalization. Overall comorbidity burden was assessed by the Charlson index.22 Estimated glomerular filtration rate was calculated with the Modification of Diet in Renal Disease Study equation23 using the serum creatinine value at presentation.
Outcome Measures
Primary outcomes were time to death, recurrent ischemic event, and heart failure. All participants were followed up through their complete (inpatient and outpatient) medical records in the community from index time to death or the most recent clinical contact. Multiple sources were used to ascertain death, including autopsy reports, death certificates filed in Olmsted County, obituary notices, and electronic death certificates obtained from the Section of Vital Statistics, Minnesota Department of Health.24 Recurrent ischemic events included recurrent MI and unstable angina pectoris requiring hospitalization and were based on clinical diagnoses.25 The Framingham Heart Study criteria were used to diagnose heart failure. These criteria require the presence of at least 2 major criteria or 1 major criterion in addition to 2 minor criteria26; its ascertainment process in this setting has previously been described in detail.27
Statistical Analyses
For ease of interpretation and presentation, patients were divided into 3 groups of approximately equal size (tertiles) according to cTnT distribution. Baseline characteristics across these tertiles are presented as mean ± SD or median (IQR) for continuous variables and frequencies for categorical variables.
Adjusted cumulative incidence curves for (1) all-cause mortality, (2) recurrent ischemic event, and (3) heart failure according to cTnT tertiles were projected for up to 24 months after the index MI using the direct adjustment method.28,29 Adjustment was made for demographic variables, cardiovascular risk factors, MI characteristics and severity indices, and comorbidities. Because the Charlson score was adjusted for as a measure of overall comorbidity burden, specific components of this index (ie, heart failure and diabetes mellitus) were not included individually in the models. Because in the presence of competing risks, standard survival predictions may substantially overestimate the absolute risk of the event of interest,10 death was treated as a competing risk in the analyses of recurrent ischemic events and heart failure, adopting the Fine and Gray model for a subdistribution function.30 Stratified proportional hazards models were used for all outcomes, allowing time-varying associations for the cTnT categories. Adjusted risk differences and 95% confidence intervals (CIs) among the cTnT tertiles at predefined periods (0-30 days, 0-180 days, 0-12 months, and 0-24 months) were estimated for each outcome.28,29 Lastly, adjusted HRs and 95% CIs in cTnT tertiles were estimated using standard Cox models, and effect modification by ST-segment elevation was tested. To assess whether the association between cTnT and outcomes persists beyond 30 days, a landmark analysis was performed between 1 month and 24 months.
Missing values did not exceed 1% in any of the covariates used in the regression analyses, except for ejection fraction (22%), for which missing values were imputed and analyzed with the multiple imputation method.31 The Harrell C statistic32 was used to assess model discrimination; this represents the area under the receiver operating characteristic curve and accounts for time to event (death: 0.81; 95% CI, 0.79-0.83; recurrent ischemic event: 0.63; 95% CI, 0.60-0.66; and heart failure: 0.83; 95% CI, 0.82-0.85; based on fully adjusted models). An exponential association between cTnT and outcomes was assessed but not detected. Analyses were performed using SAS statistical software, version 8.2 (SAS Institute Inc, Cary, NC).
Results
A total of 1177 participants (mean age, 68 years; 44% women) were included in the analysis. Maximal cTnT was inversely and weakly correlated with ejection fraction (rs=−0.25) and age (rs=−0.18) but not with body mass index. In a subsample with a cTnT value available at day 3 (n=457 [39%]), a strong correlation (rs=0.94) was found with the maximal measured cTnT level. Baseline clinical characteristics across cTnT tertiles are given in Table 1. Higher cTnT levels were associated with younger age, male sex, ST-segment elevation, Q waves, lower ejection fraction, higher estimated glomerular filtration rate, and more frequent use of reperfusion or revascularization during hospitalization.
TABLE 1.
Baseline Characteristics Across cTnT Tertilesa
| Characteristic | All patients (N=1177) | cTnT tertile |
||
|---|---|---|---|---|
| Lower (n=396) | Middle (n=388) | Upper (n=393) | ||
| Cutoff cTnT level (ng/mL)b | ≤0.22 | 0.23-1.17 | ≥1.18 | |
| Sociodemographic variables | ||||
| Age (y), mean ± SD | 68.4±15.3 | 70.9±14.5 | 70.0±15.2 | 64.4±15.2 |
| Female | 519 (44) | 198 (50) | 193 (50) | 128 (33) |
| White | 1126 (96) | 379 (96) | 372 (96) | 375 (95) |
| Cardiovascular risk factors | ||||
| Hypertension | 818 (70) | 295 (75) | 278 (72) | 245 (62) |
| Hyperlipidemia | 729 (62) | 246 (62) | 240 (62) | 243 (62) |
| Current or former smoking | 709 (60) | 244 (62) | 218 (56) | 247 (63) |
| Body mass index, mean ± SD | 28.5±6.5 | 28.3±6.8 | 28.0±6.2 | 29.2±6.3 |
| MI characteristics, severity indices, and comorbid conditions | ||||
| ST-segment elevation MI | 233 (18) | 18 (5) | 56 (14) | 159 (41) |
| Q-wave MI | 588 (55) | 174 (49) | 156 (44) | 258 (69) |
| Anterior MI | 446 (38) | 153 (39) | 118 (30) | 175 (45) |
| Killip class >1 | 339 (29) | 110 (28) | 99 (26) | 130 (33) |
| Ejection fraction (%), mean ± SD | 53±13 | 56±13 | 54±13 | 51±12 |
| Reperfusion or revascularization during hospitalization | 600 (51) | 115 (29) | 190 (49) | 295 (75) |
| Charlson index score, median (IQR) | 1 (0-3) | 2 (0-4) | 1 (0-3) | 1 (0-2) |
| Diabetes mellitus | 288 (25) | 103 (26) | 89 (23) | 96 (24) |
| Heart failure history | 191 (16) | 101 (26) | 57 (15) | 33 (8) |
| Estimated glomerular filtration rate (mL/min/1.73 m2), mean ± SD | 59±24 | 55±24 | 58±23 | 65±24 |
| Troponin measurements | ||||
| Maximal cTnT (ng/mL), median (IQR) | 0.52 (0.16-1.75) | 0.11 (0.07-0.16) | 0.52 (0.34-0.76) | 3.05 (1.75-5.76) |
| Time to maximal cTnT (d), median (IQR) | 1 (0-2) | 1 (0-2) | 1 (1-3) | 1 (0-2) |
| No. of cTnT measurements, median (IQR) | 5 (4-7) | 4 (3-6) | 5 (4-7) | 5 (4-7) |
Data are presented as No. (percentage) of patients unless indicated otherwise.
cTnT = cardiac troponin T; IQR = interquartile range; MI = myocardial infarction.
To convert cTnT to μg/L, multiply by 1.
During a mean ± SD follow-up of 16±10 months, among the 1177 participants, 276 deaths (23%) occurred, 341 patients (29%) experienced recurrent ischemic event, and 326 patients (28%) experienced heart failure. After multivariate adjustment, a clear dose-response relationship was observed between cTnT tertiles and the cumulative incidence of death, recurrent ischemic event, and heart failure (Figure). The adjusted cumulative incidence estimates in increasing cTnT tertiles at 30 days were 6.9%, 5.8%, and 12.7% for death; 10.2%, 12.7%, and 15.4% for recurrent ischemic event; and 17.9%, 19.0%, and 24.8% for heart failure. At 24 months, the respective estimates were 23.1%, 25.2%, and 29.0% for death; 28.4%, 33.9%, and 34.0% for recurrent ischemic event; and 24.2%, 28.8%, and 34.1% for heart failure. The adjusted absolute risk differences of these outcomes among the cTnT tertiles at predefined periods during follow-up are presented in Table 2. After 30 days, the estimated excess numbers of cases per each 100 patients in the upper vs lower cTnT tertiles were 5.8 (95% CI, 1.4-10.2) for death, 5.2 (95% CI, 0.2-10.3) for recurrent ischemic event, and 6.9 (95% CI, 1.4-12.4) for heart failure. After 24 months, the respective estimates were 5.9 (95% CI, −1.2 to 12.9) for death, 5.6 (95% CI, −3.5 to 14.7) for recurrent ischemic event, and 9.9 (95% CI, 1.1-18.7) for heart failure.
FIGURE.
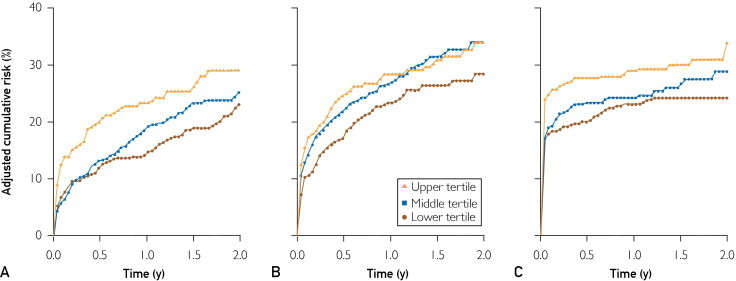
Cumulative risk probabilities of all-cause death (A), recurrent ischemic event (B), and heart failure (C) across cardiac troponin T tertiles, using the direct adjustment method based on stratified Cox models. Adjustment was made for age, sex, ST-segment elevation myocardial infarction (MI), anterior MI, ejection fraction, Killip class, reperfusion or revascularization during hospitalization, smoking, hypertension, hyperlipidemia, body mass index, Charlson index, and estimated glomerular filtration rate. For the analyses of recurrent ischemic events and heart failure, death was considered a competing event.
TABLE 2.
Multivariate-Adjusted Absolute Risk Differences: Excess Events per 100 Patients for Death, Recurrent Ischemic Event, and Heart Failure Among cTnT Tertiles at Different Time Points During Follow-upa
| cTnT tertile comparison | Excess events (95% CI) during follow-up period |
|||
|---|---|---|---|---|
| 0-30 d | 0-180 d | 0-12 mo | 0-24 mo | |
| Death | ||||
| Upper vs lower | 5.8 (1.4-10.2) | 7.9 (2.6-13.2) | 8.7 (3.1-14.4) | 5.9 (−1.2 to 12.9) |
| Middle vs lower | −1.0 (−4.0 to 1.9) | 1.1 (−2.8 to 5.0) | 4.2 (−0.2 to 8.5) | 2.1 (−3.7 to 7.8) |
| Upper vs middle | 6.9 (2.5-11.2) | 6.8 (1.5-12.1) | 4.6 (−1.0 to 10.1) | 3.8 (−2.9 to 10.5) |
| Recurrent ischemic eventb | ||||
| Upper vs lower | 5.2 (0.2-10.3) | 7.6 (1.1-14.0) | 5.0 (−2.2 to 12.2) | 5.6 (−3.5 to 14.7) |
| Middle vs lower | 2.5 (−2.0 to 7.0) | 4.9 (−0.8 to 10.5) | 3.6 (−2.7 to 9.9) | 5.5 (−2.3 to 13.3) |
| Upper vs middle | 2.7 (−2.2 to 7.7) | 2.7 (−3.5 to 8.8) | 1.4 (−5.3 to 8.1) | 0.1 (−8.4 to 8.6) |
| Heart failureb | ||||
| Upper vs lower | 6.9 (1.4-12.4) | 7.7 (1.8-13.6) | 5.9 (−0.4 to 12.1) | 9.9 (1.1-18.7) |
| Middle vs lower | 1.1 (−3.9 to 6.2) | 3.3 (−2.1 to 8.8) | 1.1 (−4.7 to 6.9) | 4.6 (−1.9 to 11.1) |
| Upper vs middle | 5.8 (0.8-10.7) | 4.3 (−0.9 to 9.6) | 4.8 (−0.7 to 10.2) | 5.3 (−3.3 to 13.9) |
Risk differences were estimated at the end of the periods. Adjustment was made for age, sex, ST-segment elevation MI, anterior MI, ejection fraction, Killip class, reperfusion or revascularization during hospitalization, smoking, hypertension, hyperlipidemia, body mass index, Charlson index, and estimated glomerular filtration rate. CI = confidence interval; cTnT = cardiac troponin T; MI = myocardial infarction.
With death considered a competing event.
The adjusted HR (95% CI) for death, recurrent ischemic event, and heart failure in cTnT tertiles (overall and period specific) are listed in Table 3. An increased risk was observed for all outcomes in the upper vs lower cTnT tertiles during both short-term and longer-term follow-up, except for recurrent ischemic events beyond 30 days.
TABLE 3.
Adjusted HRs (95% CIs) of Death, Recurrent Ischemic Event, and Heart Failure in cTnT Tertiles at Different Periods During Follow-up
| Event | HR (95% CI) by cTnT Tertile |
||
|---|---|---|---|
| Lower | Middle | Upper | |
| Death | |||
| First 30 d (n=94) | 1 (reference) | 0.79 (0.46-1.36) | 1.80 (1.04-3.13) |
| 1-24 mo (n=170) | 1 (reference) | 1.47 (1.02-2.11) | 1.74 (1.06-2.84) |
| Overall (N=264) | 1 (reference) | 1.22 (0.90-1.66) | 1.83 (1.26-2.66) |
| Recurrent ischemic event | |||
| First 30 d (n=153) | 1 (reference) | 1.32 (0.86-2.05) | 1.72 (1.07-2.75) |
| 1-24 mo (n=181) | 1 (reference) | 1.22 (0.84-1.78) | 1.12 (0.71-1.75) |
| Overall (N=334) | 1 (reference) | 1.26 (0.95-1.68) | 1.35 (0.98-1.87) |
| Heart failure | |||
| First 30 d (n=260) | 1 (reference) | 1.01 (0.70-1.45) | 1.48 (1.02-2.15) |
| 1-24 mo (n=65) | 1 (reference) | 2.02 (0.96-4.24) | 1.92 (0.86-4.31) |
| Overall (N=325) | 1 (reference) | 1.11 (0.79-1.57) | 1.51 (1.06-2.14) |
Models are adjusted for age, sex, current and former smoking, ST-segment elevation myocardial infarction, anterior myocardial infarction, ejection fraction, Killip class, reperfusion or revascularization during hospitalization, hypertension, hyperlipidemia, body mass index, Charlson index, and estimated glomerular filtration rate. CI = confidence interval; cTnT = cardial troponin T; HR = hazard ratio.
Assessing effect modification by ST-segment elevation revealed a borderline significant interaction with recurrent ischemic event at 30 days (P=.06). Accordingly, the adjusted HR in the upper vs lower cTnT tertile was 1.96 (95% CI, 1.18-3.24) in non–ST-segment elevation and 0.75 (95% CI, 0.21-2.70) in ST-segment elevation MI.
Discussion
In this prospective cohort study of contemporary patients with first MI, maximal cTnT value was predictive of death, recurrent ischemic events, and heart failure. These associations followed a dose-response pattern and were independent of several key established prognostic factors. The worse prognosis associated with elevated cTnT level was demonstrated immediately after MI and maintained for at least 2 years. In absolute terms, the largest risk differences between the cTnT categories were found for heart failure, whereas more moderate differences were seen for death and recurrent ischemic event. Conversely, on a relative scale, differences were most substantial for death. The maximal cTnT value (obtained typically on day 1) was closely correlated with the value from day 3, reported to correlate best with magnetic resonance imaging–determined infarct size.33,34 Thus, our data are consistent with the association between the size of MI and outcomes, particularly among incident cases, and underscore that maximal cTnT value measured clinically can be used as a suitable indicator of MI severity.
For detection of myocardial cell injury, cardiac troponins are considered ideal biochemical markers because of their high sensitivity and specificity, thus providing the ability to detect even minor amounts of myocardial damage. Myocardial necrosis produces an initial release of troponin from an early releasable pool referred to as “cytosolic.”35 Rapid access from this compartment allows detection shortly after MI.36 Values usually peak by 12 to 24 hours, and a gradual return to normal occurs generally within 7 to 14 days. Although the exact mechanism remains to be elucidated, data suggest that patients with elevated troponin levels, especially with non–ST-segment elevation MI, have more coronary thrombi, more complex lesions, and impaired coronary flow.37 In addition, there are data linking cTnT level measured at 72 hours after MI to infarct size, regardless of reperfusion status.33,34 Finally, previous studies have shown that troponin elevation was associated with subsequent cardiac events in patients with acute coronary syndromes, probably as a reflection of severe anatomical disease.3-8 However, several important limitations of previous studies hinder their clinical applicability. First, the available data were mostly derived from post hoc analyses of controlled clinical trials or disease registries; therefore, the generalizability of their findings is uncertain.38,39 Second, previous publications focused primarily on short-term mortality as the outcome of interest, with few data available on longer-term, nonfatal cardiovascular end points, such as heart failure and recurrent ischemic events. Furthermore, measures of absolute risk, which are highly informative and complementary to relative risk measures40,41 and may be more easily understood by clinicians and patients,9 have not been previously reported.
Thus, the present data provide novel information on the prognostic value of cTnT after MI. We studied a population-based cohort of incident MI patients, relying on standardized criteria to define MI, and evaluated nonfatal cardiovascular end points and death ascertained with similar rigor using the complete (inpatient and outpatient) medical records in the community. The use of a contemporary cohort of unselected patients from a geographically defined population is an important strength because of its relevance to real-world clinical practice. Indeed, it was previously demonstrated that the external validity of studies based on clinical trial participants is questionable,38 whereas studies that use administrative or registry data often lack essential clinical details and are hence more prone to misclassification bias and confounding.42,43 Importantly, the same cTnT assay was used throughout the entire study period. Moreover, we applied advanced analytical methods to assess absolute measures of association between cTnT and outcomes. In doing so, we were able to demonstrate not only that cTnT is predictive of death, recurrent ischemic events, and heart failure but also to report the differences in the results obtained from absolute and relative risk estimates and between short-term and long-term outcomes. We also found exploratory evidence of a stronger association between cTnT and recurrent ischemic event in non–ST-segment elevation than in ST-segment elevation MI, which is consistent with previous reports.3 Indeed, in patients with non–ST-segment elevation MI, angiographic data suggest the presence of complex plaques, more thrombi, more extensive disease, and reduced Thrombolysis in Myocardial Infarction flow grades when troponin levels are elevated.44,45
Potential limitations of this study are important to consider. Even though Olmsted County is becoming more diverse, US whites comprise most of the study population. Therefore, our findings should be confirmed in different racial and ethnic groups and in other data sets. Reflecting the changing epidemiology of MI, in which non–ST-segment elevation now constitutes most MI,46,47 only 20% of our cohort presented with ST-segment elevation. Additional assessment of differential associations between cTnT and post-MI outcomes by MI type is therefore warranted. Although multivariate adjustment was performed for many prognostic factors, residual confounding might have remained due to unmeasured characteristics, including angiographic data. In addition, maximal cTnT may not be accurate in patients who are rapidly reperfused. Eventually, the incremental value of cTnT measurement over standard risk scores in risk stratification after MI should be quantified.48
Conclusion
This prospective, community-based cohort study of incident MI patients indicates that in clinical practice cTnT levels strongly predict adverse outcomes, including death, recurrent ischemic events, and heart failure. These associations are independent of well-established prognostic factors, show a dose-response pattern, and appear early after MI. Thus, elevated cTnT levels can identify high-risk patients who may benefit from close follow-up and early initiation of therapies proven to improve outcomes.
Footnotes
Grant Support: This work was supported in part by National Institutes of Health grant R01-HL59205 and the Rochester Epidemiology Project (grant number R01-AG034676; Principal Investigator: Walter A. Rocca, MD, MPH). Dr Roger is an Established Investigator of the American Heart Association. The funding sources played no role in the design, conduct, or reporting of this study.
Potential Competing Interests: Dr Jaffe is a consultant for the following companies: Beckman, Siemens, Critical Diagnostics, Ortho Clinical Diagnostics, Abbott, Roche Inverness, Pfizer, and Amgen. The remaining authors report no conflicts.
References
- 1.Alpert J.S., Thygesen K., Antman E., Bassand J.P. Myocardial infarction redefined—a consensus document of The Joint European Society of Cardiology/American College of Cardiology Committee for the redefinition of myocardial infarction. J Am Coll Cardiol. 2000;36(3):959–969. doi: 10.1016/s0735-1097(00)00804-4. [published correction appears in J Am Coll Cardiol. 2001;37(3):973] [DOI] [PubMed] [Google Scholar]
- 2.Jaffe A.S., Babuin L., Apple F.S. Biomarkers in acute cardiac disease: the present and the future. J Am Coll Cardiol. 2006;48(1):1–11. doi: 10.1016/j.jacc.2006.02.056. [DOI] [PubMed] [Google Scholar]
- 3.Ottani F., Galvani M., Nicolini F.A. Elevated cardiac troponin levels predict the risk of adverse outcome in patients with acute coronary syndromes. Am Heart J. 2000;140(6):917–927. doi: 10.1067/mhj.2000.111107. [DOI] [PubMed] [Google Scholar]
- 4.Aviles R.J., Askari A.T., Lindahl B. Troponin T levels in patients with acute coronary syndromes, with or without renal dysfunction. N Engl J Med. 2002;346(26):2047–2052. doi: 10.1056/NEJMoa013456. [DOI] [PubMed] [Google Scholar]
- 5.Yan A.T., Yan R.T., Tan M. Troponin is more useful than creatine kinase in predicting one-year mortality among acute coronary syndrome patients. Eur Heart J. 2004;25(22):2006–2012. doi: 10.1016/j.ehj.2004.08.010. [DOI] [PubMed] [Google Scholar]
- 6.Prasad A., Rihal C.S., Lennon R.J., Singh M., Jaffe A.S., Holmes D.R., Jr Significance of periprocedural myonecrosis on outcomes after percutaneous coronary intervention: an analysis of preintervention and postintervention troponin T levels in 5487 patients. Circ Cardiovasc Interv. 2008;1(1):10–19. doi: 10.1161/CIRCINTERVENTIONS.108.765610. [DOI] [PubMed] [Google Scholar]
- 7.Lindahl B., Venge P., James S. The new high-sensitivity cardiac troponin T assay improves risk assessment in acute coronary syndromes. Am Heart J. 2010;160(2):224–229. doi: 10.1016/j.ahj.2010.05.023. [DOI] [PubMed] [Google Scholar]
- 8.Mills N.L., Churchhouse A.M., Lee K.K. Implementation of a sensitive troponin I assay and risk of recurrent myocardial infarction and death in patients with suspected acute coronary syndrome. JAMA. 2011;305(12):1210–1216. doi: 10.1001/jama.2011.338. [DOI] [PubMed] [Google Scholar]
- 9.Lloyd-Jones D.M., Leip E.P., Larson M.G. Prediction of lifetime risk for cardiovascular disease by risk factor burden at 50 years of age. Circulation. 2006;113(6):791–798. doi: 10.1161/CIRCULATIONAHA.105.548206. [DOI] [PubMed] [Google Scholar]
- 10.Wolbers M., Koller M.T., Witteman J.C., Steyerberg E.W. Prognostic models with competing risks: methods and application to coronary risk prediction. Epidemiology. 2009;20(4):555–561. doi: 10.1097/EDE.0b013e3181a39056. [DOI] [PubMed] [Google Scholar]
- 11.Roger V.L. Cardiovascular disease surveillance in the comparative effectiveness landscape. Circ Cardiovasc Qual Outcomes. 2009;2(5):404–406. doi: 10.1161/CIRCOUTCOMES.109.901249. [DOI] [PMC free article] [PubMed] [Google Scholar]
- 12.Sox H.C., Greenfield S. Comparative effectiveness research: a report from the Institute of Medicine. Ann Intern Med. 2009;151(3):203–205. doi: 10.7326/0003-4819-151-3-200908040-00125. [DOI] [PubMed] [Google Scholar]
- 13.Melton L.J., III History of the Rochester Epidemiology Project. Mayo Clin Proc. 1996;71(3):266–274. doi: 10.4065/71.3.266. [DOI] [PubMed] [Google Scholar]
- 14.Gerber Y., Jacobsen S.J., Killian J.M., Weston S.A., Roger V.L. Participation bias assessment in a community-based study of myocardial infarction, 2002-2005. Mayo Clin Proc. 2007;82(8):933–938. doi: 10.4065/82.8.933. [DOI] [PubMed] [Google Scholar]
- 15.Luepker R.V., Apple F.S., Christenson R.H. Case definitions for acute coronary heart disease in epidemiology and clinical research studies: a statement from the AHA Council on Epidemiology and Prevention; AHA Statistics Committee; World Heart Federation Council on Epidemiology and Prevention; the European Society of Cardiology Working Group on Epidemiology and Prevention; Centers for Disease Control and Prevention; and the National Heart, Lung, and Blood Institute. Circulation. 2003;108(20):2543–2549. doi: 10.1161/01.CIR.0000100560.46946.EA. [DOI] [PubMed] [Google Scholar]
- 16.Roger V.L., Killian J.M., Weston S.A. Redefinition of myocardial infarction: prospective evaluation in the community. Circulation. 2006;114(8):790–797. doi: 10.1161/CIRCULATIONAHA.106.627505. [DOI] [PubMed] [Google Scholar]
- 17.Jaffe A.S. Elevations in cardiac troponin measurements: false false-positives: the real truth. Cardiovasc Toxicol. 2001;1(2):87–92. doi: 10.1385/ct:1:2:087. [DOI] [PubMed] [Google Scholar]
- 18.Muller-Bardorff M., Hallermayer K., Schroder A. Improved troponin T ELISA specific for cardiac troponin T isoform: assay development and analytical and clinical validation. Clin Chem. 1997;43(3):458–466. [PubMed] [Google Scholar]
- 19.Report of the Expert Committee on the Diagnosis and Classification of Diabetes Mellitus. Diabetes Care. 1997;20(7):1183–1197. doi: 10.2337/diacare.20.7.1183. [DOI] [PubMed] [Google Scholar]
- 20.The sixth report of the Joint National Committee on prevention, detection, evaluation, and treatment of high blood pressure. Arch Intern Med. 1997;157(21):2413–2446. doi: 10.1001/archinte.157.21.2413. [published correction appears in Arch Intern Med. 1998;158(6):573] [DOI] [PubMed] [Google Scholar]
- 21.Expert Panel on Detection, Evaluation, and Treatment of High Blood Cholesterol in Adults Executive Summary of The Third Report of The National Cholesterol Education Program (NCEP) Expert Panel on Detection, Evaluation, and Treatment of High Blood Cholesterol In Adults (Adult Treatment Panel III) JAMA. 2001;285(19):2486–2497. doi: 10.1001/jama.285.19.2486. [DOI] [PubMed] [Google Scholar]
- 22.Charlson M.E., Pompei P., Ales K.L., MacKenzie C.R. A new method of classifying prognostic comorbidity in longitudinal studies: development and validation. J Chronic Dis. 1987;40(5):373–383. doi: 10.1016/0021-9681(87)90171-8. [DOI] [PubMed] [Google Scholar]
- 23.Levey A.S., Bosch J.P., Lewis J.B., Greene T., Rogers N., Roth D. A more accurate method to estimate glomerular filtration rate from serum creatinine: a new prediction equation. Ann Intern Med. 1999;130(6):461–470. doi: 10.7326/0003-4819-130-6-199903160-00002. [DOI] [PubMed] [Google Scholar]
- 24.Gerber Y., Jacobsen S.J., Frye R.L., Weston S.A., Killian J.M., Roger V.L. Secular trends in deaths from cardiovascular diseases: a 25-year community study. Circulation. 2006;113(19):2285–2292. doi: 10.1161/CIRCULATIONAHA.105.590463. [DOI] [PubMed] [Google Scholar]
- 25.Jokhadar M., Jacobsen S.J., Reeder G.S., Weston S.A., Roger V.L. Sudden death and recurrent ischemic events after myocardial infarction in the community. Am J Epidemiol. 2004;159(11):1040–1046. doi: 10.1093/aje/kwh147. [DOI] [PubMed] [Google Scholar]
- 26.McKee P.A., Castelli W.P., McNamara P.M., Kannel W.B. The natural history of congestive heart failure: the Framingham study. N Engl J Med. 1971;285(26):1441–1446. doi: 10.1056/NEJM197112232852601. [DOI] [PubMed] [Google Scholar]
- 27.Roger V.L., Weston S.A., Redfield M.M. Trends in heart failure incidence and survival in a community-based population. JAMA. 2004;292(3):344–350. doi: 10.1001/jama.292.3.344. [DOI] [PubMed] [Google Scholar]
- 28.Zhang X., Loberiza F.R., Klein J.P., Zhang M.J. A SAS macro for estimation of direct adjusted survival curves based on a stratified Cox regression model. Comput Methods Programs Biomed. 2007;88(2):95–101. doi: 10.1016/j.cmpb.2007.07.010. [DOI] [PubMed] [Google Scholar]
- 29.Zhang X., Zhang M.J. SAS macros for estimation of direct adjusted cumulative incidence curves under proportional subdistribution hazards models. Comput Methods Programs Biomed. 2011;101(1):87–93. doi: 10.1016/j.cmpb.2010.07.005. [DOI] [PMC free article] [PubMed] [Google Scholar]
- 30.Fine J.P., Gray R.J. A proportional hazards model for the subdistribution of a competing risk. J Am Stat Assoc. 1999;94:496–509. [Google Scholar]
- 31.Rubin D. Multiple Imputations for Nonresponse in Surveys. John Wiley & Sons Inc; New York, NY: 1987. [Google Scholar]
- 32.Harrell F.E., Jr, Lee K.L., Mark D.B. Multivariable prognostic models: issues in developing models, evaluating assumptions and adequacy, and measuring and reducing errors. Stat Med. 1996;15(4):361–387. doi: 10.1002/(SICI)1097-0258(19960229)15:4<361::AID-SIM168>3.0.CO;2-4. [DOI] [PubMed] [Google Scholar]
- 33.Giannitsis E., Steen H., Kurz K. Cardiac magnetic resonance imaging study for quantification of infarct size comparing directly serial versus single time-point measurements of cardiac troponin T. J Am Coll Cardiol. 2008;51(3):307–314. doi: 10.1016/j.jacc.2007.09.041. [DOI] [PubMed] [Google Scholar]
- 34.Panteghini M., Cuccia C., Bonetti G., Giubbini R., Pagani F., Bonini E. Single-point cardiac troponin T at coronary care unit discharge after myocardial infarction correlates with infarct size and ejection fraction. Clin Chem. 2002;48(9):1432–1436. [PubMed] [Google Scholar]
- 35.Adams J.E., III, Schechtman K.B., Landt Y., Ladenson J.H., Jaffe A.S. Comparable detection of acute myocardial infarction by creatine kinase MB isoenzyme and cardiac troponin I. Clin Chem. 1994;40(7, pt 1):1291–1295. [PubMed] [Google Scholar]
- 36.Macrae A.R., Kavsak P.A., Lustig V. Assessing the requirement for the 6-hour interval between specimens in the American Heart Association Classification of Myocardial Infarction in Epidemiology and Clinical Research Studies. Clin Chem. 2006;52(5):812–818. doi: 10.1373/clinchem.2005.059550. [DOI] [PubMed] [Google Scholar]
- 37.Wong G.C., Morrow D.A., Murphy S. Treat Angina with Aggrastat and Determine Cost of Therapy with an Invasive or Conservative Strategy-Thrombolysis in Myocardial Infarction: Elevations in troponin T and I are associated with abnormal tissue level perfusion: a TACTICS-TIMI 18 substudy. Circulation. 2002;106(2):202–207. doi: 10.1161/01.cir.0000021921.14653.28. [DOI] [PubMed] [Google Scholar]
- 38.Steg P.G., Lopez-Sendon J., Lopez de Sa E. External validity of clinical trials in acute myocardial infarction. Arch Intern Med. 2007;167(1):68–73. doi: 10.1001/archinte.167.1.68. [DOI] [PubMed] [Google Scholar]
- 39.Tu J.V., Willison D.J., Silver F.L. Impracticability of informed consent in the Registry of the Canadian Stroke Network. N Engl J Med. 2004;350(14):1414–1421. doi: 10.1056/NEJMsa031697. [DOI] [PubMed] [Google Scholar]
- 40.Hernan M.A. The hazards of hazard ratios. Epidemiology. 2010;21(1):13–15. doi: 10.1097/EDE.0b013e3181c1ea43. [DOI] [PMC free article] [PubMed] [Google Scholar]
- 41.Toh S., Hernandez-Diaz S., Logan R., Robins J.M., Hernan M.A. Estimating absolute risks in the presence of nonadherence: an application to a follow-up study with baseline randomization. Epidemiology. 2010;21(4):528–539. doi: 10.1097/EDE.0b013e3181df1b69. [DOI] [PMC free article] [PubMed] [Google Scholar]
- 42.Romano P.S., Roos L.L., Luft H.S., Jollis J.G., Doliszny K., Ischemic Heart Disease Patient Outcomes Research Team A comparison of administrative versus clinical data: coronary artery bypass surgery as an example. J Clin Epidemiol. 1994;47(3):249–260. doi: 10.1016/0895-4356(94)90006-x. [DOI] [PubMed] [Google Scholar]
- 43.Shahian D.M., Silverstein T., Lovett A.F., Wolf R.E., Normand S.L. Comparison of clinical and administrative data sources for hospital coronary artery bypass graft surgery report cards. Circulation. 2007;115(12):1518–1527. doi: 10.1161/CIRCULATIONAHA.106.633008. [DOI] [PubMed] [Google Scholar]
- 44.Okamatsu K., Takano M., Sakai S. Elevated troponin T levels and lesion characteristics in non-ST-elevation acute coronary syndromes. Circulation. 2004;109(4):465–470. doi: 10.1161/01.CIR.0000109696.92474.92. [DOI] [PubMed] [Google Scholar]
- 45.Babuin L., Jaffe A.S. Troponin: the biomarker of choice for the detection of cardiac injury. CMAJ. 2005;173(10):1191–1202. doi: 10.1503/cmaj.050141. [DOI] [PMC free article] [PubMed] [Google Scholar]
- 46.Roger V.L., Weston S.A., Gerber Y. Trends in incidence, severity, and outcome of hospitalized myocardial infarction. Circulation. 2010;121(7):863–869. doi: 10.1161/CIRCULATIONAHA.109.897249. [DOI] [PMC free article] [PubMed] [Google Scholar]
- 47.Yeh R.W., Sidney S., Chandra M., Sorel M., Selby J.V., Go A.S. Population trends in the incidence and outcomes of acute myocardial infarction. N Engl J Med. 2010;362(23):2155–2165. doi: 10.1056/NEJMoa0908610. [DOI] [PubMed] [Google Scholar]
- 48.Pencina M.J., D'Agostino R.B.S., D'Agostino R.B.J., Vasan R.S. Evaluating the added predictive ability of a new marker: from area under the ROC curve to reclassification and beyond. Stat Med. 2008;27:157–172. doi: 10.1002/sim.2929. [DOI] [PubMed] [Google Scholar]