

Abstract
Applications of high-power Terahertz (THz) sources require low-loss transmission lines to minimize loss, prevent overheating and preserve the purity of the transmission mode. Concepts for THz transmission lines are reviewed with special emphasis on overmoded, metallic, corrugated transmission lines. Using the fundamental HE11 mode, these transmission lines have been successfully implemented with very low-loss at high average power levels on plasma heating experiments and THz dynamic nuclear polarization (DNP) nuclear magnetic resonance (NMR) experiments. Loss in these lines occurs directly, due to ohmic loss in the fundamental mode, and indirectly, due to mode conversion into high order modes whose ohmic loss increases as the square of the mode index. An analytic expression is derived for ohmic loss in the modes of a corrugated, metallic waveguide, including loss on both the waveguide inner surfaces and grooves. Simulations of loss with the numerical code HFSS are in good agreement with the analytic expression. Experimental tests were conducted to determine the loss of the HE11 mode in a 19 mm diameter, helically-tapped, three meter long brass waveguide with a design frequency of 330 GHz. The measured loss at 250 GHz was 0.029 ± 0.009 dB/m using a vector network analyzer approach and 0.047 ± 0.01 dB/m using a radiometer. The experimental results are in reasonable agreement with theory. These values of loss, amounting to about 1% or less per meter, are acceptable for the DNP NMR application. Loss in a practical transmission line may be much higher than the loss calculated for the HE11 mode due to mode conversion to higher order modes caused by waveguide imperfections or miter bends.
Keywords: Terahertz, High power, Transmission line, Waveguide, Gyrotron
1 Introduction
Transmission of high-power THz radiation has proved challenging due to the lossy nature of most fundamental mode transmission lines at these frequencies. Both material properties as well as machining tolerances contribute to the limitations imposed on fundamental rectangular or circular waveguide which is often the preferred approach at lower frequencies (GHz range). An overmoded approach to transmission lines has been demonstrated as an efficient and practical solution for high-power THz applications [1-8]. The number of approaches to the design of overmoded transmission lines is quite extensive. Free space beaming techniques rely on propagation of a Gaussian beam via a series of mirrors and/or lenses [9-11]. This approach has low-loss but may have issues of safety and alignment stability. The most common approach is the use of overmoded waveguides, in which the guide radius is much larger than the wavelength. Such waveguides can be corrugated metallic waveguides, dielectric waveguides or dielectric lined metallic waveguides. Free space beaming and corrugated waveguide are closely related, because the fundamental HE11 mode used in corrugated waveguides has a conversion efficiency of 98% [12] to the Gaussian beam which is used in quasi-optical transmission. Extensive reviews of the properties of overmoded waveguides have been published [13,14] for sub-THz and megawatt power level transmission lines. High-power sub-THz transmission lines have been rigorously tested for use in electron cyclotron resonance heating (ECRH) of plasma experiments such as DIII-D [15], ASDEX [16] and LHD [17]. With further research being driven by ITER [18-21], this remains an active area of interest. With overmoded transmission lines, ohmic losses play a greatly reduced role; however, special attention is required to sources of mode conversion caused by misalignments and offsets. Mode conversion to higher order modes results in increased losses, reflections and greatly reduced coupling of the THz radiation to the desired target or sample. Overmoded corrugated waveguides have been used in a variety of applications for the transmission of THz radiation for spectroscopic and plasma heating experiments. The HE11 mode is the most efficient waveguide propagation mode in an overmoded corrugated metallic waveguide with a diameter ≫ 2λ, and having internal circumferential corrugations of rectangular shape with a depth of λ/4 at a pitch of at least 2.5 grooves per λ along the waveguide length [22,23].
Low-loss broad band transmission lines are of great interest for low power THz spectroscopy and imaging [24,25]. To overcome the extremely high losses of simple rectangular or circular waveguides, a variety of different methods are being investigated including dielectric coated metallic tubes [26], dielectric waveguides [27,28], metallic wires [29], parallel metallic plates [30] and photonic crystals [31, 32]. Using dielectric lined metal waveguides, a loss of 1 dB/m has been achieved at frequencies above 1 THz [33]. Many of these techniques employ the use of overmoded waveguides and strive to find modes that can be efficiently coupled to free space THz beams. Currently, these techniques yield losses that are too high for continuous wave (CW) systems with high average power and for systems with transmission lines on the order of multiple meters.
Electron cyclotron emission (ECE) diagnostics on plasma fusion experiments are now requiring the development of transmission lines in the THz band. ECE can be observed at either the fundamental or harmonics of the electron cyclotron frequency, ω = neB/m, where m and e are the electron mass and charge, B is the magnetic field and n = 1, 2, 3… is the harmonic number. With the magnetic field varying significantly within the fusion plasma, these diagnostics require broadband transmission lines for observation of ECE. Additionally, observation at harmonics of the electron cyclotron frequency provide the advantage of not receiving direct interference from the ECRH system that could be active. Frequency selective transmission line components have been developed for direct observation of ECE at ~140 GHz on the ECRH transmission line at TEXTOR [34]. Similar systems are under consideration for ASDEX [35] and ITER [36], which will require operation at higher frequencies. The ITER ECE diagnostic will operate independently of the ECRH transmission line and will observe emission from the plasma at frequencies as high as 0.35 THz [37-39].
In the THz range (>300 GHz), research into high-power (>10 W) transmission lines is being driven by dynamic nuclear polarization (DNP) nuclear magnetic resonance (NMR) experiments which require low-loss and a minimum of mode conversion [40]. For these experiments, the gyrotron and DNP magnets must be sufficiently far apart to avoid mutual field interference [1], requiring transmission of THz radiation over a distance of several meters [8]. It is not possible to use conventional single mode rectangular waveguides for transmission, since the ohmic loss in such guides would be prohibitive. Modern gyrotrons for DNP typically include internal mode converters [41-45] after the interaction region of the gyrotron to transform the THz radiation from the high order TEmn mode in the cavity to a Gaussian beam. For gyrotrons without internal mode converters, alternate configurations can include quasi-optical mode converters external to the gyrotron [5] which produce Gaussian beams. The Gaussian beam then propagates through the dielectric output window of the gyrotron where it can be coupled either to a corrugated waveguide or the quasi-optical setup. The linearly polarized Gaussian beam excites the linearly polarized HE11 mode in the waveguide [46]. Then it is convenient to transmit the HE11 mode to the sample under study with straight sections, miter bends and tapers of corrugated metallic waveguide.
As NMR experiments move to higher field, the frequency that must be transmitted extends further into the THz band. Due to the scaling of the groove size with wavelength, this requires smaller corrugations. Machining individual corrugations becomes increasingly difficult and expensive as the corrugation dimensions shrink with frequency. The machining process necessitates the assembly of many short sections of waveguide. To avoid these machining considerations, creating corrugations with stacked rings has been attempted [3]. Alternatively, tapping a single helical groove is more cost effective for making long sections of corrugated waveguide.
In this paper, we review the design of low-loss corrugated waveguides in Section 2; Section 3 derives the ohmic losses in corrugated waveguides; Section 4 describes simulations for the calculation of ohmic losses with non-ideal groove shapes; Section 5 describes the fabrication of helically-tapped corrugated waveguide; Section 6 presents ohmic loss measurements performed on corrugated waveguide; Section 7 is the summary and conclusions.
2 High-Power Low-Loss Corrugated Metallic THz Transmission Lines
Fig. 1 shows a schematic of a corrugated metallic waveguide with rectangular grooves. The radius a is much larger than a wavelength λ. The corrugations are optimized when the groove depth d ≈ λ/4, period p ≈ λ/3 and groove width w < p/2. The corrugation tooth thickness is denoted by t = p − w. The radial coordinate r extends from the center line of the waveguide and the groove coordinate ξ originates from the base of the groove well. The axial coordinate z is parallel to the centerline.
Fig. 1.
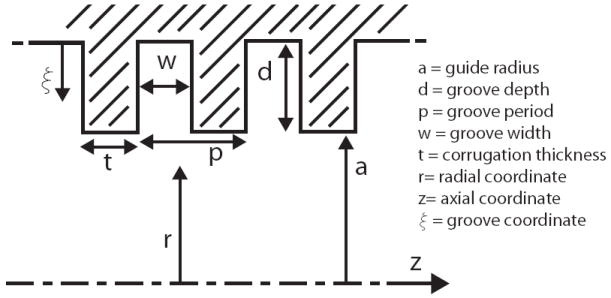
Illustration of a corrugated metallic waveguide which is optimized with a radius a ≫ λ, groove depth d ≈ λ/4, period p ≈ λ/3 and groove width w < p/2.
The modes in a corrugated waveguide have been developed [23], with the lowest order mode being the HE11 hybrid mode. The transverse electric field profile near the optimized groove depth d ≈ λ/4 is given by:
| (1) |
where (r, ϕ) are the radial and angular coordinates and χmn is the nth zero of the mth order Bessel function Jm. For the HE11 mode m = 0, n = 1 and χ01 ≈ 2.405. This expression is valid when the corrugation depth is approximately one quarter wavelength and the radius a is much larger than the wavelength. For perfect excitation of the HE11 mode in the transmission line, the overall transmission line loss is expected to be dominated by losses at right angle bends, called miter bends, and by tilts and offsets in the fabrication and alignment of the waveguide components. The loss in a miter bend originates from diffraction effects and ohmic losses, with the fractional power loss from diffraction
| (2) |
ohmic losses in H-plane miter bends
| (3) |
and E-plane miter bends
| (4) |
where Rs is the surface resistivity, Z0 is the impedance of free space, θ is the bend angle and α is the angle of incidence [14,47]. Fabrication of overmoded corrugated waveguide components requires careful consideration of machining tolerances at the waveguide connections. Tilts and axial offsets can lead to the coupling of the input THz beam to higher order modes of the waveguide, which gives rise to mode conversion losses, resulting in an increase of ohmic losses or decreased coupling to the sample of interest. The fractional power loss due to mode conversion [12,14] for an axial offset, Δa, is
| (5) |
and for a tilt, Δθ, is
| (6) |
While these are significant sources of loss, in practice the loss may be dominated by the imperfections and poor coupling of the THz beam entering the transmission line, resulting in the excitation of higher order modes. This is a result of the non-Gaussian output beam either from the source or upon insertion of an unmatched output beam (due to tilts and offsets) into the waveguide, leading to high losses in the transmission line [21].
Fig. 2(a) shows the transmission line used in a 250 GHz DNP NMR system [1]. The main transmission line is a 22 mm diameter (a = 11 mm) metallic corrugated waveguide made of aluminum. The individually machined corrugations are optimized with d ≈ λ/4 (0.3 mm), w = 0.3 mm and p = 0.4 mm. Two 0.254 m waveguide sections, fifteen 0.124 m waveguide sections and one 0.064 m directional coupler block were assembled with outer diameter clamps to achieve the desired waveguide length. The difference between the measured and theoretical loss is discussed in detail in Section 6. The estimated ohmic loss in the overmoded waveguide of Fig. 2(a) is less than 10−3/m. The loss for the 22 mm diameter waveguide portion of the transmission line of Fig. 2(a) was measured to be less than 1% per meter [1].
Fig. 2.
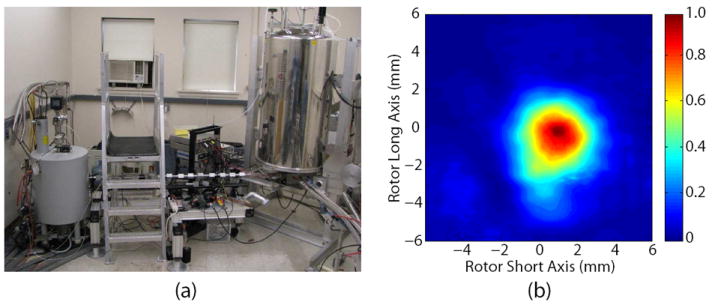
(a) The 250 GHz transmission line connecting the gyrotron output (left) to the NMR spectrometer (right). (b) The measured Gaussian beam emitted from the end of an 8 mm corrugated waveguide and radiated to a distance of 12 mm from the waveguide end.
A directional coupler is used for measuring forward and reverse power on the transmission line shown in Fig. 2(a). A smaller diameter waveguide is necessary for the probe inside the DNP NMR magnet due to limited space. The transition to smaller diameter can be performed with waveguide tapers or mirrors. Bends in the transmission line may be accomplished using a miter bend in the waveguide or using a mirror box. The transmission line of Fig. 2(a) has only one right angle bend, and it is implemented using two mirrors. The mirrors also match the beam from the 22 mm waveguide into the 8 mm waveguide in the NMR probe. Due to losses induced by imperfections in the Gaussian beam quality of the gyrotron and by errors in the alignment of the components of the transmission line, the transmission efficiency from the gyrotron output window to the sample is typically in the 50-80% range [1,48] measured at the 8 mm corrugated waveguide output that radiates onto the sample. Fig. 2(b) is an image of the beam radiated to the sample distance of 12 mm from the end of the corrugated waveguide recorded using a Spiricon Pyrocam III pyroelectric detector.
The transmission line shown in Fig. 2 is only one example of successful transmission lines used in DNP NMR research. Recently, a 13 m transmission line using corrugated waveguides and switches has been successfully implemented on a 260 GHz gyrotron system for DNP NMR [4,5]. A fully optical (mirror) transmission line using a mirror relay line has also recently been implemented for a DNP NMR spectrometer system [49]. Another overmoded smooth-walled waveguide has been successfully implemented at 395 GHz [50] with 55% transmission on a 28 mm diameter waveguide to the base of the DNP magnet and 7% of the output power delivered to the sample. A recently implemented 460 GHz transmission line for DNP applications [2,51,52] has been tested with 40% transmission of power to the sample. The 460 GHz transmission line, shown in Fig. 3(a), is constructed using the same techniques as the 250 GHz transmission line, shown in Fig. 2(a), and consists of a 6 m long, 19 mm diameter corrugated waveguide, which is tapered to a diameter of 4.6 mm once it reaches the probe. The field pattern shown in Figure 3(b) was measured using a Spiricon Pyrocam III pyroelectric detector positioned 10 cm from the aperture of the waveguide at the center point between the gyrotron magnet and NMR spectrometer. Future research will concentrate on making these transmission lines simpler and more efficient.
Fig. 3.
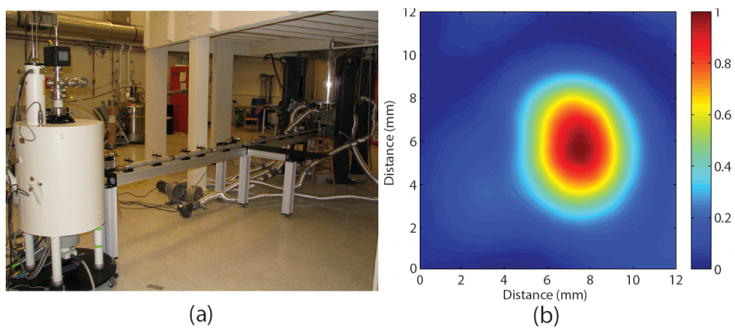
(a)The 460 GHz transmission line connecting the gyrotron output (left) to the NMR spectrometer (right). (b) The measured Gaussian beam emitted from the end of a 19 mm ID corrugated waveguide and radiated to a distance of 10 cm from the waveguide end.
3 Theory of Ohmic Losses in Corrugated Waveguides
Selection of waveguide radius and groove dimensions has severe effects on the ohmic loss in corrugated waveguides, requiring careful understanding of the source of attenuation in these waveguides. Here we derive an analytical formula for the attenuation coefficient of a corrugated metallic waveguide with ideal rectangular grooves. The result was obtained by integrating the field equations over the groove surfaces to obtain the ohmic loss. The electric and magnetic fields of the HE mode at r = a are [23]
| (7) |
| (8) |
where the unit vectors for r/ϕ/z are r̂/ϕ/ẑ, Z0 is the impedance of free space, is the approximate impedance seen at the corrugated surface, k = 2π/λ is the wavenumber, χm = χ01 (1 − 1/2kaZ) [22] and ka ≫ 1. To calculate the attenuation constant for the waveguide we integrate the ohmic losses over the groove shape of one period [53,54]
| (9) |
where ds denotes the surface of the groove, is the surface resistivity, μ is the permeability, f is the frequency, ρ is the bulk resistivity and α has units of Np/m. In the traditional approach, we can rewrite (9) in terms of the fields from (8) and integrate over a flat surface which is represented by the approximate impedance [23]
| (10) |
The result is given by [23]
| (11) |
To improve this calculation, the integral in (9) should be performed over the entire surface of the groove, where (8) is not strictly valid. In [53] this is remedied by using a spatial harmonics representation for the fields inside the waveguide and an infinite set of resonant modes inside the corrugations. Alternatively, we allow for Hϕ to be at a maximum and Ez = 0 at the base of the groove (ξ = 0) for d ≈ λ/4. To satisfy boundary conditions we take . For the z component it is sufficient to calculate the loss on the surface r = a where Hz = hz, which is the same approach used in the impedance approximation method. This leads to the integration
| (12) |
If we separate (12) into the different surfaces of the rectangular groove
| (13) |
and perform the integrations, the attenuation is given by
| (14) |
which can be further simplified in terms of the expression given by
| (15) |
Equation (15) shows that the loss increases as the square of the mode index χm. Thus, mode conversion into high order modes, with large χm, can contribute to greatly enhanced loss on a transmission line. A comparison between (11) (dashed black line) and (15) (solid black line) is shown in Fig. 4 for the HE11 mode with rectangular corrugations, a = 9.5 mm, d = 0.227 mm, p = 0.3175 mm, t/p = 0.5 and ideal brass conductivity. The figure shows attenuation in dB/m which can be obtained from the attenuation in Np/m multiplied by 8.686. As d approaches λ/4, a significant difference develops between (11) (dashed line) and (15) (solid line) because the contribution from hϕ goes to zero in (11) and losses internal to the corrugations are not accounted for as in (15). It should be noted that for the special case of d = λ/4, the expression in (15) is equivalent to the expression for loss given by Dragone [22]
| (16) |
where α2 ≈ 1 for groove shapes with t/p > 0.1.
Fig. 4.
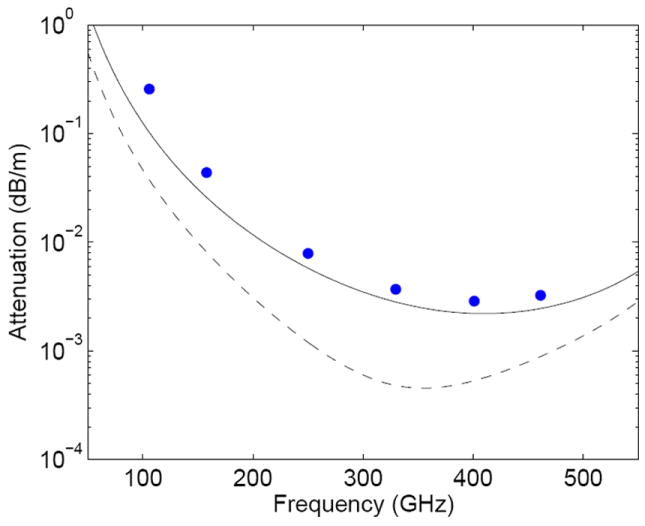
Ohmic losses in overmoded circular corrugated waveguide for rectangular brass (conductivity 1.56 × 10⁷ mhos/m) corrugations as predicted by our theory (solid line) and the impedance approximation method (dashed line). Numerical simulations with HFSS are shown with blue dots.
4 Simulations in HFSS
In order to verify the analytical calculations predicting extremely low-loss propagation of the HE11 mode in corrugated waveguides, we have employed the High Frequency Structure Simulator (HFSS) code. Measurement of the propagation loss for the HE11 mode at the optimum wavelength is dominated by experimental error from the presence of higher order modes or the experimental setup. Additionally, the fabrication of the corrugated waveguide can lead to non-ideal groove geometries that are trapezoidal, triangular or sinusoidal, instead of rectangular which are not accounted for in (15). Proper simulation of these highly overmoded waveguides has proved difficult due to the large physical size and very small power loss involved. However, the idealized physical geometry of a linear corrugated waveguide is highly symmetric. In the direction perpendicular to propagation, the HE11 mode has fourfold symmetry, and in the direction of propagation, the waveguide is symmetric over the geometry of one groove. Using HFSS with the proper symmetry conditions and applying a phase advance along the direction of propagation, the HE11 mode can be analyzed for a variety of groove shapes and frequencies. The magnitude of the electric field in the transverse plane of the corrugated waveguide and at a variety of frequencies is shown in Fig. 5. As seen in Fig. 5, the profile of the HE11 mode is significantly distorted when the frequency of operation is not well matched to the corrugation depth, in close agreement with [53]. The distortion in the field profile is due to the frequency dependent impedance of the corrugation leading to increased ohmic losses at lower frequencies. At the λ/4 condition, the HE11 mode is linearly polarized with the direction of the electric field labeled in Fig. 5(d). As the frequency is lowered, the HE11 mode becomes distorted and is no longer linearly polarized, which would lead to mode conversion if coupling into the transmission line with a Gaussian beam, effectively limiting the bandwidth of the transmission line. The ohmic losses determined by the HFSS computer modeling for the rectangular groove shape (blue dots) are shown in Fig. 4 and are consistent with our model (solid line).
Fig. 5.
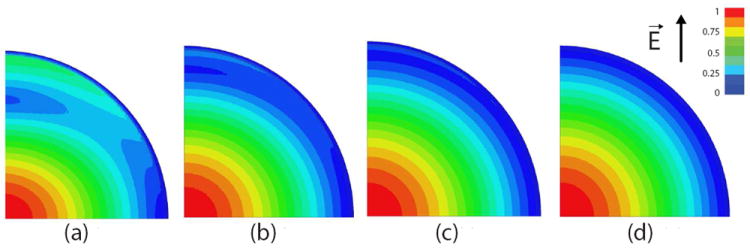
The magnitude of the electric field from HFSS simulations for one period of a rectangular corrugation with a = 9.5 mm, d = 0.227 mm, p = 0.3175 mm, t/p = 0.5 and ideal brass conductivity at (a) 105 GHz, (b) 158 GHz, (c) 250 GHz and (d) 330 GHz.
The machining process for the corrugations can lead to deviations from the ideal rectangular groove shape. These deformations, in the form of trapezoidal, sinusoidal and triangular groove shapes, were found to increase ohmic losses for the corrugated waveguide. Similar deformations also affect the loss on grooved surfaces for diffraction gratings and polarizers [55]. Numerical simulations were performed for the groove shapes shown in Fig. 6(a). The increase in ohmic losses for non-ideal groove shapes results from two effects: alteration of the fields on the surface of the groove and decrease of the effective groove depth relative to the actual depth causing an adjustment to the impedance approximation. Expanding the groove shape in a Fourier series and comparing the weight of the first Fourier term accurately predicts which groove shapes result in higher ohmic losses. Adjusting the groove depth can be used to compensate for the transmission losses for non-rectangular shapes. The effective depth of the grooves (shown in Fig. 6(a)) is listed in Table 1 for various corrugation shapes.
Fig. 6.
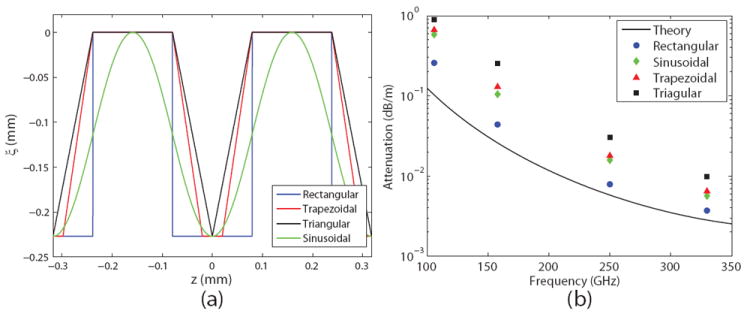
(a)Groove shapes simulated in HFSS with d = 0.227 mm and p = 0.3175 mm given in the groove coordinate system (ξ, z) used in Fig. 1. (b) Ohmic losses in corrugated waveguide simulated in HFSS compared to the impedance approximation method.
Table 1.
Corrugation Shape Depth Correction
| Shape | deffective (normalized) |
|---|---|
|
| |
| Rectangular | 1.00 |
| Trapezoidal | 0.733 |
| Triangular | 0.565 |
| Sinusoidal | 0.785 |
The ohmic losses calculated from the analytical theory and HFSS are shown in Fig. 6(b), with the rectangular (blue dots), trapezoidal (red triangles), sinusoidal (green diamonds) and triangular (black squares) groove shapes. The theoretical attenuation calculated with HFSS of the rectangular groove shapes is in very good agreement with the analytical model (black line). Variations to the groove shape result in increased ohmic losses for the same frequency. As predicted in Table 1 and shown in Fig. 6(b), the trapezoidal and sinusoidal grooves show similar levels of ohmic losses, with the triangular shape resulting in the largest increase of attenuation.
5 Fabrication of Helically-Tapped Transmission Line Components
As the frequency of the waves on the transmission line moves further into the THz regime, fabrication of individual corrugations becomes more difficult and expensive, requiring special tools and dedicated setups [18], but could be performed with relative ease using a helical tap. However, the groove shape in a helically-tapped waveguide does not produce the ideal rectangular groove shape and could result in increased ohmic losses. The simulations discussed in the previous section indicate that there are acceptable non-rectangular groove shapes which a helical tap is capable of tapping. To test this approach, a 4.5 m long transmission line optimized for operation at 330 GHz was constructed from fifteen 19 mm ID 30 cm long brass tubing sections tapped with an 80 grooves per inch (3.15/mm) tap. Brass was chosen as the waveguide material due to its hardness for fine machining and good conductivity. The tap thread before and after machining and the resulting corrugations were examined under magnification as shown in Fig. 7(a). The corrugations mirror the shape of the cutting thread looking approximately trapezoidal and with the cut groove narrower than the wall between. The depth of the cutting thread wore down about 10% over the course of fabrication. Images of the grooves indicate d = 0.227 mm, p = 0.318 mm and t = p/2. The trapezoidal groove shape in Fig. 7(a) corresponds to the trapezoidal groove shown in Fig. 6(a) and simulated in Fig. 6(b). Polarization rotation, which is a concern for helically-grooved waveguide, becomes less of an issue at higher frequencies because of the inverse frequency squared scaling. The rotation angle in radians can be estimated by
| (17) |
where L is the waveguide length[23]. For our waveguide parameters, the rotation is estimated as 0.1°/m at 330 GHz, which is not sufficient to cause a problem for DNP experiments.
Fig. 7.
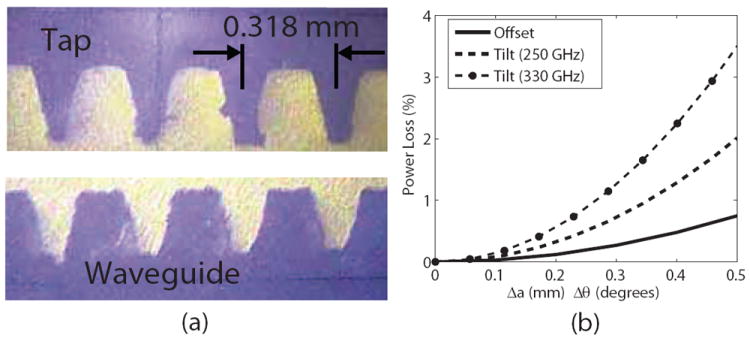
(a) Photos of the 330 GHz tap and waveguide cross sections. Chips from cutting are present on the second tap tooth from left. (b) Theoretical prediction of power loss due to axial offset (black line) and tilts (dashed and dashed/dotted lines) at waveguide junctions for the 19 mm diameter 330 GHz corrugated waveguide.
The theoretical prediction for offset and tilt losses calculated using (5) and (6) for a single joint of our transmission line is shown in Fig. 7(b). Errors in successive joints will increase the offset and tilt losses. Even with relatively large offsets (black line) a very modest power loss would be observed; however, the setup is extremely sensitive to tilts (dashed and dashed/dotted lines). To mitigate these effects, collars are placed at each waveguide joint which provide concentricity and angular alignment.
6 Straight Waveguide Measurements
The predicted loss in a straight section of waveguide is extremely low, limiting the possible experimental methods for measuring the loss. To aid in this process, measurements were taken using a vector network analyzer (VNA) around 250 GHz due to the availability in our laboratory of a high quality fundamental rectangular waveguide to 19 mm ID corrugated waveguide transition. The HE11 mode was obtained from the VNA WR-3 fundamental rectangular waveguide by a series of waveguide components consisting of a rectangular to circular transition, a smooth to corrugated waveguide transition, a corrugated conical horn, and an acrylic up taper to the 19 mm ID corrugated waveguide. In a previous measurement [56], the mode content produced by this setup was determined with great accuracy. The VNA (Agilent E8363B with millimeter-wave VNA extender V03VNA2-T/R) setup for transmission line losses and radiated field measurements is shown in Fig. 8(a) with the VNA extender head and up tapers in the lower left of the photo. At the other end of the waveguide there is an automated beam profile scanner. A schematic of this setup is shown in Fig. 8(b) with the scanner replaced by a removable short or load. A 2 m section of straight waveguide was used to bring the HE11 mode from the launcher to the scanner setup. The magnitude and phase of the radiated beam were recorded for spatial scans at 7, 10 and 13 cm distances from the waveguide aperture. Two methods, a phase retrieval code [57] and direct magnitude/phase measurements, showed that an HE11 mode purity of 94.2±0.3% was generated at 250 GHz. The detailed mode content of the microwave fields in the corrugated waveguide is listed in Table 2 with the decomposition performed using a linearly polarized basis set [46] where the LP01 mode is the linearly polarized HE11 mode. The large HE11 mode content allows the use of this setup to perform transmission loss measurements to test the quality of the transmission line and to make a comparison to the theoretical and numerical calculations from Section 3 and 4.
Fig. 8.
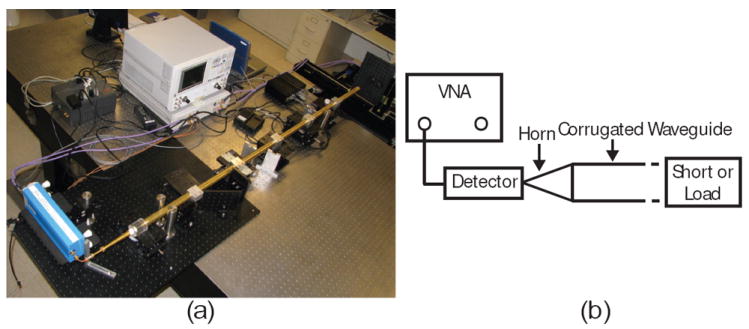
(a) VNA setup for 330 GHz waveguide transmission line loss measurements. (b) Schematic of the setup for transmission line losses with removable short or load.
Table 2.
Modes at the Aperture of the Corrugated Waveguide
| Power | Phase (radians) | ||||||
|---|---|---|---|---|---|---|---|
|
| |||||||
| LPmn | n = 1 | n = 2 | n = 3 | LPmn | n = 1 | n = 2 | n = 3 |
| m = 0 | 0.942 | 0.040 | 0.003 | m = 0 | -1.69 | -1.77 | 0.06 |
| m = 1 | 0.007 | <0.001 | <0.001 | m = 1 | 2.11 | - | - |
| m = 2 | 0.004 | <0.001 | <0.001 | m = 2 | 1.42 | - | - |
Validation of the theoretical calculation for the loss was accomplished with two methods to measure transmission losses. In the first method, a heterodyne radiometer and liquid nitrogen cooled blackbody (Eccosorb) were used to measure insertion losses relative to thermal noise over the band 248±4 GHz using techniques previously described [1]. The attenuation in the waveguide was determined by comparing the relative intensity of the receiver noise measurement with the addition of waveguide sections, up to a total of 3 m. In the second method, a VNA was used to perform calibrated S11 measurements to determine the ohmic loss in the system [58]. The S11 measurements entailed short and matched load (radiation into free space) measurements for every added section of the overmoded waveguide. Reflection measurements are preferable to transmission for measuring very small losses over a distance of several meters because the measurement setup for the detector can remain immobile while sections of waveguide are added. This removes a significant source of error introduced by flexing cables and making connections. Several challenges present themselves when performing S11 measurements in the overmoded waveguide including Fabry-Pérot resonances caused by small mismatches and mode beating. Fabry-Pérot effects were removed by taking measurements over the 240 - 260 GHz range and filtering the oscillations on the measured signal. The treatment for mode beating, if the HE11 mode is dominant, can be generalized to express the relationship between the detected power and the relative phase of various higher order modes with respect to the HE11 mode. With 94.2% of the power in the HE11 mode, the beating can be described by
| (18) |
where PD is the detected power, Amn is the amplitude given in Table 2, αmn is the attenuation constant and HOM designates the higher order mode index that is being considered. The relative phase, ϕHOM = 2L (k01z − kHOMz), between the modes is determined by the phase of the reconstructed mode content, shown in Table 2, back propagated to the measurement plane for the straight waveguide measurements. The measured and calculated PD for the system is shown in Fig. 9. The calculated PD is based on the power and phase in the 5 lowest higher order modes, with the attenuation in the waveguide as the only free variable, and is determined from the best fit between the measured and calculated transmitted power.
Fig. 9.
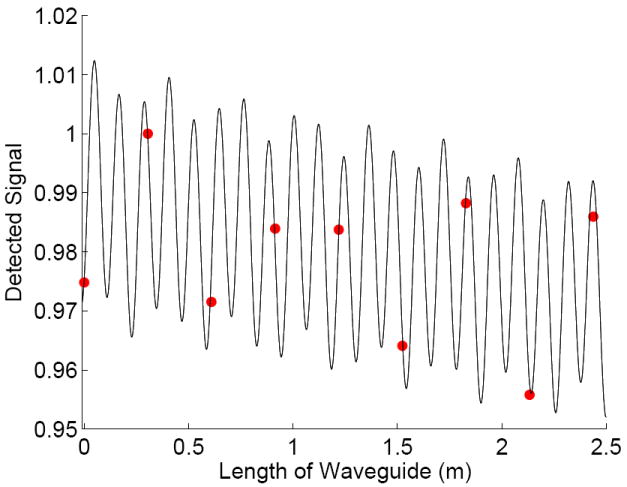
Predicted (black line) and measured (red dot) signal from the VNA as a function of waveguide length.
The transmission as a function of length for the straight waveguide measurements, which is computed from the S11 measurements [6,58], is shown in Fig. 10(a). Measurements in Fig. 10(a) were independently repeated 5 times, with the mean of the measurements shown with black dots and one standard deviation is marked with error bars for each added section of waveguide. The attenuation, α, is determined by a best fit for e−αz. The measured insertion losses, plotted in Fig. 10(b), are 0.047±0.01 and 0.029±0.009 dB/m for the radiometer and VNA, respectively. The measurements are in reasonable agreement with one another and with the theoretical estimate. The difference between the VNA measurement and HFSS model can be explained by adjusting the bulk resistivity by a factor of 2 (or for the surface resistance). The resulting losses of ~3% for the complete 4.5 m straight waveguide length are acceptable for the intended application. Consequently, using a tap to save fabrication costs of corrugated waveguide does not cause the quality of the waveguide to suffer, with deeper groove depth compensating for non-ideal rectangular shape.
Fig. 10.
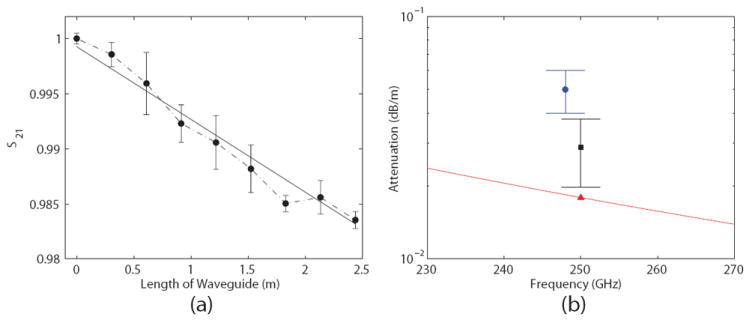
(a) Measured transmission through 19 mm ID corrugated waveguide at 250 GHz as a function of waveguide length. (b) HE11 waveguide transmission loss measurements (blue dot: radiometer, black square: vector network analyzer) and HFSS model (red triangle and line: trapezoidal groove) for ideal brass conductivity and a = 9.5 mm.
7 Discussion and Conclusions
The transmission of THz radiation over significant distances has proven to be a challenge for systems requiring high efficiencies. Additional problems have surfaced when considering high-power THz radiation where ohmic losses or mode conversion can lead to physical damage to the transmission line or load. Overmoded corrugated waveguides have proved to be a reliable technique with regards to their low-loss nature and ability to handle high-powers. Corrugated waveguides routinely achieve losses below 0.01 dB/m for the lowest order HE11 mode. However, their overmoded nature requires precise excitation and very accurate physical alignment of the transmission line to avoid severe mode conversion which leads to increased ohmic losses and a poorer beam quality output. Additionally, corrugated waveguides do have a large, but limited bandwidth due to the frequency-dependent nature of the corrugations. Frequencies far below the optimized condition of d ≈ λ/4 experience increased ohmic losses and the HE11 mode is no longer linearly polarized. Bragg reflections occur for higher frequencies when d ≈ nλ/2, where n = 1, 2, 3… is an integer. At frequencies well above 1 THz overmoded corrugated waveguides remain an unproven technology. However, with a minimum reported loss of 1 dB/m alternate forms of transmission lines above 1 THz, have not achieved comparable low-losses. With improved machining and the availability of free space Gaussian beams, overmoded corrugated waveguides could extend into this regime. Corrugated waveguides that require individual machining of grooves are costly and complex when frequencies approach the THz range. However, helically-tapped waveguides are much simpler to fabricate and have corrugations that are very effective in low-loss transmission. Typical designs for overmoded corrugated waveguides operate with similar corrugation dimensions with d ≈ λ/4, p ≈ λ/3 and t ≈ p/2. We can write (10) as
| (19) |
where we took and COM is a constant, shown in Table 3 for a variety of metals, scaled from the measurements on the brass corrugated waveguide presented in this paper.
Table 3.
Normalized Attenuation Coefficient for Metallic Corrugated Waveguide
| COM (NP · m0.5) | COM (dB · m0.5) | |
|---|---|---|
| Brass | 3.94×10⁻⁵ | 3.42×10⁻⁴ |
| Al | 3.11×10⁻⁵ | 2.70×10⁻⁴ |
| Copper | 2.03×10⁻⁵ | 1.76×10⁻⁴ |
From this expression it is evident that these waveguides become more favorable at higher frequencies as the wavelength gets shorter. With their behavior being extremely dependent on the waveguide radius, it is also possible to drastically improve performance for long transmission lines with larger diameter waveguide. Additionally, this expression provides a realistic expectation for the HE11 mode loss on a transmission line. We should also note that for both the TE10 mode in rectangular waveguide and TE11 mode in circular waveguide the attenuation has a starkly different dependence, α ∝ λ−0.5 /a, where a is the long dimension in rectangular waveguide and the radius in circular waveguide. As frequencies push into the THz regime, these modes require prohibitively large cross sections for many applications to maintain a reasonable attenuation coefficient. An alternative is to use the TE01 mode in smooth-walled circular waveguides which has a similar dependence to the HE11 mode, but this mode is difficult to couple to free space Gaussian beams.
Transmission of THz radiation is a growing area of research due to the increasing availability of THz sources capable of producing a megawatt of average power in the near-THz and 10-100 W in the THz band. The ohmic losses in corrugated waveguides are well understood, with good agreement between theory, simulation and experiments. High quality Gaussian beams that couple efficiently to the HE11 mode of the corrugated waveguide are a requirement for low-loss operation. The higher order mode content of the transmission line can produce increased ohmic losses on straight waveguide sections and reduced performance of components such as miter bends and tapers. Overmoded corrugated transmission lines with high average powers have been successfully implemented on plasma fusion experiments and DNP NMR experiments up to 0.46 THz, and this study shows that they will continue to be of value at higher frequencies.
Acknowledgments
This work is supported by the NIH and NIBIB under the Contracts R01-EB004866 and R01-EB001965 and by the US ITER Project managed by Battelle / Oak Ridge National Laboratory.
References
- 1.Woskov PP, Bajaj VS, Hornstein MK, Temkin RJ, Griffin RG. Microwave Theory and Techniques. IEEE Transactions on. 2005;53(6):1863. doi: 10.1109/TMTT.2005.848097. [DOI] [PMC free article] [PubMed] [Google Scholar]
- 2.Woskov PP, Hornstein MK, Temkin RJ. Infrared and Millimeter Waves and 13th International Conference on Terahertz Electronics, The Joint 30th International Conference on; 2005. pp. 563–564. [Google Scholar]
- 3.de Rijk E, Macor A, Hogge JP, Alberti S, Ansermet JP. Rev Sci Instrum. 2011;82(6):066102. doi: 10.1063/1.3597579. [DOI] [PubMed] [Google Scholar]
- 4.Denisov G, Chirkov A, Belousov V, Bogdashov A, Kalynova G, Sobolev D, Rodin Y, Tai E, Ilin V, Kornishin S, Kulygin M, Malygin V, Soluyanova E, Parshin V, Shmelev M. Journal of Infrared, Millimeter and Terahertz Waves. 2011;32(3):343. [Google Scholar]
- 5.Bogdashov A, Belousov V, Chirkov A, Denisov G, Korchagin V, Kornishin S, Tai E. Journal of Infrared, Millimeter and Terahertz Waves. 2011;32(6):823. [Google Scholar]
- 6.Woskov P, Nanni E, Shapiro M, Jawla S, Hummelt J, Temkin R, Barnes A. Infrared Millimeter and Terahertz Waves (IRMMW-THz), 36th International Conference on; 2011. [Google Scholar]
- 7.Denysenkov VP, Prandolini MJ, Krahn A, Gafurov M, Endeward B, Prisner TF. Applied Magnetic Resonance. 2008;34(3):289. [Google Scholar]
- 8.Idehara T, Kosuga K, Agusu L, Ikeda R, Ogawa I, Saito T, Matsuki Y, Ueda K, Fujiwara T. Journal of Infrared, Millimeter and Terahertz Waves. 2010;31(7):775. [Google Scholar]
- 9.Thurber KR, Yau WM, Tycko R. J Mag Res. 2010;204(2):303. doi: 10.1016/j.jmr.2010.03.016. [DOI] [PMC free article] [PubMed] [Google Scholar]
- 10.Armstrong BD, Edwards DT, Wylde RJ, Walker SA, Han S. Physical Chemistry Chemical Physics. 2010;12(22):5920. doi: 10.1039/c002290j. [DOI] [PubMed] [Google Scholar]
- 11.Cruickshank PAS, Bolton DR, Robertson DA, Hunter RI, Wylde RJ, Smith GM. Rev Sci Instrum. 2009;80(10):103102. doi: 10.1063/1.3239402. [DOI] [PubMed] [Google Scholar]
- 12.Ohkubo K, Kubo S, Idei H, Sato M, Shimozuma T, Takita Y. International Journal of Infrared and Millimeter Waves. 1997;18(1):23. [Google Scholar]
- 13.Bhartia P, Bahl I. Millimeter Wave Engineering and Applications. John Wiley and Sons, Inc.; New York, NY: 1984. [Google Scholar]
- 14.Thumm MK, Kasparek W. Plasma Science. IEEE Transactions on. 2002;30(3):755. [Google Scholar]
- 15.Callis RW, Cary WP, Ellis R, Gorelov YA, Grunloh HJ, Lohr J, Peavy JJ, Pinsker RI, Ponce D, Prater R. Plasma Science, The 29th IEEE International Conference on; 2002. p. 294. [Google Scholar]
- 16.Leuterer F, Beckmann M, Brinkschulte H, Monaco F, Mnich M, Ryter F, Schtz H, Empacher L, Gantenbein G, Frster W, Kasparek W, Schller P, Schwrer K, Borchegowski A, Fix A, Illin V, Popov L, Sigalaev V, Tai E. Fusion Engineering and Design. 2001;53(1-4):485. [Google Scholar]
- 17.Idei H, Kubo S, Shimozuma T, Sato M, Ohkubo K, Yoshimura Y, Takita Y, Kobayashi S, Ito S, Mizuno Y, Tsumori K, Ikeda K, Notake T, Watari T, Kaneko O, Komori A, Yamada H, de Vries PC, Goto M, Ida K, Inagaki S, Kado S, Kawahata K, Kobuchi T, Minami T, Miyazawa J, Morisaki T, Morita S, Murakami S, Muto S, Nagayama Y, Nakanishi H, Narihara K, Peterson BJ, Sakakibara S, Sasao H, Sato K, Tanaka K, Takeiri Y, Watanabe KY, Yamada I, Motojima O, Fujiwara M. Fusion Engineering and Design. 2001;53(1-4):329. [Google Scholar]
- 18.Doane JL. Fusion Science and Technology. 2008;53:159. [Google Scholar]
- 19.Doane JL, Olstad RA. Fusion Science and Technology. 2008;53(1):39. [Google Scholar]
- 20.Gandini F, et al. Fusion Science and Technology. 2011;59(4):709. [Google Scholar]
- 21.Choi E, Shapiro M, Sirigiri J, Temkin R. Journal of Infrared, Millimeter and Terahertz Waves. 2009;30(1):8. [Google Scholar]
- 22.Dragone C. Microwave Theory and Techniques. IEEE Transactions on. 1980;28(7):704. [Google Scholar]
- 23.Doane JL. Infrared and millimeter waves. Vol. 13 Orlando, FL: Academic Press, Inc.; [Google Scholar]
- 24.Mitrofanov O, James R, Fernandez FA, Mavrogordatos TK, Harrington JA. Terahertz Science and Technology. IEEE Transactions on. 2011;1(1):124. [Google Scholar]
- 25.Gallot G, Jamison SP, McGowan RW, Grischkowsky D. J Opt Soc Am B. 2000;17(5):851. [Google Scholar]
- 26.Mitrofanov O, Harrington JA. Opt Express. 2010;18(3):1898. doi: 10.1364/OE.18.001898. [DOI] [PubMed] [Google Scholar]
- 27.Mendis R, Grischkowsky D. J Appl Phys. 2000;88:4449. [Google Scholar]
- 28.Chen LJ, Chen HW, Kao TF, Lu JY, Sun CK. Opt Lett. 2006;31(3):308. doi: 10.1364/ol.31.000308. [DOI] [PubMed] [Google Scholar]
- 29.Wang K, Mittleman DM. Nature. 2004;432(7015):376. doi: 10.1038/nature03040. [DOI] [PubMed] [Google Scholar]
- 30.Mendis R, Mittleman DM. J Opt Soc Am B. 2009;26(9):A6. [Google Scholar]
- 31.Hassani A, Dupuis A, Skorobogatiy M. Opt Express. 2008;16(9):6340. doi: 10.1364/oe.16.006340. [DOI] [PubMed] [Google Scholar]
- 32.Goto M, Quema A, Takahashi H, Ono S, Sarakura N. Japanese Journal of Applied Physics. 2004;43(2B):317. [Google Scholar]
- 33.Bowden B, Harrington JA, Mitrofanov O. Applied Physics Letters. 2008;93(18):181104. [Google Scholar]
- 34.Oosterbeek J, Brger A, Westerhof E, Baar dM, Berg vdM, Bongers W, Graswinckel M, Hennen B, Kruijt O, Thoen D, Heidinger R, Korsholm S, Leipold F, Nielsen S. Rev Sci Instrum. 2008;79(9):093503. doi: 10.1063/1.2976665. [DOI] [PubMed] [Google Scholar]
- 35.Bongers WA, et al. Fusion Science and Technology. 2009;55(2):188. [Google Scholar]
- 36.Henderson M, et al. Nuclear Fusion. 2008;48(5):054013. [Google Scholar]
- 37.Rowan W, Austin M, Beno J, Ellis R, Feder R, Ouroua A, Patel A, Phillips P. Rev Sci Instrum. 2010;81(10):10D935. doi: 10.1063/1.3496978. [DOI] [PubMed] [Google Scholar]
- 38.Austin M, et al. Proceedings of the Fifteenth Joint Workshop on Electron Cyclotron Emission and Electron Cyclotron Resonance Heating. Yosemite National Park; California, USA: 2009. pp. 170–177. [Google Scholar]
- 39.Hanson GR, Wilgen JB, Bigelow TS, Diem SJ, Biewer TM. Rev Sci Instrum. 2010;81:10D920. doi: 10.1063/1.3485086. [DOI] [PubMed] [Google Scholar]
- 40.Nanni EA, Barnes AB, Griffin RG, Temkin RJ. Terahertz Science and Technology. IEEE Transactions on. 2011;1(1):145. doi: 10.1109/TTHZ.2011.2159546. [DOI] [PMC free article] [PubMed] [Google Scholar]
- 41.Hornstein MK, Bajaj VS, Griffin RG, Kreischer KE, Mastovsky I, Shapiro MA, Sirigiri JR, Temkin RJ. Electron Devices. IEEE Transactions on. 2005;52(5):798. [Google Scholar]
- 42.Bajaj V, Farrar C, Hornstein M, Mastovsky I, Vieregg J, Bryant J, Elena B, Kreischer K, Temkin R, Griffin R. J Mag Res. 2003;160:85. doi: 10.1016/s1090-7807(02)00192-1. [DOI] [PMC free article] [PubMed] [Google Scholar]
- 43.Torrezan AC, Shapiro MA, Sirigiri JR, Temkin RJ, Griffin RG. Electron Devices. IEEE Transactions on. 2011;58(8):2777. [PMC free article] [PubMed] [Google Scholar]
- 44.Rosay M, Tometich L, Pawsey S, Bader R, Schauwecker R, Blank M, Borchard PM, Cauffman SR, Felch KL, Weber RT, Temkin RJ, Griffin RG, Maas WE. Physical Chemistry Chemical Physics. 2010;12(22):5850. doi: 10.1039/c003685b. [DOI] [PMC free article] [PubMed] [Google Scholar]
- 45.Ogawa I, Idehara T, Pereyaslavets M, Kasparek W. International Journal of Infrared and Millimeter Waves. 1999;20(4):543. [Google Scholar]
- 46.Kowalski EJ, Tax DS, Shapiro MA, Sirigiri JR, Temkin RJ, Bigelow TS, Rasmussen DA. Microwave Theory and Techniques. IEEE Transactions on. 2010;58(11):2772. [Google Scholar]
- 47.Doane JL, Moeller CP. International Journal of Electronics. 1994;77(4):489. [Google Scholar]
- 48.Nanni EA, Barnes AB, Matsuki Y, Woskov PP, Corzilius B, Griffin RG, Temkin RJ. J Mag Res. 2011;210(1):16. doi: 10.1016/j.jmr.2011.02.001. [DOI] [PMC free article] [PubMed] [Google Scholar]
- 49.Ogawa I, Idehara T, Myodo M, Ando H, Wagner D, Thumm M. Infrared Millimeter Waves and 14th International Conference on Terahertz Electronics, Joint 31st International Conference on; 2006. pp. 552–552. [Google Scholar]
- 50.Matsuki Y, Takahashi H, Ueda K, Idehara T, Ogawa I, Toda M, Akutsu H, Fujiwara T. Physical Chemistry Chemical Physics. 2010;12(22):5799. doi: 10.1039/c002268c. [DOI] [PubMed] [Google Scholar]
- 51.Temkin RJ, Barnes AB, Griffin RG, Jawla S, Nanni E, Torrezan AC. Third International Symposium on Dynamic Nuclear Polarization. 2011 [Google Scholar]
- 52.Temkin R, Barnes A, Griffin R, Jawla S, Mastovsky I, Nanni E, Shapiro M, Torrezan A, Woskov P. Infrared Millimeter and Terahertz Waves (IRMMW-THz), 36th International Conference on; 2011. [Google Scholar]
- 53.Clarricoats PJB, Olver AD. IEEE Electromagnetic Waves Series. London, U.K: Peter Peregrinus; 1984. Corrugated horns for microwave antennas. [Google Scholar]
- 54.Clarricoats PJB, Olver AD, Chon SL. Institution of Electrical Engineers, Proceedings. 1975;122(11):1173. [Google Scholar]
- 55.Plaum B, Holzhauer E, Lechte C. Journal of Infrared, Millimeter and Terahertz Waves. 2011:1–14. [Google Scholar]
- 56.Jawla SK, Nanni EA, Shapiro MA, Woskov PP, Temkin RJ. Submitted to IEEE Transactions on Plasma Science Special Issue. doi: 10.1109/TPS.2012.2190105. [DOI] [PMC free article] [PubMed] [Google Scholar]
- 57.Jawla S, Hogge JP, Alberti S, Goodman T, Piosczyk B, Rzesnicki T. Plasma Science. IEEE Transactions on. 2009;37(3):414. [Google Scholar]
- 58.Kowalski EJ, Nanni EA, Shapiro MA, Sirigiri JR, Temkin RJ, Bigelow TS, Rasmussen DA. Vacuum Electronics Conference (IVEC), IEEE International; 2010. pp. 335–336. [DOI] [PMC free article] [PubMed] [Google Scholar]