

Abstract
The selective oxyfunctionalization of isolated sp3 C–H bonds in complex molecules represents a formidable challenge in organic chemistry. Here, we describe a rational, systematic strategy to expedite the development of P450 oxidation catalysts with refined regio- and stereoselectivity for the hydroxylation of remote, unactivated C–H sites in a complex scaffold. Using artemisinin as model substrate, we demonstrate how a three-tier strategy involving first-sphere active site mutagenesis, high-throughput P450 fingerprinting, and fingerprint-driven P450 reactivity predictions enabled the rapid evolution of three efficient biocatalysts for the selective hydroxylation of a primary and a secondary C–H site (with both S and R stereoselectivity) in a relevant yet previously inaccessible region of this complex natural product. The evolved P450 variants could be applied to provide direct access to the desired hydroxylated derivatives at preparative scales (0.4 g) and in high isolated yields (>90%), thereby enabling further elaboration of this molecule. As an example, enantiopure C7-fluorinated derivatives of the clinical antimalarial drugs artesunate and artemether, in which a major metabolically sensitive site is protected by means of a C–H to C–F substitution, were afforded via P450-mediated chemoenzymatic synthesis.
Introduction
The selective oxyfunctionalization of remote, unactivated sp3 C–H bonds in complex molecules represents a most useful but also one of the most challenging transformations in organic chemistry.1,2 Over the past two decades, notable advances in the area of chemical C–H oxidation involving the use of oxidizing reagents,3 biomimetic supramolecular complexes,4 or transition metal catalysts5,6 have disclosed opportunities to afford the oxidation of electronically activated C–H bonds in organic molecules, typically tertiary and/or heteroatom-bearing C–H bonds, with a high degree of selectivity. In some instances, less activated aliphatic C–H sites could be targeted for oxidation by taking advantage of proximal “directing” groups pre-existing or preinstalled in the target compound.7 Despite this progress, the vast majority of C–H bonds in molecules of high complexity, in particular isolated, (stereo)electronically unbiased C–H bonds, remain inaccessible via currently available chemical tools.1
The use of cytochrome P450 enzymes constitutes an attractive alternative strategy toward the oxyfunctionalization of unactivated C–H bonds in organic molecules.8 These biological catalysts can provide a valuable complement to chemical oxidation strategies as their site-selectivity could be, in principle, steered toward a remote C–H site in a given compound by influencing their molecular recognition properties via protein engineering.9,10 In practice, however, fine-tuning the regio- and stereoselectivity of P450s toward a predefined position in a non-native substrate of interest has represented a fundamental problem.11−14 Various factors contribute to complicate these efforts including, among others, the difficulties inherent to controlling the site-selectivity of the P450-catalyzed oxidation reaction via rational design, the notoriously rare occurrence of variants with the desired selectivity properties within engineered P450 libraries, and the requirement for laborious and time-consuming analyses (i.e., via HPLC or GC) for regio/stereoselectivity determination.9 As a result, this goal has been historically met with only limited or partial success also when ingenious ad hoc high-throughput assays reporting on the P450 regio- or stereoselectivity on a given substrate had been applied.12,13 Alternatively, considerable screening efforts need to be invested for any single substrate, as exemplified by a recent study focused on improving the regioselectivity of a testosterone-hydroxylating P450 (50% → 94%), an effort that required the analysis of several thousand engineered variants (>9,000) by HPLC.14 Clearly, more general (i.e., substrate-independent) and streamlined strategies to gain access to P450 catalysts with refined regio- and stereoselectivity are needed in order to make P450 catalysis accessible for chemical synthesis.9
Artemisinin (1, ART; Figure 1a), a naturally occurring sesquiterpene lactone of prominent value in the pharmacological treatment of human malaria,15 exemplifies the scope and limitations of currently available tools for late-stage functionalization of a complex molecule. Over the past two decades, extensive synthetic efforts directed at elaborating this molecule in search for improved antimalarial agents have been largely confined to the lactone ring, and primarily C10 and C9, which can be readily accessed through chemical methods.16,17 Whereas substitutions at C10 have yielded derivatives of clinical relevance such as artesunate, artemether, and artemisone (Figure 1a),16−18 methods to functionalize sp3 C–H sites in the upper hemisphere of the molecule, and in particular positions C7 and C6a, would be highly desirable, as these positions constitute major target sites during phase I metabolism of this molecule in humans, a process that contributes to the rapid clearance and undesirably short in vivo half-life of artemisinin-based antimalarials.16,18,19 These sites have also remained inaccessible to chemical oxidation via iron-based catalysts, which have preference toward the more (stereo)electronically activated tertiary C–H bond in C6.6 On the other hand, attempts to hydroxylate artemisinin by means of oxidizing microbial strains have resulted in mixtures of multiple (over)oxidation products and/or a large extent of ART deoxygenation to give deoxoartemisinin, which lacks the endoperoxide bridge essential for biological activity.20
Figure 1.
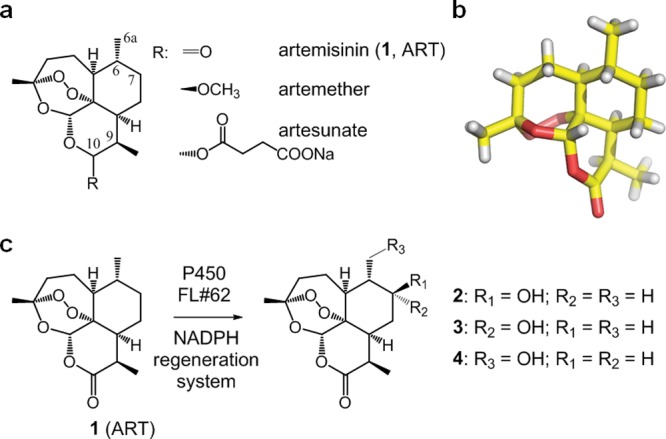
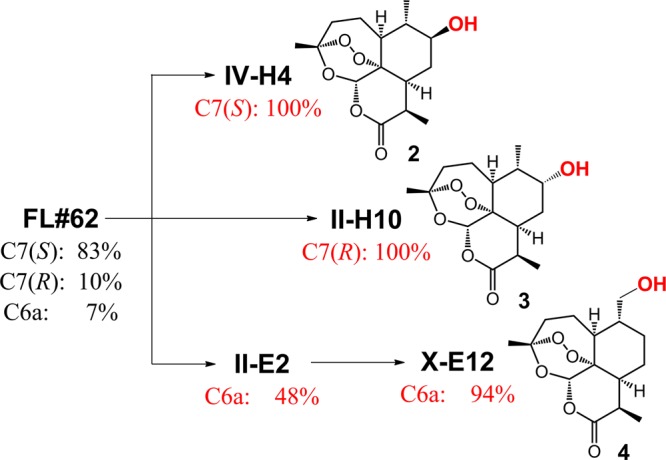
(a) Chemical structure of artemisinin (1, ART) and artemisinin-based antimalarial drugs. (b) Crystal structure of artemisinin.31 (c) Hydroxylation of artemisinin with P450BM3 variant FL#62. Product distribution: 83% 2; 10% 3; 7% 4.
Using artemisinin as a model substrate, we developed and report here an efficient, new strategy for developing highly regio- and stereoselective P450 catalysts for the oxyfunctionalization of a set of predefined, isolated C–H bonds in a complex molecule. The described approach hinges upon three key elements, namely (1) the generation of P450 catalyst diversity via mutagenesis of first-sphere active site residues in a parent P450; (2) mapping of the active site configurations of the resulting P450 variants via high-throughput “fingerprinting”21 to rapidly identify the library members with potentially unique regio/stereoselectivity features; and (3) prioritization of these variants via a general method of fingerprint-based prediction of P450 reactivity toward the target substrate (i.e., artemisinin). We demonstrate how this rationally driven, systematic strategy enabled the rapid optimization of an unselective artemisinin-hydroxylating P450 variant (Figure 1c) into a set of P450 oxidation catalysts with highly refined regio- and stereoselectivity for the hydroxylation of each of the three unactivated sp3 C–H bonds in positions C7 and C6a of artemisinin. Importantly, the entire procedure required the empirical testing of only a handful of P450 variants via conventional HPLC-based analyses and yielded a set of synthetically useful P450 catalysts for the selective, late-stage oxyfunctionalization of a relevant yet previously inaccessible region of artemisinin scaffold at both preparative scales and in high yields.
Results and Discussion
Unselective Artemisinin Hydroxylation by a Substrate-Promiscuous P450BM3 Variant
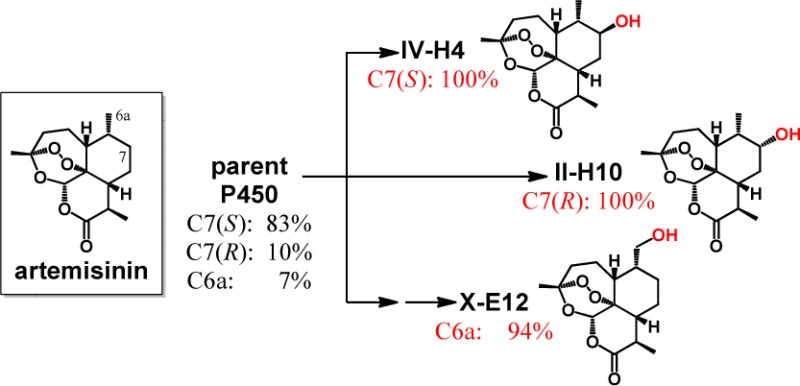
The starting point of this work was FL#62,21 an engineered variant of the catalytically self-sufficient fatty acid monooxygenase P450BM3 from Bacillus megaterium.22 In previous studies,21 FL#62 was found to exhibit a broad substrate profile that comprises large decaline- and steroid-based compounds. Accordingly, we envisioned this variant could also accept the bulky tricyclic terpene artemisinin (Figure 1b) as a substrate for oxidation. Upon testing, FL#62 was indeed found to be capable of hydroxylating ART with high activity, i.e., supporting about 340 total turnovers (TTN) in the presence of a NADPH cofactor regeneration system. In comparison, wild-type P450BM3 showed no ART-oxidation activity. The site-selectivity of FL#62 was poor, however, producing a mixture of 7(S)-hydroxy-ART (2), 7(R)-hydroxy-ART (3), and 6a-hydroxy-ART (4) in a 83:10:7 ratio (Figure 1c). This notwithstanding, the aliphatic C–H bonds targeted by this enzyme resided in the relevant, upper hemisphere of the ART scaffold, overlapping in two cases (3, 4) with those targeted by human liver P450s, making FL#62 a promising starting point toward evolving selective P450 catalysts for the oxidative activation of each of these sites.
Generation of P450 Library via First-Sphere Active Site Mutagenesis (Tier 1)
To this end, our first step involved altering the FL#62 active site via mutagenesis. In P450BM3, more than a dozen amino acids extend their side chains into the heme cavity and the long hydrophobic substrate channel connecting the latter to the protein surface.23,24 Among these, mutation of those that are most proximal to the heme (referred to here as “first-sphere” residues) was expected to have the largest impact on the orientation of the enzyme-bound artemisinin above the reactive iron center and, thus, on the regio- and stereoselectivity of FL#62. Accordingly, a series of active site libraries were constructed via site-saturation mutagenesis (NNK) of first-sphere residues 74, 78, 81, 82, 87, 181, and 184, which lie within 12 Å from the heme iron and within 5 Å from the terminal carbons of N-palmitoylglycine in the substrate-bound structure of P450BM3 heme domain24 (Figure 2). First-sphere residues along the I helix (e.g., A264, T268) were not taken into consideration because of their structural role25 or involvement in catalysis,26 while A328 was excluded because most substitutions at this site would likely disfavor access of the bulky terpene to the heme. Overall, the size of the resulting libraries included more than 105 members, many of which, in all likelihood, would be misfolded or functionally redundant as a result of deleterious or neutral mutations, respectively.
Figure 2.
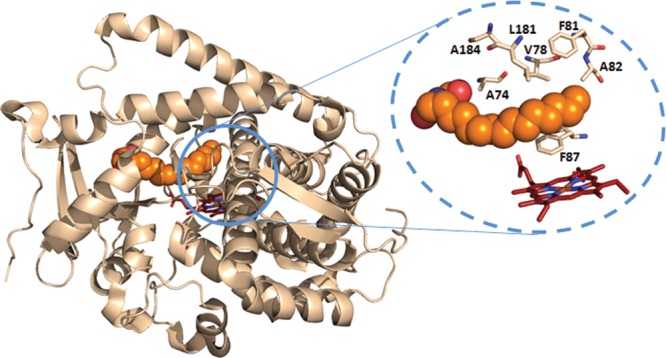
Crystal structure of P450BM3 (heme domain) in complex with N-palmitoylglycine (PDB code 1JPZ(24)). The bound substrate is displayed as sphere models (orange), and the heme is displayed as stick model (red). The dotted circle highlights the first-sphere active site residues targeted for mutagenesis in this study.
Identification of Functionally Diverse Variants via P450 Fingerprinting (Tier 2)
To rapidly identify the most relevant fraction of these libraries, namely, the variants that not only are functional but also have the highest probability to exhibit altered regio- and stereoselectivity in ART oxidation, we utilized our recently reported method for high-throughput P450 fingerprinting.21 This method provides a means to quickly map the active site geometry of these enzymes via a set of structurally diverse and conformationally rigid chromogenic probes (compounds P1–P5, Figure S1 in the Supporting Information). Accordingly, a total of 12,500 recombinants from the mutagenesis libraries were fingerprinted in 96-well plates using probes P1–P5 and a Purpald-based colorimetric assay for quantification of probe activity (Figure 3a). The acquired fingerprints were then compared against each other in order to identify the P450 variants with a unique profile, this feature indicating that the corresponding enzyme possesses a unique active site configuration.21 Using this approach, about 1,950 out of the 12,500 screened variants were determined to be catalytically competent (criterion: >10% of parent enzyme activity on at least one of the fingerprint probes). Among these, 522 variants were established to be functionally unique (criterion: larger than 20% variation on at least one of the five fingerprint components compared to the parent enzyme and any other member of the library) and thus worthy of further consideration. Notably, this fraction represented only the 4.1% of the original library, highlighting the efficiency of this tier-2 procedure in drastically reducing the number of candidate enzymes to consider in the subsequent steps.
Figure 3.
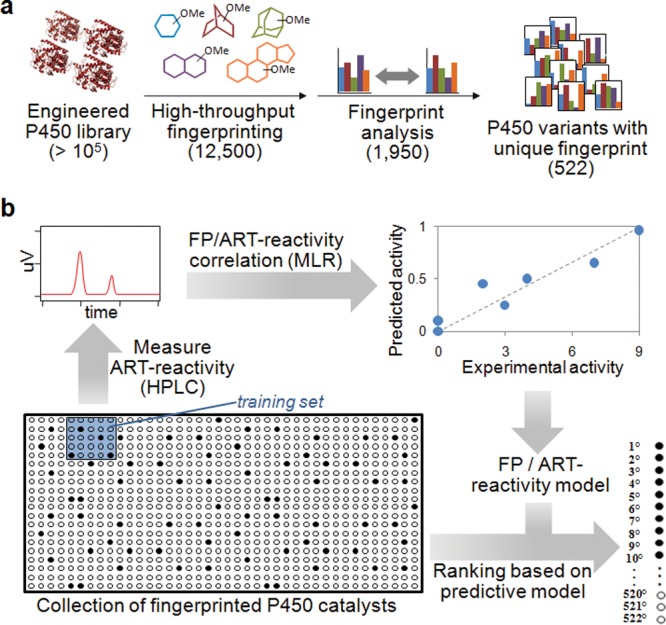
Fingerprint-based strategy to guide the discovery of regio- and stereoselective artemisinin-hydroxylating P450 catalysts. (a) Schematic summary of the process of identification of the functionally diverse P450 variants from the active site libraries via high-throughput fingerprinting followed by fingerprint comparative analysis (tier 2). (c) Outline of the method applied to predict ART reactivity via multivariate fingerprint analysis (tier 3). FP: fingerprint. MLR: multiple linear regression.
Artemisinin Reactivity Prediction via Multivariate Fingerprint Analysis (Tier 3)
At this point, we sought to develop a tool to further guide our search for ART-hydroxylating variants within this collection of 522 functionally diverse P450 catalysts. Since ART shares little or no structural similarity with any of the fingerprint probes, a P450 reactivity prediction approach alternative to the one previously implemented in the context of probe-related substrates21 was required. To this end, we envisioned that a more general strategy based on fingerprint multivariate analysis could prove useful in the context of a probe-unrelated target substrate like ART. As outlined in Figure 3b, this method relies on generating a fingerprint-based model predictive of ART reactivity by correlating P450 fingerprints with experimental ART oxidation activities across a small subset (“training set”) of the enzyme collection. Since the fingerprints relay information on the P450 active site shape and geometry, this process translates into finding a fingerprint signature that defines an active site configuration compatible with ART binding and, thus, its oxidation. The model is then applied to rank the entire collection of fingerprinted P450s according to their predicted ART hydroxylation activity.
According to this design, a training set of 20 P450s was assembled using FL#62 and 19 randomly chosen variants from the 522-member P450 collection (training set A, Table S2 in the Supporting Information). The ART-hydroxylating activity for each of these enzymes was measured in TTN from small-scale reactions followed by derivatization of the ART hydroxylation products with benzoyl chloride and HPLC analysis. The derivatization procedure was implemented to enable sensitive and precise quantification of the reaction products as ART contains no strong chromophores. Out of the 19 variants, four exhibited ART hydroxylation activity, supporting up to about 110 total turnovers and showing varying regio- and stereoselectivity (Table S2 in the Supporting Information). These experiments also indicated that only a small fraction (∼20%) of this P450 catalyst collection would be expected to be active on ART.
To generate the fingerprint-based model predictive of ART reactivity, the experimental ART activities were then correlated with the fingerprints of the corresponding P450s across the whole training set via multiple linear regression analysis (MLR) (Figure 4a), which provides a statistical tool to analyze the correlation between a dependent variable y and multiple independent variables potentially correlated with y (equation: y = b0 + b1x1 + b2x2 + ... + bnxn). In the applied mathematical function, y corresponded to relative ART activity and the five fingerprint components were the five independent variables x1...x5. From the resulting best-fit regression coefficients, a fingerprint-based model was obtained, which was then applied to rank the remaining P450s in the collection according to their predicted ART reactivity (high-scoring = predicted ART active, low-scoring = predicted ART inactive) (Figure 4b).
Figure 4.

Fingerprint-based predictions of artemisinin reactivity. (a) Plot of experimental versus calculated ART activity from multiple linear regression analysis of ART reactivity/fingerprint correlation across P450 training set A (Table S1 in the Supporting Information). Root mean standard deviation (RMSD): 0.086. (b) Ranking of the 522 P450 variants according to their predicted artemisinin activity calculated based on the fingerprint-based model (training set A). (c) Total turnovers in ART hydroxylation for the 50 top-scoring P450 variants (solid box in panel b) arranged from the most to the least active variant. The parent enzyme is included for comparison.
Experimental Validation of the Fingerprint-Based Predictions
Guided by these predictions, we focused our attention on the 50 best-scoring P450 variants from the ranking list (Figure 4b, solid box), which were characterized for ART hydroxylation activity. Gratifyingly, we found that 78% (39/50) of these variants showed ART-hydroxylation activity at synthetically useful levels (>100 TTN; average = 323 TTN, Figure 4c). Furthermore, nearly half of the correctly identified variants (22/50) were found to possess higher ART-hydroxylating activity than the parent enzyme, with one (II-C3) supporting almost twice as many total turnovers (602 vs 339) (Figure 4c). Notably, the “hit” rate achieved using this method (78%) greatly exceeded that expected from random sampling of the collection (∼20%). In order to further assess the quality of these predictions, we then tested the twenty lowest-scoring variants from the ranking list (Figure 4b, dotted box), which were expected to have minimal or no activity on ART. 90% of these P450s (18/20) show no detectable oxidation activity on the compound, with the two active variants supporting only up to 130 TTN. The fraction of false negatives (10%) within this group was thus lower than the expected occurrence of ART-active P450s from random sampling (20%), further supporting the reliability of the predictions and functionality of the method to generate them.
Selective P450 Catalysts for C7 Hydroxylation with Absolute Regioselectivity and Stereocomplementarity
Since the P450 catalysts in the collection were preselected to possess unique active site geometries (Figure 3a), the 42 ART-reactive variants identified using the strategy described above were expected to exhibit markedly different regio- and stereoselectivity in ART oxidation, ideally displaying the sought-after high selectivity toward C7-, with both S and R stereoselectivity, and C6a-hydroxylation. Inspection of the product distribution of these variants confirmed our expectations (Table S3 in the Supporting Information). Importantly, as many as five variants (12% of the pool) were found to exhibit ≥95% selectivity for C7 hydroxylation with S-stereoselectivity. Among these, the triple mutant IV-H4 displayed the desired absolute regio- and stereoselectivity for this transformation, in addition to supporting higher TTN than the parent enzyme (Table 1). On the other hand, three variants showed much improved (>70%) selectivity for 7(R)-hydroxylation (Table S3 in the Supporting Information), which is produced in only 10% relative ratio with the parent enzyme. Among these, variant II-H10 displayed absolute regio- and R-stereoselectivity for hydroxylation of this site, thereby providing a second, exquisitely selective P450 catalyst for C7-oxyfunctionalization with complementary stereoselectivity compared to IV-H4 (Figure 5). Finally, P450 catalysts with improved 6a-hydroxylation activity were also captured through the strategy, with the best variant (II-E2) hydroxylating this position with considerably higher (48%), albeit still suboptimal, regioselectivity compared to FL#62 (7%) (Table S3 in the Supporting Information). The comparatively lower occurrence of 6a-hydroxylating P450s within these first-generation variants could be explained on the basis of the low level of 6a-hydroxylation activity in the parent enzyme combined with the higher strength of this primary C–H bond compared to the secondary ones in C7. Importantly, the improvement in 6a-selectivity in II-E2 was accompanied by an increase in catalytic activity (338 → 393 TTN, Table 1), making this variant a promising intermediate toward further refining 6a-selectivity via another round of directed evolution.
Table 1. Catalytic and Substrate Binding Properties of Most Representative ART-Hydroxylating P450BM3 Variantsa.
| amino
acid substitutionsb |
prod
distribution (%) |
. | ||||||||||||
|---|---|---|---|---|---|---|---|---|---|---|---|---|---|---|
| variant | 74 | 78 | 81 | 82 | 87 | 181 | 184 | 2 | 3 | 4 | TTN | KD (μM) | prod formation ratec | coupling efficd (%) |
| FL#62 | A | A | S | V | A | L | V | 83 | 10 | 7 | 339 ± 12 | 29 ± 5 | 316 ± 20 | 41.9 |
| IV-H4 | S | V | A | 100 | 0 | 0 | 362 ± 15 | 53 ± 11 | 100 ± 4 | 71.4 | ||||
| V-H2 | S | I | A | 96 | 0 | 4 | 434 ± 21 | 45 ± 10 | 41 ± 2 | 23.5 | ||||
| II-H10 | N | F | T | F | F | T | 0 | 100 | 0 | 270 ± 08 | 61 ± 2 | 32 ± 2 | 12.8 | |
| III-B1 | F | F | A | 19 | 81 | 0 | 403 ± 17 | 38 ± 2 | 72 ± 2 | 23.3 | ||||
| II-E2 | N | F | A | 22 | 30 | 48 | 393 ± 25 | 164 ± 18 | 148 ± 3 | 38.2 | ||||
| X-E12 | V | N | F | A | A | T | 4 | 2 | 94 | 113 ± 12 | 300 ± 24 | 72 ± 3 | 45.1 | |
| X-F11 | T | N | F | A | S | 0 | 8 | 92 | 376 ± 19 | 234 ± 29 | 56 ± 2 | 56.3 | ||
Mean values and standard deviations are calculated from triplicate experiments.
Mutations in FL#62 vs P450BM3 are V78A, F81S, A82 V, F87A, P142S, T175I, A180T, A184V, A197V, F205C, S226R, H236Q, E252G, R255S, A290V, L353V.
Moles of product per mole of P450 per minute. Rates are measured over initial 30 s.
Ratio between product formation rate and NADPH oxidation rate in the presence of artemisinin.
Figure 5.
Overview of the divergent evolution process leading to the selective ART-hydroxylating P450 variants.
Selective P450 Catalysts for C6a Hydroxylation
By sequencing, II-E2 was determined to carry three active site mutations (A78N/S81F/V82A), which left additional first-sphere positions available for mutagenesis (Figure 2). Accordingly, a triple site-saturation library (74/181/184) was constructed based on this enzyme, from which 3,000 recombinants were subjected to high-throughput fingerprinting followed by fingerprint comparative analysis according to the tier-2 procedure of Figure 3a. This step revealed the occurrence of just 50 unique-fingerprint P450s out of a total of 120 catalytically active variants (1.6% of the library). After expanding the training set to include II-E2 (= training set B), these 50 variants were scored based on their predicted ART reactivity according to the tier-3 method of Figure 3b as described above for the FL#62-derived variants (Figures S2 and S3 in the Supporting Information). Upon evaluation of the 25 top-scoring variants, we found that about half (52%) were capable of hydroxylating ART, supporting up to 474 TTN (average: 146 TTN) (Table S4 in the Supporting Information). On the other hand, 90% (9/10) of the predicted inactive ones (bottom-ranking) show no detectable activity on the compound. Furthermore, nearly two-thirds (8/13) of the correctly identified ART-active variants exhibited significantly improved 6a-selectivity (>80%) compared to II-E2 (Table S4 in the Supporting Information). Most importantly, this approach enabled the identification of two highly regioselective P450 catalysts for C6a hydroxylation, namely, X-E12 (94% selectivity) and X-F11 (92% selectivity), thereby completing our desired divergent evolution process (Figure 5). For X-E12, the improvement in 6a-selectivity was accompanied by a reduction in catalytic activity (113 vs 393 TTN in II-E2). In contrast, X-F11 was found to support nearly as many turnovers as II-E2 and higher TTN than the initial enzyme FL#62 (Table 1).
To determine whether potentially interesting catalysts could have been missed in this process, the remaining 15 variants from the 50-enzyme pool were also characterized. These studies revealed the occurrence of only two additional ART-oxidizing variants, none of which showed superior performance in terms of either regioselectivity or TTN compared to those already identified (Table S4 in the Supporting Information). Based on these results, we concluded that the method allowed efficient capturing, within the top one-fifth (10/50) and half (25/50) of the ranked variants, of 37% (6/16) and 81% (13/16), respectively, of the ART-active P450 catalysts in the pool, with the ten top-ranking P450s comprising those with the highest 6a-regioselectivity.
Kinetic, Substrate Binding, and Coupling Properties of the Evolved P450 Catalysts
Consistent with their divergent reactivity, the best variants for 7(S)-hydroxylation (IV-H4, V-H2), 7(R)-hydroxylation (II-H10, III-B1), and 6a-hydroxylation (X-E12, X-F11) show distinct fingerprints compared to each other, the parent FL#62, and the evolutionary intermediate II-E2 (Figure 6). These variants were further characterized to gain insights into the effect of the mutations on their catalytic and substrate binding properties. Interestingly, the selective 7(S)-hydroxylating variants were found to share a similar mutational pattern (Table 1), both carrying three active site mutations with two identical substitutions at position 78 and 82 and a similar “solution” (Val vs Ile) at the neighboring site 81 (Figure 2). In comparison, refinement of 7(R)- and C6a-selectivity required a more extensive remodeling of the enzyme active site as judged by the five to six mutations occurring in II-H10, X-E12, and X-F11 (Table 1). Overall, this trend well reflected the functional distance of these variants, in terms of site-selectivity, from the parent enzyme. II-H10 mutations were found to comprise a triad of phenylalanine substitutions within the heme pocket (S81F, A87F, L181F). Interestingly, III-B1, the second best (R)7-hydroxylating variant found in this study, also carries a pair of phenylalanine mutations in proximity of the heme. These common features suggest a distinctive requirement for bulky substitutions at the level of the heme pocket to favor ART hydroxylation at C7 with R stereoselectivity, when compared to IV-H4 and V-H2. Another interesting observation emerged from comparing the mutations in the 6a-hydroxylating variants with those of II-H10, which evidenced the importance of substitutions at positions 74 and 181 in steering the enzyme selectivity toward C6a.
Figure 6.
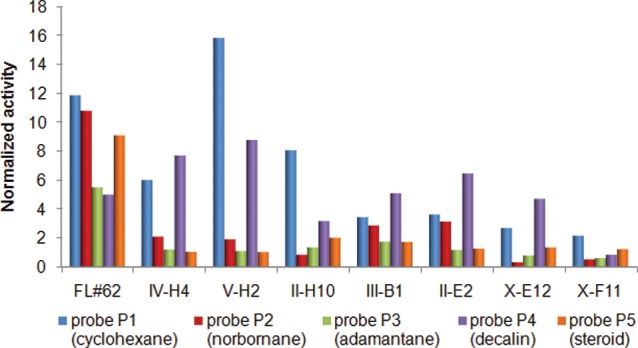
Fingerprints of FL#62 and FL#62-derived variants described in Table 1. Probe activities correspond to mean values from triplicate experiments (SE within 10%) after normalization to those of the reference enzyme P450BM3(F87A).
Upon incubation with ART, all the P450 variants were found to exhibit a 5 to 20% shift of the heme iron spin-state equilibrium (Figure 7 and Figure S4 in the Supporting Information), which is indicative of the ability of this substrate to displace the heme-bound water ligand upon complex formation. This property also enabled estimation of the binding affinity (KD) of these variants for ART via titration experiments. For all the P450 variants (Figure 7 and Figure S5 in the Supporting Information), hyperbolic curves were observed, suggesting a noncooperative binding interaction. Interestingly, the 7(S)- and the 7(R)-selective variants showed KD values similar to that of FL#62 (30–60 μM; Table 1), indicating that the acquired mutations had little impact on ART binding affinity compared to the parent enzyme. 5- to 10-fold higher KD values were observed instead for variants X-E12 and X-F11 as well as for II-E2, indicating that the mutations responsible for improving 6a-hydroxylation selectivity resulted in a somewhat weaker interaction with ART. These equilibrium dissociation constants fall however in the range of that observed for wild-type P450BM3 and the fatty acid laurate (270 μM).27
Figure 7.
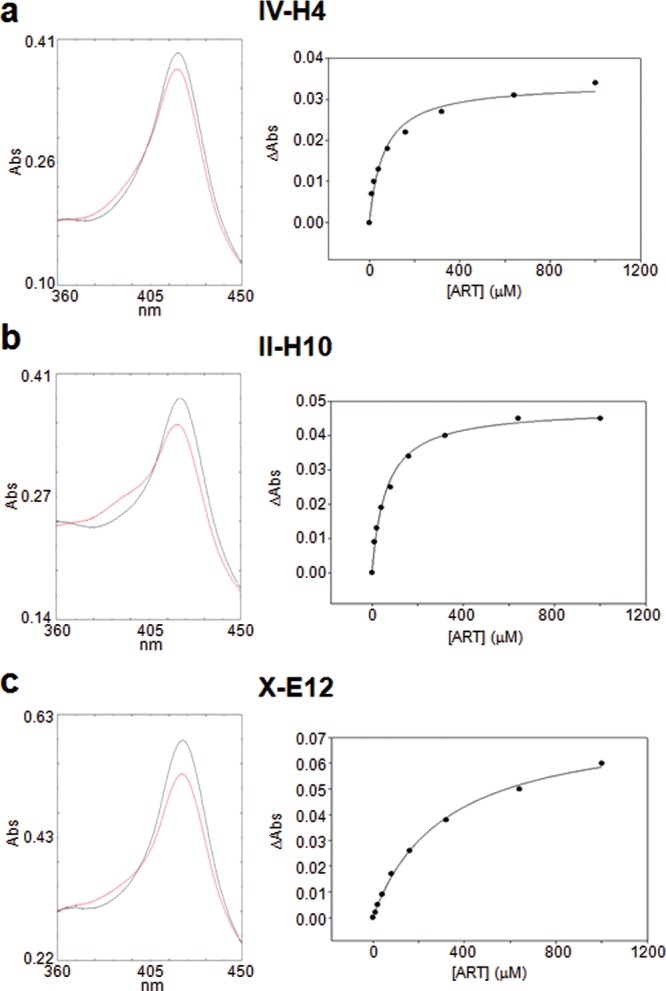
Artemisinin binding experiments with (a) variant IV-H4, (b) variant II-H10, and (c) variant X-E12. Left panel: overlay of the enzyme absorbance spectrum before (gray line) and after (red line) addition of artemisinin (1 mM), illustrating the substrate-induced shift of the heme spin state equilibrium. Right panel: representative plot of the artemisinin-induced heme spin shift versus artemisinin concentration. The dissociation constant (KD) for the enzyme–artemisinin complex was calculated via nonlinear fitting of the experimental data (dots) to a noncooperative 1:1 binding model equation (solid line). Data relative to the other variants of Table 1 are provided in the Supporting Information.
Further experiments were carried out to analyze the impact of the mutations on the catalytic rates of the enzymes. These analyses revealed that all the selective 7(S)-, 7(R)-, and 6a-hydroxylating variants exhibited a 3- to 10-fold lower initial product formation rate compared to FL#62 and the less selective II-E2 (Table 1). This trade-off between oxidation rate and site-selectivity has been observed in other studies as well,13 and it can be rationalized here considering that the improved site-selectivity in the former enzymes must inherently involve a more specific enzyme–substrate interaction and thus a restriction of the (productive) binding orientations available to ART during oxidation. In the case of II-H10 and V-H2, the observed reduction in product formation rate is likely to result also from a reduction in their coupling efficiency (= ratio of product formation rate/NADPH oxidation rate) as compared to the parent enzyme. For all the other selective P450 variants (IV-H4, X-E12, X-F11), however, the improvement in regio/stereoselectivity came at no cost of the coupling efficiency, as evidenced by the values reported in Table 1. Notably, for both the 6a-hydroxylating variant X-F11 and the 7(S)-hydroxylating variant IV-H4 the coupling efficiency significantly improved compared to FL#62, exceeding values of 55% and 70%, respectively.
Preparative-Scale Synthesis of Hydroxylated ART Derivatives and Fluorinated ART-Based Drugs
The catalytic turnovers achieved in analytical-scale settings indicated that the evolved P450 variants could be valuable for synthetic purposes. Prior attempts toward enzymatic hydroxylation of ART have involved the use of oxidizing strains.20 Besides requiring long reaction times (3–14 days), these transformations have however resulted in the unselective oxidation of the natural product and/or its degradation to the biologically inactive deoxoartemisinin via deoxygenation of the endoperoxide group.20 To assess the synthetic utility of the engineered P450 catalysts developed here, large-scale reactions involving up to 0.4 g of ART were carried out for 12 h using IV-H4 (0.19 mol %), II-H10 (0.25 mol %), and X-F11 (0.28 mol %) in buffer (50 mM KPi, pH 8.0) in the presence of a cost-effective NADPH regeneration system consisting of a thermostable phosphite dehydrogenase28 and sodium phosphite as sacrificial reductant. From these reactions, 0.26 to 0.41 g of the three desired products (7(S)-, 7(R)-, and 6a-hydroxy-ART, respectively) could be isolated in over 90% yields. Interestingly, both IV-H4 and II-H10 were found to support higher total turnovers under these settings (485 and 350 TTN, respectively), likely due to more favorable oxygen transfer conditions.
Importantly, access to preparative amounts of 3 and 4 could now allow for the direct modification of two metabolically labile sites in artemisinin and derivatives thereof16,18,19 via stereoconservative hydroxyl group functionalizations (e.g., alkylation or acylation). At the same time, the complementary stereoselectivity of IV-H4 for C7 hydroxylation can be leveraged upon to chemically protect, in a two-step sequence, the pro-R C–H bond in C7 via deoxofluorination, a transformation that typically proceeds through inversion of configuration at secondary carbon centers.29 To illustrate this point, the enzymatically produced 7(S)-hydroxy-artemisinin 2 was reacted with DAST to afford enantiopure 7(R)-fluoro-artemisinin 5 in 82% yield (Scheme 1). 5 was then converted in two steps into 6 and 7, which correspond, respectively, to the clinical antimalarial drugs artemether and artesunate bearing a C–H to C–F substitution, with the ideal configuration, at the major site of metabolic attack of these drugs by human hepatic P450s.16,18,19 Altogether, these results demonstrated the viability of these P450 catalysts for oxyfunctionalization of ART at preparative scales as well as their utility toward enabling relevant, late-stage elaborations of ART scaffold via P450-mediated C–H functionalization.
Scheme 1. Chemoenzymatic Synthesis of 7(R)-Fluoroartemether (6) and 7(R)-Fluoroartesunate (7).

Conclusions
In summary, we have demonstrated how a systematic approach based on first-sphere active site mutagenesis, high-throughput P450 fingerprinting, and fingerprint-based P450 reactivity predictions can provide an efficient solution to the problem of developing P450 catalysts with fine-tuned site-selectivity for the oxidative activation of multiple, isolated sp3 C–H bonds in a complex molecule. By guiding and focusing our search for the desired catalysts across a large engineered P450 library, this method allowed us to accomplish our goal of refining the site-selectivity of a P450 enzyme in a time- and cost-effective manner. To our knowledge, the complete inversion in stereoselectivity achieved with II-H10 (100% ee (R) from 78% ee (S) in FL#62), the absolute regioselectivity and stereocomplementarity obtained with the IV-H4/II-H10 pair, and the regioselectivity shift achieved with X-E12 to afford the selective hydroxylation of a primary, nonallylic/nonbenzylic C–H site (7% → 94%) remain unprecedented in previous P450 engineering efforts.9,10 It is also worth noting that the overall process required the empirical testing of only 75 P450 variants via laborious HPLC-based methods, thereby reducing by orders of magnitude the screening efforts currently associated with the search for selective P450 catalysts.14 From a methodological standpoint, another important aspect is that the tier-2 component of this approach is independent of the nature of the target substrate whereas the tier-3 method could be readily extended to any probe-unrelated compound of interest, making this strategy potentially very general in terms of substrate scope. From the characterization of the evolved artemisinin-hydroxylating variants, intriguing trends have emerged with respect to the active site positions and mutations responsible for steering the selectivity of these enzymes toward each one of the three, spatially close sp3 C–H bonds in C7 and C6a of artemisinin (Figure 1b). These findings call for future studies to explore in more detail the molecular mechanisms that permit such a subtle control on the C–H oxidation reaction catalyzed by this group of related variants. Finally, the P450-based oxidation catalysts developed in this work disclose now the opportunity to selectively functionalize relevant aliphatic positions within the artemisinin scaffold that have so far remained inaccessible to chemical methods/catalysts.6,16,17 As demonstrated with the preparation of 7(R)-fluoroartemether and 7(R)-fluoroartesunate, the suitability of this set of engineered P450s for late-stage C–H functionalization of artemisinin at practically useful scales is expected to render them of particularly high value toward the synthesis and investigation of new classes of C7- and C6a-modified artemisinin-based antimalarial agents.
Experimental Section
Construction and Cloning of the P450 Libraries
Multiple site-saturation (NNK) mutagenesis libraries were prepared using pCWori_FL#62 as template, primers BamHI_2_fwd (5′-GGAAACAGGATCCATCGATGC-3′) and SacI_2_rev (5′-AATATCGAGCTCGTAGTTTGTATGATC-3′) as megaprimers, and the oligonucleotides of Table S1 in the Supporting Information as mutagenizing primers. Construction of libraries 78/87, 78/81/87, 78/87/181, 78/87/184, 78/81/82/87, and 81/82/87/184 was described earlier.21 Additional libraries (78/81/82/87/181/184 and 74/81/82/87/181/184) were constructed in a similar manner by PCR overlap extension mutagenesis. The SOE products (1.5 Kbp) were digested with BamHI and SacI restriction enzymes and ligated to BamHI/SacI double-digested pCWori_FL#62 vector. The ligation mixtures were transformed in chemically competent DH5α cells and plated on LB agar plates containing ampicillin (100 mg L–1) followed by overnight incubation at 37 °C.
Expression and Fingerprinting of P450 Libraries in 96-Well Plates
96-Deep-well plates containing 400 μL of LB medium (100 mg of ampicillin L–1) per well were inoculated with single colonies from the P450 libraries and shaken overnight at 37 °C and 200 rpm. A row (8 wells) in each plate was inoculated with DHα cells expressing FL#62 (or II-E2 in the case of II-E2-based libraries) as a reference. After overnight growth, the LB plates were used to inoculate a second set of 96-deep-well plates containing 900 μL of Terrific Broth (TB) medium (100 mg of ampicillin L–1). At OD600 = 1.0, the TB cultures were induced with 0.25 mM β-d-1-thiogalactopyranoside (IPTG) and 0.3 mM δ-aminolevulinic acid (ALA). After incubation at 30 °C and 200 rpm for 18 h, the plates were centrifuged at 3500 rpm and the pellets were separated from the supernatant and frozen at −80 °C. Cell lysates were prepared by adding 400 μL of lysis solution (4 U of deoxyribonuclease I, 0.8 mg/mL lysozyme, 10 mM MgCl2, 50 mM phosphate buffer, pH 7.5) to each well. After incubation at 37 °C for 70 min, clarified lysates for the screening were obtained by centrifuging the plates at 4,000 rpm. P450 demethylation activity on probe P1–P5 (Figure S2 in the Supporting Information) was measured in parallel reactions with the aid of a Beckman Coulter Multimek 96 automated pipettor and a TECAN Infinity plate reader. Reactions were carried out by mixing 50 μL of clarified cell lysate with 150 μL of 50 mM phosphate buffer (pH 7.5) containing the probe (final concentration: 1 mM) and a phosphite dehydrogenase (PTDH)-based cofactor regeneration system (final concentrations: 1.8 μM PTDH, 50 mM sodium phosphite, 150 μM NADP+). After incubation for 1 h at room temperature, to each well was added 50 μL of 2 M NaOH containing 150 mM Purpald following by reading of the absorbance at 550 nm with the plate reader. The measured demethylation activity of each member of the library on the probes P1–P5 was then normalized to the activity of the parent enzyme from the same plate.
Protein Expression and Purification
The P450 enzymes were expressed from pCWori-based vectors and purified by ion-exchange chromatography as described previously.21 P450 concentration was determined from CO binding difference spectra (ε450–500 = 91,000 M–1 cm–1). The vector encoding for the thermostable phosphite dehydrogenase (PTDH) was kindly provided by the Zhao group.28 PTDH was expressed and purified via Ni-affinity chromatography according to the published procedure.28
Isolation and Characterization of Artemisinin Hydroxylation Products
A 200 mL scale reaction was set up adding FL#62 (1 μM) to a buffered solution (50 mM potassium phosphate, pH 8.0) containing 32 mg of artemisinin (0.53 mM), PTDH (2 μM), NADP+ (150 μM), and sodium phosphite (50 mM). The reaction mixture was stirred overnight at room temperature and then extracted with dichloromethane (3 × 30 mL). The collected organic layers were dried with Na2SO4, concentrated under reduced pressure, and purified by flash chromatography (dichloromethane/hexanes/ethyl acetate: 1/1/1) to afford 2 (18 mg), 3 (2 mg), 4 (1 mg), and recovered artemisinin (10 mg).
7(S)-Hydroxyartemisinin (2)
1H NMR (500 MHz, CDCl3): δ = 1.18 (3 H, d, J = 7.2 Hz), 1.23 (1 H, m), 1.27 (3 H, d, J = 7.2 Hz), 1.44 (1 H, m), 1.50 (3 H, s), 1.57 (2 H, m), 1.79 (OH, br), 1.95 (1 H, m), 2.02–2.20 (3 H, m), 2.48 (1 H, m), 3.32 (1 H, ddd, J = 10.6 Hz, J = 10.6 Hz, J = 4.5 Hz), 3.42 (1 H, m), 5.98 (1 H, s). 13C NMR (100 MHz, CDCl3): δ = 12.6, 15.5, 24.8, 25.1, 32.1, 32.6, 35.8, 42.3, 44.5, 47.9, 73.5, 78.8, 93.5, 105.5, 171.6. MS (ESI) calcd for C15H23O6 [M + H]+m/z: 299.15, found 299.47. The 7(S) configuration of 2 was confirmed based on the 3J coupling constant between the 7(H) proton and 6(H) and 8(H) protons and the known chair conformation of the cyclohexyl ring in artemisinin.30 The observed coupling constants (3J6ax,7 = 10.6 Hz; 3J8ax,7 = 10.6 Hz; 3J8eq,7 = 4.5 Hz) are consistent with 7(H) being in trans to 6(H) and thus with C7 atom having S configuration.
7(R)-Hydroxyartemisinin (3)
1H NMR (500 MHz, CDCl3): δ = 1.12 (3 H, d, J = 6.7 Hz), 1.23 (3 H, d, J = 7.3 Hz), 1.34 (1 H, dd, J = 13.7 Hz, J = 2.1 Hz), 1.46–1.51 (4 H, m), 1.56 (1 H, m), 1.81 (OH, br), 1.95 (2 H, m), 2.10 (2 H, m), 2.40–2.53 (2 H, m), 3.45 (1 H, m), 3. 89 (1 H, ddd, J = 2.8 Hz, J = 2.8 Hz, J = 2.5 Hz), 5.90 (1 H, s). 13C NMR (100 MHz, CDCl3): δ = 12.5, 15.8, 24.6, 25.2, 30.7, 32.4, 36.0, 37.6, 41.3, 43.4, 69.1, 79.3, 93.4, 105.5, 172.4. MS (ESI) calcd for C15H23O6 [M + H]+m/z: 299.15, found 299.41. The 7(R) configuration of 3 was confirmed based on the 3J coupling constant between the 7(H) proton and 6(H) and 8(H) protons and the known chair conformation of the cyclohexyl ring in artemisinin.30 The observed coupling constants (3J6ax,7 = 2.8 Hz; 3J8ax,7 = 2.8 Hz; 3J8eq,7 = 2.5 Hz) are consistent with 7(H) being in cis to 6(H) and thus with C7 atom having R configuration.
6a-Hydroxyartemisinin (4)
1H NMR (500 MHz, CDCl3): δ = 1.15 (1 H, m), 1.26 (3 H, d, J = 6.6 Hz), 1.36–1.49 (4 H, m), 1. 1.54–1.61 (3 H, m), 1.65 (OH, br), 1.76–1.85 (2 H, m), 1.95–2.14 (3 H, m), 2.50 (1 H, ddd, J = 17.3 Hz, J = 13.3 Hz, J = 3.9 Hz), 3.45 (1 H, m), 3. 68 (1 H, dd, J = 10.6 Hz, J = 5.6 Hz), 3.79 (1 H, dd, J = 10.6 Hz, J = 3.0 Hz), 5.93 (1 H, s). 13C NMR (100 MHz, CDCl3): δ = 12.6, 23.0, 24.5, 25.2, 27.9, 32.9, 35.9, 44.2, 44.5, 44.8, 64.1, 79.5, 93.6, 105.4, 172.0. MS (ESI) calcd for C15H23O6 [M + H]+m/z: 299.15, found 299.39.
Determination of Total Turnovers and Regio- and Stereoselectivity of the P450 Variants
Analytical-scale reactions (1 mL) were carried using 0.5–1 μM P450, 0.5 mM artemisinin, 2 μM PTDH, 100 μM NADP+, and 50 mM sodium phosphite in potassium phosphate buffer (50 mM, pH 8.0). The P450 variants described in Table 1 were characterized in purified form, while those described in Tables S2–S4 in the Supporting Information were characterized directly from cell lysates. After 12 h, 9-fluorenone was added to the mixtures as internal standard. The hydroxylation products were functionalized with benzoyl chloride followed by HPLC analysis as described in more detail in the Supporting Information. TTN values were calculated based on the total amount of hydroxylated products in the reactions as quantified based on the calibration curves generated using purified 2–4. The enzyme regio- and stereoselectivity was determined based on the peak areas corresponding to the hydroxylation products 2, 3, and 4. Mean and standard deviation values reported for P450 variants in Table 1 were calculated from experiments performed at least in triplicate.
Measurement of Product Formation Rates and Coupling Efficiency
Initial product formation rates were measured from 1 mL scale reactions containing 250 μM artemisinin, 0.1–0.5 μM purified P450, and 200 μM NADPH in potassium phosphate buffer (50 mM, pH 8.0) at room temperature. After 30 s, the samples were extracted with dichloromethane and subjected to benzoyl chloride derivatization followed by HPLC analysis as described above. Cofactor oxidation rate in the presence of artemisinin was measured by monitoring NADPH depletion at 340 nm (ε = 6.22 mM–1 cm–1) using 0.1 μM purified P450, 250 μM artemisinin, and 200 μM NADPH. Coupling efficiency was calculated from the ratio between the initial product formation rate and the initial NADPH oxidation rate. Reported mean and standard deviation values were calculated from experiments performed at least in triplicate.
Determination of KD Values for Artemisinin Binding
Binding experiments were performed using 3 μM purified P450 in potassium phosphate buffer (50 mM, pH 8.0) by titrating increasing amounts of artemisinin (5 μM to 1 mM) from an ethanol stock solution (50 mM). At each concentration, a difference spectrum from 350 to 500 nm was recorded and binding curves were generated by plotting the change in absorbance at 390 and 420 nm corresponding to the high-spin and low-spin state of the enzyme, respectively, against the artemisinin concentration. KD values were calculated using Sigma Plot via nonlinear fitting of the experimental binding curves to an equation describing a standard 1:1 binding interaction. Reported mean and standard deviation values were calculated from experiments performed at least in triplicate.
Fingerprint Comparative Analysis and Trained Predictions
After high-throughput fingerprinting, P450 variants displaying a unique fingerprint were identified by selecting the parent-normalized fingerprints according to the following criteria: (a) >10% of parent activity on at least one probe; and (b) larger than 20% variation in activity on at least one probe compared to the parent or any other member of the library. The P450 variants with a unique fingerprint were transferred from the library plates to new 96-well plates containing P450BM3(F87A) as reference enzyme. The P450 variants of this collection were then fingerprinted in triplicate using the probe activity of P450BM3(F87A) for fingerprint normalization. The standard error in the values of the fingerprints provided in Figure 3b is within 10%.
To generate the fingerprint-based model predictive of artemisinin reactivity, 19 randomly chosen P450 variants from the collection were characterized for artemisinin hydroxylation activity measuring their TTN values (Table S2 in the Supporting Information). After normalization against the activity of the parent enzyme (TTN(P450 variant)/TTN(FL#62)), the normalized activities were then correlated with the corresponding fingerprints using multiple linear regression (MLR) analysis using the equation y = b0 + b1x1 + b2x2 + b4x4 + b4x4 + b5x5, where y corresponds to relative artemisinin reactivity, x1 to x5 correspond to the five fingerprint components (activity on probes 1 to 5, respectively), and b1 to b5 correspond to the regression coefficients for the five independent variables x1 to x5. This process yielded the plot of calculated versus experimental artemisinin activity presented in Figure 2a, with the calculated regression coefficients being b1 = −0.0109, b2 = 0.0016, b3 = −0.0551, b4 = 0.0338, and b5 = 0.01271. The low RMSD value (0.0859) indicated an excellent fit between the calculated and experimental values. This model was then used to rank the P450 variants of the collection according to their predicted artemisinin reactivity. The same method was applied for generating a fingerprint-based predictive model for ranking the second-generation variants derived from II-E2. In this case, the training set used for calculations was expanded to include II-E2 (training set B, Table S2 in the Supporting Information) as this variant exhibited the highest selectivity toward 6a-hydroxylation. MLR analysis of the correlation between fingerprints and artemisinin hydroxylation activities across this training data set yielded a best-fitting model with regression coefficients b1 = −0.0037, b2 = −0.0278, b3 = −0.0839, b4 = 0.1158, and b5 = 0.1202 and a RMSD of 0.1789 (Figure S2 in the Supporting Information). Based on this model, the 50 II-E2 derived variants were scored according to their predicted artemisinin reactivity (Figure S3 in the Supporting Information) and subsequently prioritized according to their score.
Preparative-Scale Synthesis of 7(S)-, 7(R)-, and 6a-Hydroxyartemisinin
To prepare 2, purified P450 variant IV-H4 (final concentration: 1 μM; 0.19 mol %) was dissolved in 1 L of 50 mM phosphate buffer (pH 8.0) in the presence of artemisinin (150 mg, final concentration: 0.53 mM), PTDH (2 μM), NADP+ (150 μM), and sodium phosphite (50 mM). The reaction mixture was stirred for 12 h at room temperature. The crude product was extracted with dichloromethane (3 × 100 mL). The collected organic layers were dried with Na2SO4, concentrated, and purified by flash chromatography (dichloromethane/hexanes/ethyl acetate: 1/1/1.5) to afford 2 (138 mg, 92%). The same procedure was repeated two more times to yield a total of 410 mg of 2. To prepare 3, purified P450 variant II-H10 (final concentration 1 μM; 0.25 mol %) was dissolved in 1 L of 50 mM phosphate buffer (pH 8.0) in the presence of artemisinin (110 mg, final concentration: 0.39 mM), PTDH (2 μM), NADP+ (150 μM), and sodium phosphite (50 mM). The reaction mixture was stirred for 12 h at room temperature. The crude product was extracted with dichloromethane (3 × 100 mL). The collected organic layers were dried with Na2SO4, concentrated, and purified by flash chromatography (dichloromethane/hexanes/ethyl acetate: 1/1/1.5) to afford 2 (100 mg, 91%, TTN: 350). The same procedure was repeated two more times to yield a total of 305 mg of 2. To prepare 4, purified P450 variant X-F11 (final concentration: 1 μM; 0.28 mol %) was dissolved in 1 L of 50 mM phosphate buffer (pH 8.0) in the presence of artemisinin (100 mg, final concentration: 0.35 mM), PTDH (2 μM), NADP+ (150 μM), and sodium phosphite (50 mM). The reaction mixture was stirred for 12 h at room temperature. The crude product was extracted with dichloromethane (3 × 100 mL). The collected organic layers were dried with Na2SO4, concentrated, and purified by flash chromatography (dichloromethane/hexanes/ethyl acetate: 1/1/2) to afford 4 (90 mg, 90%). The same procedure was repeated two more times to yield a total of 260 mg of 4.
Synthesis of 7(R)-Fluoroartemisinin (5)
To a solution of 3 (50 mg, 0.17 mmol) in anhydrous CH2Cl2 (5 mL) was added (diethylamino)sulfur trifluoride (55 mg, 0.34 mmol) dropwise at −78 °C. The reaction mixture was warmed up to 0 °C and stirred until the starting material disappeared as determined by TLC. The reaction mixture was quenched with 60 μL of triethylamine and extracted with CH2Cl2 (2 × 5 mL). The collected organic layers were dried with Na2SO4 and concentrated, and the residue was purified by flash chromatography (hexanes/ethyl acetate: 3/1) to afford 5 (42 mg, 82%). 1H NMR (500 MHz, CDCl3): δ = 1.20 (3 H, d, J = 7.0 Hz), 1.27 (3 H, d, J = 7.4 Hz), 1.28–1.50 (6 H, m), 1.85 (1 H, m), 1.94 (1 H, m), 2.03 (1 H, m), 2.29–2.36 (2 H, m), 2.53 (1 H, m), 3.49 (1 H, m), 4.67 (1 H, m), 5.87 (1 H, s). 13C NMR (100 MHz, CDCl3): δ = 10.12, 12.4, 24.7, 25.2, 28.7 (d, J = 21.8 Hz), 32.3, 35.9, 37.9, 40.7 (d, J = 20.6 Hz), 43.9, 78.7, 90.6 (d, J = 166.0 Hz), 93.0, 105.5, 171.9. 19F NMR (376.5 MHz, CDCl3): δ = −133.9. MS (ESI) calcd for C15H22FO5 [M + H]+m/z: 301.15, found 301.42.
Synthesis of 7(R)-Fluoroartemether (6)
To a solution of 5 (20 mg, 0.07 mmol) in 2 mL of anhydrous methanol was added sodium borohydride (8 mg, 0.21 mmol) at 0 °C. The reaction mixture was stirred at 0 °C until the starting material disappeared as determined by TLC. The reaction mixture was quenched with 5 mL of ice-cold water, and methanol was removed by evaporation in vacuo. The aqueous layer was then extracted with CH2Cl2 (3 × 5 mL), and the collected organic layers were dried with Na2SO4 and concentrated. The crude product was dissolved in 2 mL of anhydrous MeOH followed by the addition of sulfuric acid (11 μL, 0.21 mmol). The mixture was stirred overnight at room temperature and then quenched with 50 μL of triethylamine. The mixture was concentrated under reduced pressure and purified by flash chromatography (hexanes/ethyl acetate: 3/1) to afford 6 (11 mg, 55%). 1H NMR (500 MHz, CDCl3): δ = 0.97 (3 H, d, J = 7.5 Hz), 1.15 (3 H, d, J = 6.8 Hz), 1.50 (5 H, m), 1.82–1.92 (2 H, m), 1.98 (1 H, m), 2.05–2.20 (3 H, m), 2.47 (1 H, m), 2.72 (1 H, m), 3.48 (3 H, s), 4.57 (1 H, d, J = 49.5 Hz) 4.76 (1 H, d, J = 3.3 Hz), 5.43 (1 H, s). 13C NMR (100 MHz, CDCl3): δ = 12.7, 16.1, 24.6, 26.1, 29.7 (d, J = 20.7 Hz), 36.4, 37.3, 40.6 (d, J = 19.9 Hz), 45.1, 56.1, 80.2, 86.9, 91.9 (d, J = 172.5 Hz), 92.3, 103.6, 104.2. 19F NMR (376.5 MHz, CDCl3): δ = −134.2. MS (ESI) calcd for C16H25FNaO5 [M + Na]+m/z: 339.16, found 339.25.
Synthesis of 7(R)-Fluoroartesunate (7)
To a solution of 5 (20 mg, 0.07 mmol) in 2 mL of anhydrous methanol was added sodium borohydride (8 mg, 0.21 mmol) at 0 °C. The reaction mixture was stirred until the starting material disappeared as determined by TLC, followed by quenching with 5 mL of ice-cold water. The mixture was evaporated in vacuo to remove methanol, and the remaining aqueous layer was extracted with CH2Cl2 (3 × 5 mL). The collected organic layers were dried with Na2SO4 and concentrated. The crude product was dissolved in 2 mL of 1,4-dioxane followed by the addition of succinic anhydride (8 mg, 0.077 mmol) and triethylamine (50 μL, 0.35 mmol). The mixture was stirred until the starting material disappeared as determined by TLC. The mixture was then concentrated under reduced pressure and purified by flash chromatography (dichloromethane/methanol: 20/1) to afford 7 (24 mg, 90%). 1H NMR (500 MHz, CDCl3): δ = 0.90 (3 H, d, J = 7.1 Hz), 1.05–1.11 (4 H, m),1.32–1.60 (6 H, m), 1.90 (2 H, m), 2.10–2.22 (3 H, m), 2.47 (1 H, m), 2.66–2.79 (4 H, m), 4.65 (1 H, d, J = 50.1 Hz), 5.46 (1 H, s), 5.82 (1 H, d, J = 10.1 Hz). 13C NMR (100 MHz, CDCl3): δ = 11.7, 15.9, 24.4, 25.9, 27.2 (d, J = 20.6 Hz), 28.5, 28.7, 31.0, 36.1, 38.3, 40.1 (d, J = 19.2 Hz), 44.3, 52.1, 79.2, 91.5 (d, J = 146.5 Hz), 93.2, 104.6, 171.1, 172.6. 19F NMR (376.5 MHz, CDCl3): δ = −135.2. MS (ESI) calcd for C19H27FNaO8 [M + Na]+m/z: 402.17, found 402.33.
Acknowledgments
This work was supported by the NIH Grant R01 GM095628-01A1 and by the University of Rochester Multidisciplinary Research Award (R.F.). M.D.D. acknowledges the De Kiewiet program and NSF REU program for financial support. MS instrumentation was supported by the National Science Foundation Grants CHE-0840410 and CHE-0946653.
Supporting Information Available
Chemical structures of probes P1–P5, oligonucleotide sequences, data corresponding to the enzyme training set and fingerprint-based predictions for II-E2-derived variants, characterization data for the predicted ART-reactive FL#62- and II-E2-derived P450 variants, additional data from spin-shift experiments, and experimental details about the derivatization and analysis of the hydroxylated artemisinin products. This material is available free of charge via the Internet at http://pubs.acs.org.
The authors declare no competing financial interest.
Funding Statement
National Institutes of Health, United States
Supplementary Material
References
- a Newhouse T.; Baran P. S. Angew. Chem., Int. Ed. 2011, 50, 3362. [DOI] [PMC free article] [PubMed] [Google Scholar]; b Neufeldt S. R.; Sanford M. S. Acc. Chem. Res. 2012, 45, 936. [DOI] [PMC free article] [PubMed] [Google Scholar]; c Bruckl T.; Baxter R. D.; Ishihara Y.; Baran P. S. Acc. Chem. Res. 2012, 45, 826. [DOI] [PMC free article] [PubMed] [Google Scholar]
- Que L. Jr.; Tolman W. B. Nature 2008, 455, 333. [DOI] [PubMed] [Google Scholar]
- a Brodsky B. H.; Du Bois J. J. Am. Chem. Soc. 2005, 127, 15391. [DOI] [PubMed] [Google Scholar]; b Wender P. A.; Hilinski M. K.; Mayweg A. V. Org. Lett. 2005, 7, 79. [DOI] [PubMed] [Google Scholar]
- a Cook B. R.; Reinert T. J.; Suslick K. S. J. Am. Chem. Soc. 1986, 108, 7281. [Google Scholar]; b Yang J.; Gabriele B.; Belvedere S.; Huang Y.; Breslow R. J. Org. Chem. 2002, 67, 5057. [DOI] [PubMed] [Google Scholar]; c Das S.; Incarvito C. D.; Crabtree R. H.; Brudvig G. W. Science 2006, 312, 1941. [DOI] [PubMed] [Google Scholar]
- a Lee S.; Fuchs P. L. J. Am. Chem. Soc. 2002, 124, 13978. [DOI] [PubMed] [Google Scholar]; b Gomez L.; Garcia-Bosch I.; Company A.; Benet-Buchholz J.; Polo A.; Sala X.; Ribas X.; Costas M. Angew. Chem., Int. Ed. 2009, 48, 5720. [DOI] [PubMed] [Google Scholar]
- Chen M. S.; White M. C. Science 2007, 318, 783. [DOI] [PubMed] [Google Scholar]
- a Dangel B. D.; Johnson J. A.; Sames D. J. Am. Chem. Soc. 2001, 123, 8149. [DOI] [PubMed] [Google Scholar]; b Desai L. V.; Hull K. L.; Sanford M. S. J. Am. Chem. Soc. 2004, 126, 9542. [DOI] [PubMed] [Google Scholar]; c Dick A. R.; Hull K. L.; Sanford M. S. J. Am. Chem. Soc. 2004, 126, 2300. [DOI] [PubMed] [Google Scholar]; d Chen K.; Baran P. S. Nature 2009, 459, 824. [DOI] [PubMed] [Google Scholar]
- a Glieder A.; Farinas E. T.; Arnold F. H. Nat. Biotechnol. 2002, 20, 1135. [DOI] [PubMed] [Google Scholar]; b Fasan R.; Chen M. M.; Crook N. C.; Arnold F. H. Angew. Chem., Int. Ed. 2007, 46, 8414. [DOI] [PubMed] [Google Scholar]; c Rentmeister A.; Arnold F. H.; Fasan R. Nat. Chem. Biol. 2009, 5, 26. [DOI] [PMC free article] [PubMed] [Google Scholar]; d Whitehouse C. J.; Bell S. G.; Tufton H. G.; Kenny R. J.; Ogilvie L. C.; Wong L. L. Chem. Commun. 2008, 966. [DOI] [PubMed] [Google Scholar]; e Li S.; Chaulagain M. R.; Knauff A. R.; Podust L. M.; Montgomery J.; Sherman D. H. Proc. Natl. Acad. Sci. U.S.A. 2009, 106, 18463. [DOI] [PMC free article] [PubMed] [Google Scholar]; f Weis R.; Winkler M.; Schittmayer M.; Kambourakis S.; Vink M.; Rozzell D.; Glieder A. Adv. Synth. Catal. 2009, 351, 2140. [Google Scholar]; g Weber E.; Seifert A.; Antonovici M.; Geinitz C.; Pleiss J.; Urlacher V. B. Chem. Commun. 2011, 47, 944. [DOI] [PubMed] [Google Scholar]; h Chang M. C.; Eachus R. A.; Trieu W.; Ro D. K.; Keasling J. D. Nat. Chem. Biol. 2007, 3, 274. [DOI] [PubMed] [Google Scholar]; i Robin A.; Roberts G. A.; Kisch J.; Sabbadin F.; Grogan G.; Bruce N.; Turner N. J.; Flitsch S. L. Chem. Commun. 2009, 2478. [DOI] [PubMed] [Google Scholar]; j Larsen A. T.; May E. M.; Auclair K. J. Am. Chem. Soc. 2011, 133, 7853. [DOI] [PubMed] [Google Scholar]; k Bordeaux M.; Galarneau A.; Fajula F.; Drone J. Angew. Chem., Int. Ed. 2011, 50, 2075. [DOI] [PubMed] [Google Scholar]; l Rea V.; Kolkman A. J.; Vottero E.; Stronks E. J.; Ampt K. A. M.; Honing M.; Vermeulen N. P. E.; Wijmenga S. S.; Commandeur J. N. M. Biochemistry 2012, 51, 750. [DOI] [PubMed] [Google Scholar]
- Fasan R. ACS Catal. 2012, 2, 647. [Google Scholar]
- a Whitehouse C. J.; Bell S. G.; Wong L. L. Chem. Soc. Rev. 2012, 41, 1218. [DOI] [PubMed] [Google Scholar]; b Lewis J. C.; Arnold F. H. Chimia 2009, 63, 309. [Google Scholar]; c Bernhardt R. J. Biotechnol. 2006, 124, 128. [DOI] [PubMed] [Google Scholar]
- a Bell S. G.; Chen X. H.; Sowden R. J.; Xu F.; Williams J. N.; Wong L. L.; Rao Z. H. J. Am. Chem. Soc. 2003, 125, 705. [DOI] [PubMed] [Google Scholar]; b Kumar S.; Scott E. E.; Liu H.; Halpert J. R. J. Biol. Chem. 2003, 278, 17178. [DOI] [PubMed] [Google Scholar]; c Seifert A.; Vomund S.; Grohmann K.; Kriening S.; Urlacher V. B.; Laschat S.; Pleiss J. Chembiochem 2009, 10, 853. [DOI] [PubMed] [Google Scholar]; d Venkataraman H.; Beer S. B.; Bergen L. A.; Essen N.; Geerke D. P.; Vermeulen N. P.; Commandeur J. N. ChemBioChem 2012, 13, 520. [DOI] [PubMed] [Google Scholar]
- Lentz O.; Feenstra A.; Habicher T.; Hauer B.; Schmid R. D.; Urlacher V. B. ChemBioChem 2006, 7, 345. [DOI] [PubMed] [Google Scholar]
- a Meinhold P.; Peters M. W.; Hartwick A.; Hernandez A. R.; Arnold F. H. Adv. Synth. Catal. 2006, 348, 763. [Google Scholar]; b Tang W. L.; Li Z.; Zhao H. Chem. Commun. 2010, 46, 5461. [DOI] [PubMed] [Google Scholar]
- Kille S.; Zilly F. E.; Acevedo J. P.; Reetz M. T. Nat. Chem. 2011, 3, 738. [DOI] [PubMed] [Google Scholar]
- White N. J. Science 2008, 320, 330. [DOI] [PubMed] [Google Scholar]; Olliaro P.; Wells T. N. C. Clin. Pharmacol. Ther. 2009, 85, 584. [DOI] [PubMed] [Google Scholar]
- O’Neill P. M.; Posner G. H. J. Med. Chem. 2004, 47, 2945. [DOI] [PubMed] [Google Scholar]
- Chaturvedi D.; Goswami A.; Saikia P. P.; Barua N. C.; Rao P. G. Chem. Soc. Rev. 2010, 39, 435. [DOI] [PubMed] [Google Scholar]
- Haynes R. K.; Fugmann B.; Stetter J.; Rieckmann K.; Heilmann H. D.; Chan H. W.; Cheung M. K.; Lam W. L.; Wong H. N.; Croft S. L.; Vivas L.; Rattray L.; Stewart L.; Peters W.; Robinson B. L.; Edstein M. D.; Kotecka B.; Kyle D. E.; Beckermann B.; Gerisch M.; Radtke M.; Schmuck G.; Steinke W.; Wollborn U.; Schmeer K.; Romer A. Angew. Chem., Int. Ed. 2006, 45, 2082. [DOI] [PubMed] [Google Scholar]
- Navaratnam V.; Mansor S. M.; Sit N. W.; Grace J.; Li Q.; Olliaro P. Clin. Pharmacokinet. 2000, 39, 255. [DOI] [PubMed] [Google Scholar]
- a Zhan J. X.; Zhang Y. X.; Guo H. Z.; Han J.; Ning L. L.; Guo D. A. J. Nat. Prod. 2002, 65, 1693. [DOI] [PubMed] [Google Scholar]; b Liu J. H.; Chen Y. G.; Yu B. Y.; Chen Y. J. Bioorg. Med. Chem. Lett. 2006, 16, 1909. [DOI] [PubMed] [Google Scholar]; c Parshikov I. A.; Miriyala B.; Muraleedharan K. M.; Avery M. A.; Williamson J. S. J. Ind. Microbiol. Biotechnol. 2006, 33, 349. [DOI] [PubMed] [Google Scholar]; d Patel S.; Gaur R.; Verma P.; Bhakuni R. S.; Mathur A. Biotechnol. Lett. 2010, 32, 1167. [DOI] [PubMed] [Google Scholar]
- Zhang K.; El Damaty S.; Fasan R. J. Am. Chem. Soc. 2011, 133, 3242. [DOI] [PubMed] [Google Scholar]
- Narhi L. O.; Fulco A. J. J. Biol. Chem. 1987, 262, 6683. [PubMed] [Google Scholar]
- a Ravichandran K. G.; Boddupalli S. S.; Hasermann C. A.; Peterson J. A.; Deisenhofer J. Science 1993, 261, 731. [DOI] [PubMed] [Google Scholar]; b Sevrioukova I. F.; Li H.; Zhang H.; Peterson J. A.; Poulos T. L. Proc. Natl. Acad. Sci. U.S.A. 1999, 96, 1863. [DOI] [PMC free article] [PubMed] [Google Scholar]
- Haines D. C.; Tomchick D. R.; Machius M.; Peterson J. A. Biochemistry 2001, 40, 13456. [DOI] [PubMed] [Google Scholar]
- Pylypenko O.; Schlichting I. Annu. Rev. Biochem. 2004, 73, 991. [DOI] [PubMed] [Google Scholar]
- Yeom H.; Sligar S. G.; Li H.; Poulos T. L.; Fulco A. J. Biochemistry 1995, 34, 14733. [DOI] [PubMed] [Google Scholar]
- Oliver C. F.; Modi S.; Sutcliffe M. J.; Primrose W. U.; Lian L. Y.; Roberts G. C. Biochemistry 1997, 36, 1567. [DOI] [PubMed] [Google Scholar]
- McLachlan M. J.; Johannes T. W.; Zhao H. Biotechnol. Bioeng. 2008, 99, 268. [DOI] [PubMed] [Google Scholar]
- Singh R. P.; Shreeve J. M. Synthesis 2002, 17, 2561. [Google Scholar]
- Blasko G.; Cordell G. A.; Lankin D. C. J. Nat. Prod. 1988, 51, 1273. [DOI] [PubMed] [Google Scholar]
- Lisgarten J. N.; Potter B. S.; Bantuzeko C.; Palmer R. A. J. Chem. Crystallogr. 1998, 28, 539. [Google Scholar]
Associated Data
This section collects any data citations, data availability statements, or supplementary materials included in this article.