

Abstract
Background
Information on the pharmacokinetics of tacrolimus during pregnancy is limited to case reports despite the increasing number of pregnant women being prescribed tacrolimus for immunosuppression.
Methods
Blood, plasma and urine samples were collected over one steady-state dosing interval from women treated with oral tacrolimus during early to late pregnancy (n = 10) and postpartum (n = 5). Total and unbound tacrolimus as well as metabolite concentrations in blood and plasma were assayed by a validated LC/MS/MS method. A mixed effect linear model was used for comparison across gestational age and using postpartum as the reference group.
Results
The mean oral clearance (CL/F) based on whole blood tacrolimus concentration was 39% higher during mid- and late-pregnancy compared to postpartum (47.4 ± 12.6 vs. 34.2 ± 14.8 L/h, P < 0.03). Tacrolimus free fraction increased by 91% in plasma (fP) and by 100% in blood (fB) during pregnancy (P = 0.0007 and 0.002, respectively). Increased fP was inversely associated with serum albumin concentration (r = − 0.7, P = 0.003), which decreased by 27% during pregnancy. Pregnancy related changes in fP and fB contributed significantly to the observed gestational increase in tacrolimus whole blood CL/F (r2 = 0.36 and 0.47 respectively, P < 0.01). In addition, tacrolimus whole blood CL/F was inversely correlated with both hematocrit and red blood cell counts, suggesting that binding of tacrolimus to erythrocytes restricts its availability for metabolism. Treating physicians increased tacrolimus dosages in study participants during pregnancy by an average of 45% in order to maintain tacrolimus whole blood trough concentrations in the therapeutic range. This led to striking increases in unbound tacrolimus trough concentrations and unbound AUC, by 112% and 173%, respectively during pregnancy (P = 0.02 and 0.03, respectively).
Conclusions
Tacrolimus pharmacokinetics are altered during pregnancy. Dose adjustment to maintain whole blood tacrolimus concentration in the usual therapeutic range during pregnancy increases circulating free drug concentrations, which may impact clinical outcomes.
Keywords: Pregnancy, tacrolimus dose adjustment, serum albumin, hematocrit, tacrolimus unbound concentration
INTRODUCTION
Tacrolimus, a macrolide immunosuppressant, is used widely to prevent rejection following solid organ transplantation.1 While more than 14,000 pregnancies have been reported in organ transplant recipients, these remain high risk pregnancies for both mother and fetus.2, 3
Tacrolimus dosing is routinely titrated to maintain whole blood trough concentrations within a therapeutic range, due to its narrow therapeutic index and high intra- and inter-patient variability in its pharmacokinetics.4, 5 Whole blood samples are used in therapeutic monitoring due to difficulty in accurately measuring plasma tacrolimus concentrations, primarily because of temperature dependent distribution into the red blood cell and challenges with assay sensitivity.5, 6 Whole blood concentrations are used as surrogate markers for the concentration of active drug at the site(s) of action, despite the knowledge that <0.1% of tacrolimus is unbound in blood and therefore available for receptor binding.7–9
Cytochrome P450 3A (CYP3A) isoforms are responsible for the extensive metabolism of tacrolimus in vivo.10 The two dominant CYP3A isoforms in adult human tissues are CYP3A4 and CYP3A5. Expression of CYP3A4 in the liver and small intestine is unimodally distributed across populations with substantial inter-individual variability.11–15 In contrast, expression of CYP3A5 in the liver, small intestine, kidneys and other organs is polymorphic and determined largely by a single-nucleotide polymorphism (A6986G) that distinguishes the “active” CYP3A5*1 allele (CYP3A5 expressing) from the “inactive” CYP3A5*3 allele. Along with other non-expressing CYP3A5*6 and *7 alleles, this accounts for a markedly reduced cellular CYP3A5 protein expression and function in some individuals.11–15
Tacrolimus is an excellent substrate for both CYP3A4 and CYP3A5,16 with CYP3A5 expressors exhibiting a 1.5- to 2-fold higher tacrolimus apparent oral clearance (CL/F), lower trough concentrations, and higher dosage requirement than nonexpressors with two CYP3A5*3, *6 or *7 alleles.17 Because both enzymes can be found in the gastrointestinal tract, pre-systemic intestinal metabolism of tacrolimus can be considerable.18, 19 The oral absorption of tacrolimus is also influenced by the activity of P-glycoprotein (P-gp), an efflux transporter that transfers tacrolimus from the enterocyte back into the gut lumen.7 Thus, extensive pre-systemic metabolism and P-gp efflux limits the oral bioavailability of tacrolimus in non-pregnant women and men to approximately 14 ± 6%.19, 20
Pregnancy is accompanied by an increase in maternal blood volume as well as significant changes in maternal renal and hepatic function, which in some cases influence the dosage of the medication.21 Previous work suggests that intrinsic CYP3A activity increases by 25–100% during pregnancy using CYP3A probe substrates such as midazolam,22 dextromethorphan,23 and nelfinavir.24, 25 As stated above, tacrolimus is also a substrate of the efflux transporter, P-glycoprotein (P-pg).26, 27 Although intestinal P-gp activity during pregnancy has not been evaluated, our group has shown that renal P-gp activity, assessed by net renal tubular secretion of digoxin, approximately doubles during pregnancy.22 Based on these findings, the metabolism and transport of tacrolimus might be expected to change substantially during pregnancy. Because P-gp is expressed on peripheral blood lymphocytes,28 the effects of pregnancy on lymphocytic P-gp expression and activity might influence the immunosuppressive effects of tacrolimus in pregnant women. We were unable to locate any published data on the effects of pregnancy on lymphocytic P-gp function or activity.
In pregnancy, both albumin and α1-acid glycoprotein (AAG) concentrations in plasma decrease significantly. This is likely related in part to increased plasma volume and increased urinary albumin excretion.29 In plasma, tacrolimus has been shown to bind to AAG and albumin.30, 31 Accordingly, changes in plasma protein concentrations in pregnancy may alter tacrolimus plasma protein binding and also affect its systemic clearance. In addition, red blood cell count and hematocrit decrease in pregnancy.32 This could significantly influence tacrolimus distribution within blood 33 such that patients with lower hematocrit will have a lower tacrolimus whole blood-to-plasma ratio.34, 35 This change may also affect the metabolism and clearance of tacrolimus in pregnancy.36 Not surprisingly, therapeutic monitoring of the immunosuppressive drugs becomes more complicated in pregnancy.2
No comprehensive study of tacrolimus pharmacokinetics in pregnancy has been published to date. The available data are limited to case reports.37–39 Because of the significant physiological and enzymatic changes that occur during pregnancy, and the unique binding characteristics of tacrolimus to blood cells and plasma proteins and its metabolism and transport by CYP3A enzymes and P-gp, we conducted a study to characterize the pharmacokinetics of tacrolimus during pregnancy and postpartum. Our findings may help in the clinical interpretation of tacrolimus concentrations.
MATERIALS AND METHODS
Materials
Tacrolimus for analytical use was kindly provided by Fujisawa USA Inc. (now Astellas Pharma US, Inc., Deerfield, IL). Tacrolimus internal standard (FK506-13C,D2) was purchased from Toronto Research Chemicals (catalog # F370002). The metabolites used for calibration curves were generated biologically and purified chromatographically (see “Isolation and Mass Spectrometric Analysis of Tacrolimus Metabolites”). Blank human (outdated) plasma and blood were purchased from Puget Sound Blood Center (Seattle, WA). Methanol (Optima grade), acetonitrile (Optima grade), ammonium acetate, sodium acetate and silanized inserts (catalog #03-375-3AS) were purchased from Fisher Scientific (Santa Clara, CA). Methyl tert-butyl ether (J.T. Baker) was purchased from VWR International.
Subjects
This study was approved by the Institutional Review Boards at the University of Washington and Georgetown University and was conducted in accordance with their guidelines. All subjects gave written informed consent. We examined the steady-state pharmacokinetics of oral tacrolimus in the blood, plasma and urine of pregnant (n = 10) and postpartum (n = 5) women who were receiving the drug for therapeutic reasons. Women were excluded from the study if their screening hematocrit was less than 28%. Blood, plasma and urine samples were collected during early- (10–14 weeks gestation), mid- (22–26 weeks gestation), and/or late-pregnancy (34–38 weeks gestation), as well as >3 months postpartum.
Sequential blood samples (5 mL) were collected in EDTA glass tubes just before (0 h) and at 0.5, 1, 1.5, 2, 3, 4, 6, 8, 10, 12 h after a regular oral dose. The duration of blood sampling was truncated based on the subject’s dosage interval, which was either 8 or 12 h. After mixing, 2 mL of blood was aliquoted and frozen in glass cryovials. The remaining blood was incubated at 37° C for 30 min. After centrifugation at 37° C, plasma samples were aliquoted and frozen in glass cryovials. Urine was collected in silanized glass jars over the dosing interval and then frozen in silanized glass vials. Glass pipettes were used for all liquid transfers. All blood, plasma and urine samples were stored at −80° C until analysis.
The number of study participants at each gestational age varied due to differences in the timing of each subject’s enrollment during gestation and subject availability. Five of the subjects participated in a single pharmacokinetic study day, three participated in 2 study days, and two participated in all 4 study days. Of the five women who were studied postpartum, two participated in the early pregnancy study, three participated in the mid pregnancy study, and four participated in the late pregnancy study.
Dosing Regimen
Tacrolimus dosages ranged from 3 to 12 mg/day. Oral tacrolimus capsule (Prograf®, Astellas) were provided by the investigators for the 3 days before each study. The subjects were instructed to avoid alcohol, grapefruit, and grapefruit juice for 3 days before each study day and to fast starting 5 h before study drug administration until 1 h after the tacrolimus dose on each study day. Clear liquids were allowed and encouraged during the fasting portion of the study.
Genotyping Methods
Buffy coats or buccal cell DNA was isolated using a DNeasy Blood & Tissue Kit (Qiagen, USA). CYP3A5*3 (rs776746, 6986A>G) polymorphism was determined using a validated Taqman® allelic discrimination assay from Applied Biosystems (Foster City, CA) as described previously.22 With individuals that were identified as having the CYP3A5*1 allele, additional genotyping for the CYP3A5*6 (14690G>A) allele was conducted. The CYP3A5*6 genotype was performed using the same methodology as described for CYP3A5*3 (Taqman® allelic discrimination assay).22
Tacrolimus and Metabolite Analysis
Isolation of Metabolites
Tacrolimus metabolites were generated by incubation of tacrolimus (0.215 mg/mL) with pooled human liver microsomes (3 mg/ml) and NADPH (1mM) for 1 hour. The reaction mixture was extracted twice with methyl-tert-butyl ether, and the organic layers were collected and evaporated to dryness under a stream of nitrogen at 30° C. The residue was reconstituted in methanol and injected onto an analytical column (Symmetry C18, 250 × 4.6 mm; Waters, Milford, MA) heated to 60° C. Metabolites were eluted with a gradient of two mobile phases: H2O (A) and acetonitrile (B). The linear gradient extended from 37% B at 0 min to 62% B at 60 min; the column was washed between runs with 100% B for 30 min. The flow rate was 1 mL/min. Fractions containing UV visible metabolites were collected manually encompassing the following retention times: 27.2 min (13-DMT), 34.5–35.5 min (12-HT), 39.5 min (15-DMT), 46.5 min (31-DMT). Each was dried completely under a stream of nitrogen in heated evaporator, and re-suspended in methanol. The major metabolite in each fraction was purified further, using another analytical liquid chromatography column (Luna, C18(2), 5 μ, 100A, 250×4.6 mm; Phenomenex, Torrance, CA) heated to 60° C. The mobile phases were 20 mM NH4Ac, pH 7.5 (A) and methanol (B). The metabolites were eluted with a linear gradient that extended from 40% B at 0 min to 90% B at 180 min; the flow rate was 1 mL/min. Metabolite peaks were collected encompassing 81 min (13-DMT), 92–93 min (12-HT), 94.5 min (15-DMT), 106.5 min (31-DMT), and the solvent was removed as described above. Isolated metabolites were re-suspended in methanol and stored at −80° C.
Identification of Metabolites
The isolated metabolites were identified using QTOF LC-MS analysis, comparing exact masses and retention times of the purified products with previously isolated and validated metabolites. 16,11, 40 Liquid chromatography was performed with an Agilent HP 1200 that was coupled to an Agilent QTOF 6520 mass spectrometer. The column (Luna, Phenyl-Hexyl 150 × 2 mm, 3 micron; Phenomenex, Torrance, CA) was heated to 60° C. A stepwise linear gradient was used to elute the metabolites: 60% B at 0 min, 90% B at 10 min, and held at 90% for 3 min, 100% B at 13.1 min and held for 5 min and then returned to initial conditions. Solvent A was 20 mM ammonium acetate (pH 7.5) in H2O, and solvent B was 100% methanol. The flow rate was 0.25 mL/min and the total run time was 26 minutes. The mass to charge ratios (m/z) of the MS spectra extracted from the total ion chromatograms were compared with compounds listed in METLIN: Metabolite and Tandem MS Database at the Scripps Center for Metabolomics website http://metlin.scripps.edu/. Using the “Metlin Metabolite Search: Simple,” we searched for all positively charged ions with proton, sodium, potassium, and ammonium adducts and/or the neutral loss of one or two molecules of water. The MS spectra of the isolated metabolites gave m/z ion ratios that were within 4 ppm of the authentic standards. Concentrations of the isolated metabolite stock solutions were determined by UV absorbance, using a standard curve of tacrolimus peak areas and assuming a common extinction coefficient at 214 nm. 11, 16
LC/MS-MS Quantification of Tacrolimus and Metabolites
Tacrolimus and its metabolites in blood, plasma and urine samples were quantified by LC/MS/MS. A published extraction method41 was adapted, with the following modifications: 0.5 mL of blood, plasma, or urine was mixed with 0.5 mL 0.01 M ammonium acetate, pH 7.5, 10 μL internal standard (250 ng/mL stock) and extracted with 4 mL of methyl-t-butyl ether, using glass screw-cap tubes. Samples were shaken for 20 minutes using a horizontal shaker and centrifuged (~2000 g) at room temperature. The top organic layer was dried, then re-suspended in 0.1 mL methanol and transferred to LC vials containing silanized glass inserts. A 15 μL aliquot of each extracted sample was injected into the LC–MS/MS system. Calibration standards were constructed from serial dilutions of methanolic stock solutions added to blank human blood, plasma or urine. These and quality control samples, were spiked with internal standard and extracted, as described above. The analytical instrument consisted of an Agilent series 1200 HPLC coupled to an Agilent series 6410 triple quadruple tandem mass spectrometer. Solvent A was 20 mM ammonium acetate and 0.1 mM sodium acetate in H2O (pH 7.5), and solvent B was 100% methanol. The chromatography column and gradient conditions were the same as that used for metabolite identification, described above. The elution times for 13-DMT, 12-HT, 15-DMT, 31-DMT, internal standard, and tacrolimus, were 8.9 min, 10.2 min, 10.2 min, 10.8 min, 11.8 min, and 11.8 min, respectively. Sodium adducts of tacrolimus and metabolites were detected with multiple reaction monitoring under the ESP+ mode. The ion transition was m/z 812.2>602.4 for 13-DMT and 15-DMT, m/z 842.2>521.3 for 12-HT, m/z 812.2>616.3 for 31-DMT, m/z 830.2>620.4 for internal standard, and m/z 826.5 > 616.3 for tacrolimus.
Calibration curves for tacrolimus and its metabolites were generated by plotting the peak area ratios of tacrolimus or metabolite to internal standard against known standard tacrolimus or metabolite concentrations. Standard curve concentrations for tacrolimus ranged from: 0.005 ng/mL to 40 ng/mL. The limit of quantitation was 0.005 ng/mL for tacrolimus, and in the range of 0.003–0.04 ng/mL for 13-DMT, 15-DMT, 31-DMT and 12-HT in blood, urine and plasma samples. Intra-day and inter-day coefficients of variation for the assays were all less than 10%.
Determination of Tacrolimus Free Fraction in Plasma
Tacrolimus unbound fraction in plasma (fP) was determined using an ultracentrifugation procedure adapted from Nakai et al.42 Duplicate plasma samples at the peak and the second highest concentrations for all subjects were measured in two independent experiments. Duplicates of selected plasma samples at the trough were evaluated when quantifiable and were compared with fP determined at the peak concentrations. Plasma samples (230 μL) were centrifuged at 100,000 rpm (435,630 g) for 140 min at 37° C (Thermo Scientific S100-AT3 rotor, Sorvall micro-ultracentrifuge). Tacrolimus concentration in the supernatant after ultracentrifugation (60 μL), and in the corresponding plasma incubated for 140 min at 37° C, were analyzed by the LC-MS/MS method described above.
Pharmacokinetic Analysis
The unbound fraction in whole blood (fB) was determined from the relationship: fB = (CP/CWB) fP, where fP is the unbound fraction in plasma, CP is the plasma concentration, and CWB is the whole blood concentration.43 For each subject, a single measured value for fP was assigned at each stage of pregnancy. Steady-state pharmacokinetic parameters were estimated using standard non-compartmental techniques as described previously.22 Creatinine clearance (CrCL) was estimated as follows: CrCL = [(urine volume)(urine creatinine concentration)]/[(serum creatinine concentration)(duration of the collection interval)]. Because tacrolimus was administered orally, its clearance and volume of distribution could not be estimated independent of its oral bioavailability (F), so we report CL/F (calculated as Doseoral/AUC).
Statistical Analysis
Because this was an opportunistic study, the number of subjects participating in each stage of pregnancy varied according to their availability. Because repeated measurements on the same subject are correlated, we analyzed the data according to a mixed effect linear model using R (R Development Core Team, 2009), specifically the packages nlme and lme4 (Pinheiro & Bates, http://cran.r-project.org/web/packages/nlme/index.html; Bates & Maechler, http://CRAN.R-project.org/package=lme4). Time (early-pregnancy, mid-/late-pregnancy and postpartum) was treated as a fixed effect in the model. Paired-comparisons were performed using postpartum study visit as the reference group. When the states of pregnancy and postpartum were compared, mid- and late-pregnancy data were pooled. If a subject completed both mid- and late-pregnancy study days, values were averaged to determine pharmacokinetic parameter estimates for the individual during pregnancy. For subjects who only completed either mid- or the late-pregnancy study, the single value was used as their pregnancy datum for statistical analysis. Log transformations of data were applied when proved to be a better fit to model assumptions of normality. Linear regression analysis was conducted using GraphPad Prism version 5 (GraphPad, La Jolla, CA). Results are reported as a mean ± standard deviation (S.D.), unless otherwise indicated. A value of P < 0.05 was considered significant for all tests.
RESULTS
A total of 10 pregnant subjects (5 non-Hispanic White, 3 Hispanic, 1 non-Hispanic Black, 1 Asian), age 26.9 ± 6.2 years and height 161.4 ± 7.9 cm, participated in this study. All subjects were solid organ transplantation recipients (five kidney, one kidney/pancreas, three liver, and one heart). All recipients, except for one, had CYP3A5*3/*3 genotype. The genotypes of the donors are not known. One subject carried SNPs associated with the CYP3A5*3 and CYP3A5*6 alleles. Based on known haplotype patterns, it is likely that the CYP3A5*3 SNP and the CYP3A5*6 SNP are on different chromosomes, making this subject a complex heterozygous nonexpressor (CYP3A5*3/*6).44 Other subject characteristics are described in Table 1. Of the subjects who were studied postpartum, five were lactating and one of them was studied again 42 weeks after cessation of lactation. Because the data are limited and the pharmacokinetic parameters did not seem to differ between the lactation and post-cessation of lactation study days (data not shown), we report the means of the parameters obtained during the postpartum days for these subjects.
TABLE 1.
Characteristics of study subjects (n = 10).
| Parameter | Early Pregnancy (10–14 Weeks, n = 4) | Mid and Late Pregnancy (22–38 Weeks, n =8) | Postpartum (n = 5) |
|---|---|---|---|
| Actual body weight (kg) | 63.1 ± 15.2 (N.S.) | 73.9 ± 14.3 (P =0.0004) | 66.7 ± 16.3 |
| Creatinine clearance (mL/min) | 129.1 ± 67.5 (N.S.) | 115.2 ± 54.3 (N.S.) | 129.8 ± 52.2 |
| Serum creatinine (mg/dL) | 0.8 ± 0.6 (N.S.) | 0.9 ± 0.4 (N.S.) | 0.9 ± 0.4 |
| Serum albumin concentration (g/dL) | 3.3 ± 0.2 (N.S.) | 2.7 ± 0.3 (P = 0.001) | 3.7 ± 0.3 |
| Hematocrit (%) | 27.3 ± 4.5 (P =0.04) | 29.0 ± 3.5 (N.S.) | 33.2 ± 4.1 |
| Red blood cell count (million/μL) | 3.4 ± 0.5 (N.S.) | 3.3 ± 0.4 (P = 0.02) | 4.0 ± 0.4 |
| Median tacrolimus dose (mg/day) | 6.8 | 8.6 | 6 |
| Mean tacrolimus dose (mg/day) | 6.9 ± 2.5 (N.S.) | 8.1 ± 3.1 (P < 0.02) | 5.6 ± 1.8 |
| Median dosing interval (h) | 8 | 8 | 12 |
| Mean dosing interval (h) | 10.0 ± 2.3 (N.S.) | 10.5 ± 2.1 (N.S.) | 12.0 ± 0.0 |
P values: comparisons between early and the postpartum study days or mid/late pregnancy and the postpartum study days. N.S., not significant. Results are expressed as means ± standard deviation.
The values from one subject in early pregnancy were not included in the calculation of creatinine clearance and serum creatinine because of her rejection after kidney transplant.
Tacrolimus whole blood concentration-time profiles during early- and mid-/late-pregnancy and postpartum in women treated with the immunosuppressant every 12 hours are shown in Figure 1. The estimated tacrolimus pharmacokinetic parameters during pregnancy and postpartum are reported in Table 2. With clinical dosage adjustments, the mean whole blood tacrolimus Cmax and Ctrough were comparable throughout gestation and postpartum (Figure 1A). The mean tacrolimus CL/F based on whole blood concentration was higher by 39% during mid/late pregnancy compared to postpartum (47.4 ± 12.6 L/h vs. 34.2 ± 14.8 L/h, P < 0.03) (Table 2 and Figure 2A). Moreover, the AUC of unbound tacrolimus in blood was 2.7 times higher during mid/late pregnancy than postpartum (0.44 ± 0.19 ng·h/mL vs. 0.16 ± 0.06 ng·h/mL, P = 0.03, Figure 1C). In addition, the unbound tacrolimus trough concentration in blood was on average 112% higher during mid-/late-pregnancy than postpartum (0.018 ± 0.010 ng/mL vs. 0.009 ± 0.003 ng/mL, P = 0.02). No statistically significant difference was evident in unbound CL/F when comparing pregnancy to postpartum (Table 2 and Figure 2B). In addition, there was no apparent change in the formation clearance of tacrolimus’ four primary metabolites as inferred from the lack of any trend for changes in metabolite/parent AUC ratios across pregnancy periods and postpartum.
FIGURE 1.

Tacrolimus blood concentration-time profiles during early- and mid-/late-pregnancy as well as > 3 months postpartum in women treated with tacrolimus every 12 hours (A); and dose-normalized (to 1 mg over 12 hours) tacrolimus blood concentration-time curves (B), and unbound tacrolimus blood concentration-time profile (C). Individual data points on all graphs represent the mean ± SD from study subjects when n > 2. The mean data were presented when n = 2. Only data from subjects with a 12-hour dosing interval were included. The unbound concentration is not available for one subject in late pregnancy due to hemolyzed plasma collections.
TABLE 2.
Estimated steady-state, whole blood and plasma tacrolimus pharmacokinetic parameters during pregnancy and postpartum
| Parameter | Early Pregnancy (10–14 Weeks, n = 4) | Mid and Late Pregnancy (22–38 Weeks, n =8) | Postpartum (n = 5) |
|---|---|---|---|
| Whole blood PK Parameters | |||
| Unbound fraction in whole blood (fB) | 0.19 ± 0.04% (N.S.) | 0.38 ± 0.13% (P = 0.002) | 0.19 ± 0.07% |
| Oral clearance (L/h) | 36.3 ± 11.9 (N.S.) | 47.4 ± 12.6 (P = 0.03) | 34.2 ± 14.8 |
| Unbound oral clearance (L/h/fB) | 19990 ± 9563 (N.S.) | 13470 ± 2617 (N.S.) | 18133 ± 4392 |
|
| |||
| Plasma PK parameters | |||
| Unbound fraction in plasma (fP) | 3.4 ± 0.7% (N.S.) | 5.4 ± 0.7% (P = 0.0007) | 2.8 ± 0.4% |
| Oral clearance (L/h) | 632.8 ± 249.5 (N.S.) | 630.5 ± 194.8 (N.S.) | 494.3 ± 103.3 |
| Unbound oral clearance (L/h/fP) | 19160 ± 9414 (N.S.) | 11700 ± 2760 (P = 0.03) | 17718 ± 4914 |
P values: comparisons between early and the postpartum study days or mid/late pregnancy and the postpartum study days. N.S., not significant. Results are expressed as means ± standard deviation.
FIGURE 2.


Tacrolimus oral clearance (A) and unbound oral clearance (B) based on AUCblood for subjects during pregnancy (n = 10) and postpartum (n = 5).
On average, there was a 91% increase in the tacrolimus percent unbound in plasma (fP) during mid- and late-pregnancy compared to postpartum (5.4 ± 0.7% vs. 2.8 ± 0.4%, P = 0.0007) (Figure 3A). The average percent unbound in plasma did not differ significantly between the peak and trough samples, consistent with previous report that the fraction unbound of tacrolimus in plasma was independent of the concentration in the range of 0.065–10.5 ng/mL.45 The calculated tacrolimus percent unbound in blood (fB) during mid- and late-pregnancy was, on average, 100% higher than that for the postpartum period (0.4 ± 0.1% vs. 0.2 ± 0.1%, P = 0.002) (Figure 3B). A good correlation was found between the CL/F and the percent unbound in plasma (r = 0.6, P = 0.007) and in blood (r = 0.7, P = 0.001) (Figure 3C and 3D).
FIGURE 3.


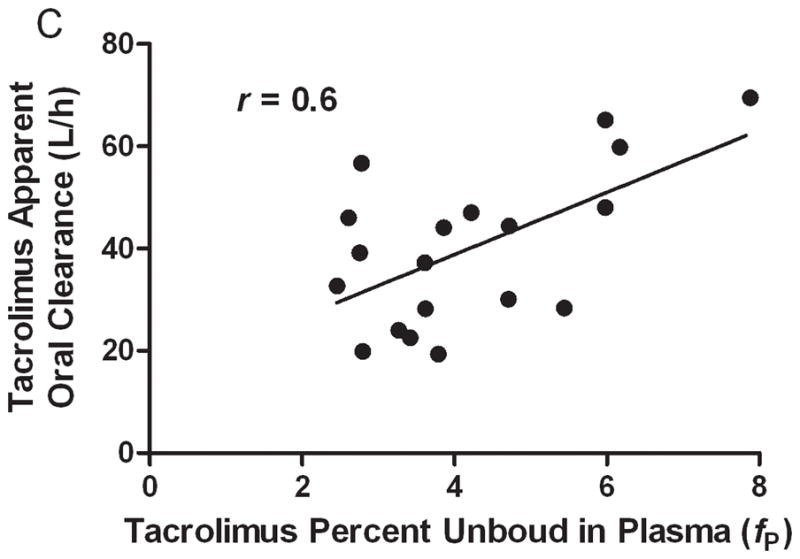

Tacrolimus percent unbound in plasma (A) and blood (B). The correlation between tacrolimus free fraction in plasma and oral clearance (C) and the correlation between free fraction in blood and tacrolimus oral clearance. The free fraction of tacrolimus could not be determined for one subject because of hemolyzed plasma samples.
We observed the expected significant decrement in serum albumin, red blood cell count, and hematocrit during pregnancy (Table 1, fFigures 4A and 5A). An inverse correlation was observed between P and the serum albumin concentrations (r = − 0.7, P = 0.003, Figure 4B). The mean tacrolimus blood/plasma concentration ratio (15.9 ± 4.2) increased with increasing red blood cell counts (r = 0.6, P = 0.02, Figure 5B). Tacrolimus CL/F was inversely correlated with red blood cell counts (r = − 0.7, P = 0.002, Figure 5C). Tacrolimus CL/F tended to be inversely correlated with hematocrit (%) (r = − 0.4, P = 0.09), but this did not reach significance. When individual patient data were examined, the blood-to-plasma tacrolimus concentration ratio did not differ significantly between peak and trough times (data not shown), nor did it vary from pregnancy to postpartum. However, when data from all the subjects were pooled, the blood-to-plasma tacrolimus concentration ratio appeared to be somewhat higher at plasma concentrations below 0.5 ng/mL (Figure 6).
FIGURE 4.


Serum albumin concentrations during early- (n = 4) and mid-/late-pregnancy (n = 8) as well as postpartum (n = 5) (A) and correlation between serum albumin concentrations and tacrolimus percent unbound in plasma during pregnancy and postpartum (B) in 10 solid organ transplantation recipients.
FIGURE 5.


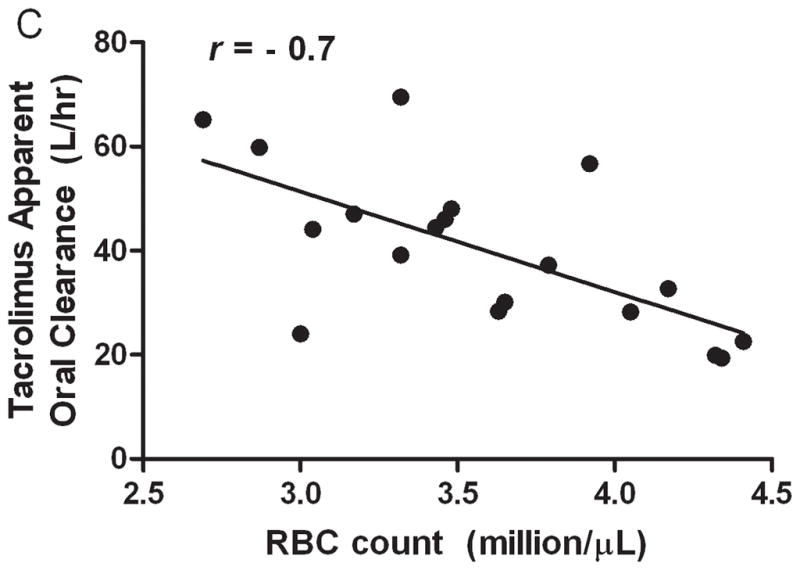
Hematocrit during early- (n = 4) and mid-/late-pregnancy (n = 8) as well as postpartum (n = 5) (A) and correlation between red blood cell counts and mean tacrolimus blood/plasma concentration ratio (B). Correlation between red blood cell counts and tacrolimus oral clearance (C) during pregnancy and postpartum in 10 solid organ transplantation recipients.
FIGURE 6.

The blood to plasma tacrolimus concentration ratio versus plasma concentration in solid organ transplantation recipients during pregnancy. All measured plasma concentrations were pooled and plotted against the respective blood to plasma concentration ratio.
DISCUSSION
Despite the increasing number of women being prescribed tacrolimus for immunosuppression during pregnancy, data describing the effects of pregnancy on tacrolimus disposition are scarce. Our study characterized tacrolimus pharmacokinetics during pregnancy and demonstrated that physiological changes occurring during pregnancy indeed alter tacrolimus PK. Our major findings suggest that pregnancy can result in lower whole blood tacrolimus concentrations but no significant change in unbound concentrations if no adjustment in dosage is made. In the clinical setting, although approaches differ, some providers routinely adjust the tacrolimus dosage during pregnancy to maintain target whole blood trough concentrations,46, 47 without considering possible changes in unbound tacrolimus, since these are not measured in clinical practice. Challenges in measuring unbound tacrolimus concentrations include avoiding plastics in all procedures due to extensive binding of tacrolimus to plastics, separating plasma and plasma water at 37° C due to temperature dependent binding and using a highly sensitive and specific assay to detect the extremely low concentrations of the unbound drug. As observed in our study, this approach results in approximate doubling of the unbound tacrolimus trough concentrations. The mechanisms by which tacrolimus pharmacokinetic are changed during pregnancy are rather complex.
Judging by whole blood clearance estimates, tacrolimus is considered a low-clearance drug (clearance equivalent to ~3% of liver blood flow).48 Classic pharmacokinetic models predict that for drugs eliminated exclusively by metabolism in the liver their apparent clearance following oral administration (i.e., CL/F) should be governed by the intrinsic hepatic clearance of unbound drug and unbound fraction of drug in blood, and independent of hepatic blood flow.49, 50 However, these predictions do not account for intestinal metabolism, and/or the possibility of slow equilibration of drug between plasma and erythrocytes.
We found that the mean tacrolimus CL/F increased by 39% during mid-/late-pregnancy compared to postpartum, which could not be explained by known factors such as drug interactions. Postpartum values were comparable to those previously reported in non-pregnant subjects (21–38 L/h).51–54 Previous investigations with midazolam, dextromethorphan and nelfinavir have suggested that intrinsic hepatic/intestinal CYP3A activity may be increased by 25% to 100% during pregnancy.22–25 Contrary to expectations, the estimated unbound oral clearance of tacrolimus (CL/F/fB) did not change in pregnancy. There are several possible explanations for this discrepancy. First, the inference of intrinsic hepatic clearance from oral clearance of unbound drug relies on the assumption that equilibrium in plasma protein binding and erythrocyte-to-plasma partitioning is maintained at all times. Plasma protein binding and erythrocyte distribution can restrict drug extraction from the blood by an organ.55 For tacrolimus, blood-to-plasma equilibration is reported to be slow;36, 56 thus, equilibrium may not be fully reached in the time it takes for blood to pass through the liver. Therefore, it is possible that the effective exchangeable fraction in blood may be different than what is indicated by our in vitro equilibrium experiments. Furthermore, the discrepancy between in vivo exchangeable fraction and in vitro equilibrium fraction may differ between pregnancy and postpartum. Given the complex binding behavior of tacrolimus in vivo, the apparent lack of change in the unbound oral clearance based on in vitro equilibrium measurements may belie a fundamental difference in the intrinsic hepatic clearance between pregnancy and postpartum.
Second, it is possible that an increase in the oral bioavailability of tacrolimus may have occurred during pregnancy. An increase in oral bioavailability could result from an increase in the absorption of tacrolimus from the gastrointestinal tract, and/or a decrease in the metabolism of tacrolimus by CYP3A in the intestinal mucosa. Intestinal metabolism is a significant part of tacrolimus first pass in rats, with over 30% of the absorbed tacrolimus dose metabolized in the small intestine.57 In humans, intestinal metabolism has been shown to play a significant role in the first pass of cyclosporine, a calcineurin inhibitor with a similar metabolic fate as tacrolimus.58 Drug interaction studies have demonstrated that tacrolimus first pass metabolism can be either inhibited or induced.11, 18, 19 Co-administration of ketoconazole, a potent CYP3A inhibitor, increased the oral bioavailability of tacrolimus by 47% in kidney transplant recipients18 or 114% in healthy volunteers (14% vs. 30%).19 In addition, co-administration of rifampin significantly decreased tacrolimus bioavailability (14.4% vs. 7.0%), most likely through induction of CYP3A and/or P-glycoprotein in the small intestine.20 In both of the above described tacrolimus interaction studies in healthy volunteers, the available fraction across the liver (Fhepatic) was estimated apart from the fraction of the oral dose absorbed and available fraction across the gut (Fabs x Fgut). The changes seen in both of these drug interaction studies suggest that the largest effects occurred in the intestine. In the present context, a reduction in gut extraction and increased systemic availability would have to occur in pregnancy to offset the presumed CYP3A-related increase in intrinsic hepatic clearance, with the end result of no net change in the CL/F of unbound tacrolimus. There is currently no evidence supporting the hypotheses of an increase in oral absorption or reduced intestinal CYP3A-medaited first-pass metabolism of tacrolimus during pregnancy.
Intestinal P-gp activity appears to affect the oral bioavailability of tacrolimus in mice,26 rats,59 and perhaps in human.18, 19 Research conducted in pregnant mice60 and non-human primates61 showed that there was no change in P-gp protein expression or activity in the liver or kidneys during gestation. In contrast, renal P-gp activity is elevated during pregnancy in humans.22 The regulation of human intestinal P-gp during pregnancy has not been investigated. If the activity of intestinal P-pg in pregnancy were to follow that in the kidneys, a decrease rather than an increase in absorption is expected.
Changes in unbound drug in blood appear to be the main driver in the pharmacokinetic changes seen with tacrolimus during pregnancy. Tacrolimus percent unbound in plasma was nearly two-fold higher during mid- and late-pregnancy compared to postpartum (5.4 ± 0.7% vs. 2.8 ± 0.4%, P =0.0007). For comparison, in healthy male and female subjects, fP was found to be 2.1 ± 0.8% using the same ultracentrifugation method (Zheng et al., Clinical Pharmacology and Therapeutics ). Also, mean fP values of 3.7 ± 0.8% have been reported previously using equilibrium gel filtration,31 and 1.20 ± 0.12% using equilibrium dialysis.45 We found a significant correlation between CL/F of tacrolimus based on whole blood concentration and the percent unbound in plasma (r = 0.6, P = 0.007) and in blood (r = 0.7, P = 0.001). This strongly suggests an increased delivery of tacrolimus to intra-hepatic CYP3A during pregnancy that resulted in enhanced hepatic extraction and systemic clearance and reduced mean oral AUC.
Although it was previously suggested that plasma albumin concentration was not an important factor in tacrolimus distribution,30 unbound fraction in plasma was inversely correlated with the decrease in serum albumin levels during pregnancy (r = − 0.7, P = 0.003). This is consistent with results from a study of non-pregnant liver transplantation recipients receiving tacrolimus who were randomized post-transplantation to 2 weeks of human serum albumin infusion or an artificial plasma expander. The authors suggested that the unbound fraction of tacrolimus in the artificial plasma expander group may be greater.62 Similarly, in a study with kidney transplant patients, an inverse correlation was found between the Dose (mg/kg)/Cmin ratio and albumin concentration (r = − 0.74, P < 0.05),63 indicating that changing albumin concentrations could affect the clearance of tacrolimus. It is likely that both the reduction in albumin and α1-acid glycoprotein (AAG) concentrations caused the increase in tacrolimus plasma unbound fraction during pregnancy. Weiss et al. reported that AAG contributed substantially to the binding of tacrolimus in plasma.31 There is also the finding that in liver transplantation recipients the unbound fraction of tacrolimus in plasma is inversely correlated with α1-acid glycoprotein (r2 = 0.50) as well as HDL cholesterol levels (HDL = high density lipoproteins) (r2 = 0.55).33 In pregnancy, both albumin and AAG concentrations decreased significantly.29
The calculated tacrolimus percent unbound in blood during mid-/late-pregnancy was much higher than postpartum (0.4 ± 0.1% vs. 0.2 ± 0.1%, P = 0.002) reflecting the fact that the change in fB was mainly driven by the change in fp. However, in pregnancy, red blood cell count and hematocrit also decrease as a result of volume expansion, which results in the relatively greater increase in plasma volume than red cell mass.32 Strong binding of tacrolimus to erythrocytes prevents it from concentrating in plasma despite its affinity for plasma proteins.35 Although the blood-to-plasma tacrolimus concentration ratio in our study did not vary significantly from peak to trough times, nor from pregnancy to postpartum for an individual patient, an analysis of pooled data in this study and the literature33, 34, 36 suggests concentration-dependent sequestration by erythrocytes. In our analysis, the blood-to-plasma tacrolimus concentration ratio was found to vary between 35.2 and 7.6 over a plasma concentration range of 0.14 to 2.52 ng/mL. Moreover, the lower red blood cell counts during pregnancy were associated with lower tacrolimus blood-to-plasma concentration ratio (r = 0.6, P < 0.02, Figure 5B). This is consistent with previous work demonstrating a positive correlation between erythrocyte-associated fraction of tacrolimus and hematocrit (r2 = 0.47) or red blood cell count (r2 = 0.49),33 an inverse correlation between the Dose (mg/kg per day)/Cmin ratio and hematocrit (r = −0.81) over the first 12 weeks post-kidney transplantation;63 and likewise between Dose/CWB and hematocrit in living donor liver transplantation (r = −0.53; P < 0.001).43 In our study, we found that tacrolimus CL/F was inversely correlated to red blood cell count (r = − 0.7, P = 0.002). Moreover, the calculated unbound tacrolimus trough concentrations in blood were on average 112% higher during mid-/late-pregnancy than postpartum. Similarly, the AUC of free drug in blood during mid-/late-pregnancy was 2.7-fold higher than that seen postpartum. This could potentially impact both immunosuppressant efficacy and adverse response to tacrolimus. Accordingly, the relationship between drug response and tacrolimus concentrations (total and free) need to be investigated during pregnancy before an informed decision on dose adjustment can be made. Future studies that characterize lymphocytic P-gp activity, intra-lymphocyte tacrolimus concentrations and quantification of IL-2 production during pregnancy should provide insight towards the impact of increased tacrolimus unbound fraction on the distribution and immunosuppressive effects of tacrolimus during pregnancy.
CONCLUSIONS
Gestational increases in whole blood apparent oral clearance, most likely caused by an increase in the unbound fraction of tacrolimus, sometimes leads to increased tacrolimus dosages in response to observed decrements in its trough concentration. Lower albumin concentrations in pregnancy contribute to an increased plasma tacrolimus free fraction. The normal reduction in red blood cell count also has an effect on the unbound fraction in blood, which, together with lower plasma protein binding, explains much of the variance in oral tacrolimus pharmacokinetics during pregnancy and postpartum. As a result of dosage titration to maintain a target whole blood trough concentrations during gestation and postpartum, unbound tacrolimus concentrations are increased by nearly two-fold, which may have important clinical implications.
Acknowledgments
The project described was supported by grants numbers U10HD047892 and U10HD047890 from the Eunice Kennedy Shriver National Institute of Child Health & Human Development, UL1RR025014, and UL1RR031975 from National Center for Research Resources and R01 GM068871 National Institute of General Medical Sciences. The content is solely the responsibility of the authors and does not necessarily represent the official views of the Eunice Kennedy Shriver National Institute of Child Health & Human Development or the National Institutes of Health
The authors thank Claudine Hernandez, Susan McKay and Kristin Puhl from the University of Washington Department of Pharmacy for coordinating the studies. The authors also thank Dr. Edward Kelly from the DNA Sequencing and Gene Analysis Center at University of Washington School of Pharmacy for his assistance with CYP3A5 genotyping and Dr. David K. Blough from the University of Washington Department of Pharmacy for the statistical assistance. The authors appreciate the generosity of Dr. Uwe Christians in providing tacrolimus’ primary metabolites for verification purposes and thank Taurence Senn for assisting with the verification of tacrolimus metabolite identities by Q-TOF.
Abbreviations
- LC-MS/MS
liquid chromatography-mass spectrometry/mass spectrometry
- fB
unbound fraction of tacrolimus in whole blood
- fP
unbound fraction of tacrolimus in plasma
- CP
tacrolimus plasma concentration
- CWB
tacrolimus whole blood concentration
- F
systemic bioavailability
- CL/F
oral clearance of tacrolimus
- AUC
area under the concentration–time curve
- Cmax
maximum blood concentration
- Ctrough
blood concentration at the end of each dosing interval
- CLr
tacrolimus renal clearance
- CrCL
renal creatinine clearance
- GFR
glomerular filtration rate
- CYP3A4
cytochrome P450 3A4
- CYP3A5
cytochrome P450 3A5
- P-gp
P-glycoprotein
- AAG
α1-acid glycoprotein
- HDL
high density lipoproteins
- IL-2
Interleukin-2
Footnotes
The authors declare no conflicts of interest.
References
- 1.Scott LJ, McKeage K, Keam SJ, et al. Tacrolimus: a further update of its use in the management of organ transplantation. Drugs. 2003;63(12):1247–97. doi: 10.2165/00003495-200363120-00006. [DOI] [PubMed] [Google Scholar]
- 2.McKay DB, Josephson MA. Pregnancy in recipients of solid organs--effects on mother andchild. N Engl J Med. 2006;354(12):1281–93. doi: 10.1056/NEJMra050431. [DOI] [PubMed] [Google Scholar]
- 3.Coscia LA, Constantinescu S, Moritz MJ, et al. Report from the National Transplantation Pregnancy Registry (NTPR): outcomes of pregnancy after transplantation. Clin Transpl. 2010:65–85. [PubMed] [Google Scholar]
- 4.Jusko WJ, Thomson AW, Fung J, et al. Consensus document: therapeutic monitoring of tacrolimus (FK-506) Ther Drug Monit. 1995;17(6):606–14. doi: 10.1097/00007691-199512000-00011. [DOI] [PubMed] [Google Scholar]
- 5.Machida M, Takahara S, Ishibashi M, et al. Effect of temperature and hematocrit on plasma concentration of FK 506. Transplant Proc. 1991;23(6):2753–4. [PubMed] [Google Scholar]
- 6.Akbas SH, Ozdem S, Caglar S, et al. Effects of some hematological parameters on whole blood tacrolimus concentration measured by two immunoassay-based analytical methods. Clin Biochem. 2005;38(6):552–7. doi: 10.1016/j.clinbiochem.2005.02.011. [DOI] [PubMed] [Google Scholar]
- 7.Undre NA, Stevenson P, Schafer A. Pharmacokinetics of tacrolimus: clinically relevant aspects. Transplant Proc. 1999;31(7A):21S–24S. doi: 10.1016/s0041-1345(99)00788-5. [DOI] [PubMed] [Google Scholar]
- 8.Undre NA, van Hooff J, Christiaans M, et al. Low systemic exposure to tacrolimus correlates with acute rejection. Transplant Proc. 1999;31(1–2):296–8. doi: 10.1016/s0041-1345(98)01633-9. [DOI] [PubMed] [Google Scholar]
- 9.Undre NA. Pharmacokinetics of tacrolimus-based combination therapies. Nephrol Dial Transplant. 2003;18 (Suppl 1):i12–5. doi: 10.1093/ndt/gfg1029. [DOI] [PubMed] [Google Scholar]
- 10.Sattler M, Guengerich FP, Yun CH, et al. Cytochrome P-450 3A enzymes are responsible for biotransformation of FK506 and rapamycin in man and rat. Drug Metab Dispos. 1992;20(5):753–61. [PubMed] [Google Scholar]
- 11.Lampen A, Christians U, Guengerich FP, et al. Metabolism of the immunosuppressant tacrolimus in the small intestine: cytochrome P450, drug interactions, and interindividual variability. Drug Metab Dispos. 1995;23(12):1315–24. [PubMed] [Google Scholar]
- 12.Lin YS, Dowling AL, Quigley SD, et al. Co-regulation of CYP3A4 and CYP3A5 and contribution to hepatic and intestinal midazolam metabolism. Mol Pharmacol. 2002;62(1):162–72. doi: 10.1124/mol.62.1.162. [DOI] [PubMed] [Google Scholar]
- 13.Kuehl P, Zhang J, Lin Y, et al. Sequence diversity in CYP3A promoters and characterization of the genetic basis of polymorphic CYP3A5 expression. Nat Genet. 2001;27(4):383–91. doi: 10.1038/86882. [DOI] [PubMed] [Google Scholar]
- 14.Haehner BD, Gorski JC, Vandenbranden M, et al. Bimodal distribution of renal cytochrome P450 3A activity in humans. Mol Pharmacol. 1996;50(1):52–9. [PubMed] [Google Scholar]
- 15.Givens RC, Lin YS, Dowling AL, et al. CYP3A5 genotype predicts renal CYP3A activity and blood pressure in healthy adults. J Appl Physiol. 2003;95(3):1297–300. doi: 10.1152/japplphysiol.00322.2003. [DOI] [PubMed] [Google Scholar]
- 16.Dai Y, Hebert MF, Isoherranen N, et al. Effect of CYP3A5 polymorphism on tacrolimus metabolic clearance in vitro. Drug Metab Dispos. 2006;34(5):836–47. doi: 10.1124/dmd.105.008680. [DOI] [PubMed] [Google Scholar]
- 17.Staatz CE, Goodman LK, Tett SE. Effect of CYP3A and ABCB1 single nucleotide polymorphisms on the pharmacokinetics and pharmacodynamics of calcineurin inhibitors: Part II. Clin Pharmacokinet. 2010;49(4):207–21. doi: 10.2165/11317550-000000000-00000. [DOI] [PubMed] [Google Scholar]
- 18.Tuteja S, Alloway RR, Johnson JA, et al. The effect of gut metabolism on tacrolimus bioavailability in renal transplant recipients. Transplantation. 2001;71(9):1303–7. doi: 10.1097/00007890-200105150-00021. [DOI] [PubMed] [Google Scholar]
- 19.Floren LC, Bekersky I, Benet LZ, et al. Tacrolimus oral bioavailability doubles with coadministration of ketoconazole. Clin Pharmacol Ther. 1997;62(1):41–9. doi: 10.1016/S0009-9236(97)90150-8. [DOI] [PubMed] [Google Scholar]
- 20.Hebert MF, Fisher RM, Marsh CL, et al. Effects of rifampin on tacrolimus pharmacokinetics in healthy volunteers. J Clin Pharmacol. 1999;39(1):91–6. doi: 10.1177/00912709922007499. [DOI] [PubMed] [Google Scholar]
- 21.Fuchs KM, Coustan DR. Immunosuppressant therapy in pregnant organ transplant recipients. Semin Perinatol. 2007;31(6):363–71. doi: 10.1053/j.semperi.2007.09.006. [DOI] [PubMed] [Google Scholar]
- 22.Hebert MF, Easterling TR, Kirby B, et al. Effects of pregnancy on CYP3A and P-glycoprotein activities asmeasured by disposition of midazolam and digoxin: a University of Washington specialized center of research study. Clin Pharmacol Ther. 2008;84(2):248–53. doi: 10.1038/clpt.2008.1. [DOI] [PubMed] [Google Scholar]
- 23.Tracy TS, Venkataramanan R, Glover DD, et al. Temporal changes in drug metabolism (CYP1A2, CYP2D6 and CYP3A Activity) during pregnancy. Am J Obstet Gynecol. 2005;192(2):633–9. doi: 10.1016/j.ajog.2004.08.030. [DOI] [PubMed] [Google Scholar]
- 24.Hirt D, Treluyer JM, Jullien V, et al. Pregnancy-related effects on nelfinavir-M8 pharmacokinetics: a population study with 133 women. Antimicrob Agents Chemother. 2006;50(6):2079–86. doi: 10.1128/AAC.01596-05. [DOI] [PMC free article] [PubMed] [Google Scholar]
- 25.Villani P, Floridia M, Pirillo MF, et al. Pharmacokinetics of nelfinavir in HIV-1-infected pregnant and nonpregnant women. Br J Clin Pharmacol. 2006;62(3):309–15. doi: 10.1111/j.1365-2125.2006.02669.x. [DOI] [PMC free article] [PubMed] [Google Scholar]
- 26.Yokogawa K, Takahashi M, Tamai I, et al. P-glycoprotein-dependent disposition kinetics of tacrolimus: studies in mdr1a knockout mice. Pharm Res. 1999;16(8):1213–8. doi: 10.1023/a:1018993312773. [DOI] [PubMed] [Google Scholar]
- 27.Saeki T, Ueda K, Tanigawara Y, et al. Human P-glycoprotein transports cyclosporin A and FK506. J Biol Chem. 1993;268(9):6077–80. [PubMed] [Google Scholar]
- 28.Chaudhary PM, Mechetner EB, Roninson IB. Expression and activity of the multidrug resistance P-glycoprotein in human peripheral blood lymphocytes. Blood. 1992;80(11):2735–9. [PubMed] [Google Scholar]
- 29.Feghali MN, Mattison DR. Clinical therapeutics in pregnancy. J Biomed Biotechnol. 2011;2011:783528. doi: 10.1155/2011/783528. [DOI] [PMC free article] [PubMed] [Google Scholar]
- 30.Piekoszewski W, Jusko WJ. Plasma protein binding of tacrolimus in humans. J Pharm Sci. 1993;82(3):340–1. doi: 10.1002/jps.2600820325. [DOI] [PubMed] [Google Scholar]
- 31.Weiss HM, Fresneau M, Moenius T, et al. Binding of pimecrolimus and tacrolimus to skin and plasma proteins: implications for systemic exposure after topical application. Drug Metab Dispos. 2008;36(9):1812–8. doi: 10.1124/dmd.108.021915. [DOI] [PubMed] [Google Scholar]
- 32.Hytten F. Blood volume changes in normal pregnancy. Clin Haematol. 1985;14(3):601–12. [PubMed] [Google Scholar]
- 33.Zahir H, McCaughan G, Gleeson M, et al. Factors affecting variability in distribution of tacrolimus in liver transplant recipients. Br J Clin Pharmacol. 2004;57(3):298–309. doi: 10.1046/j.1365-2125.2003.02008.x. [DOI] [PMC free article] [PubMed] [Google Scholar]
- 34.Jusko WJ, Piekoszewski W, Klintmalm GB, et al. Pharmacokinetics of tacrolimus in liver transplant patients. Clin Pharmacol Ther. 1995;57(3):281–90. doi: 10.1016/0009-9236(95)90153-1. [DOI] [PubMed] [Google Scholar]
- 35.Piekoszewski W, Chow FS, Jusko WJ. Disposition of tacrolimus (FK 506) in rabbits. Role of red blood cell binding in hepatic clearance. Drug Metab Dispos. 1993;21(4):690–8. [PubMed] [Google Scholar]
- 36.Chow FS, Piekoszewski W, Jusko WJ. Effect of hematocrit and albumin concentration on hepatic clearance of tacrolimus (FK506) during rabbit liver perfusion. Drug Metab Dispos. 1997;25(5):610–6. [PubMed] [Google Scholar]
- 37.Midtvedt K, Hartmann A, Brekke IB, et al. Successful pregnancies in a combined pancreas and renal allograft recipient and in a renal graft recipient on tacrolimus treatment. Nephrol Dial Transplant. 1997;12(12):2764–5. doi: 10.1093/ndt/12.12.2764. [DOI] [PubMed] [Google Scholar]
- 38.French AE, Soldin SJ, Soldin OP, et al. Milk transfer and neonatal safety of tacrolimus. Ann Pharmacother. 2003;37(6):815–8. doi: 10.1345/aph.1C312. [DOI] [PMC free article] [PubMed] [Google Scholar]
- 39.Fehrman-Ekholm I, Nisell H. A successful pregnancy in a kidney recipient with tacrolimus (Prograf, FK 506) therapy. Nephrol Dial Transplant. 1998;13(11):2982–3. doi: 10.1093/oxfordjournals.ndt.a027806. [DOI] [PubMed] [Google Scholar]
- 40.Christians U, Radeke HH, Kownatzki R, et al. Isolation of an immunosuppressive metabolite of FK506 generated by human microsome preparations. Clin Biochem. 1991;24(3):271–5. doi: 10.1016/0009-9120(91)80019-y. [DOI] [PubMed] [Google Scholar]
- 41.Chen YL, Hirabayashi H, Akhtar S, et al. Simultaneous determination of three isomeric metabolites of tacrolimus (FK506) in human whole blood and plasma using high performance liquid chromatography-tandem mass spectrometry. J Chromatogr B Analyt Technol Biomed Life Sci. 2006;830(2):330–41. doi: 10.1016/j.jchromb.2005.11.010. [DOI] [PubMed] [Google Scholar]
- 42.Nakai D, Kumamoto K, Sakikawa C, et al. Evaluation of the protein binding ratio of drugs by a micro-scale ultracentrifugation method. J Pharm Sci. 2004;93(4):847–54. doi: 10.1002/jps.20012. [DOI] [PubMed] [Google Scholar]
- 43.Minematsu T, Sugiyama E, Kusama M, et al. Effect of hematocrit on pharmacokinetics of tacrolimus in adult living donor liver transplant recipients. Transplant Proc. 2004;36(5):1506–11. doi: 10.1016/j.transproceed.2004.04.097. [DOI] [PubMed] [Google Scholar]
- 44.Thompson EE, Kuttab-Boulos H, Yang L, et al. Sequence diversity and haplotype structure at the human CYP3A cluster. Pharmacogenomics Journal. 2006;6(2):105–114. doi: 10.1038/sj.tpj.6500347. [DOI] [PubMed] [Google Scholar]
- 45.Zahir H, Nand RA, Brown KF, et al. Validation of methods to study the distribution and protein binding of tacrolimus in human blood. J Pharmacol Toxicol Methods. 2001;46(1):27–35. doi: 10.1016/s1056-8719(02)00158-2. [DOI] [PubMed] [Google Scholar]
- 46.Garcia-Donaire JA, Acevedo M, Gutierrez MJ, et al. Tacrolimus as basic immunosuppression in pregnancy after renal transplantation. A single-center experience. Transplant Proc. 2005;37(9):3754–5. doi: 10.1016/j.transproceed.2005.09.124. [DOI] [PubMed] [Google Scholar]
- 47.Kainz A, Harabacz I, Cowlrick IS, et al. Analysis of 100 pregnancy outcomes in women treated systemically with tacrolimus. Transpl Int. 2000;13 (Suppl 1):S299–300. doi: 10.1007/s001470050347. [DOI] [PubMed] [Google Scholar]
- 48.Moller A, Iwasaki K, Kawamura A, et al. The disposition of 14C-labeled tacrolimus after intravenous and oral administration in healthy human subjects. Drug Metab Dispos. 1999;27(6):633–6. [PubMed] [Google Scholar]
- 49.Benet LZ, Zia-Amirhosseini P. Basic principles of pharmacokinetics. Toxicol Pathol. 1995;23(2):115–23. doi: 10.1177/019262339502300203. [DOI] [PubMed] [Google Scholar]
- 50.Wilkinson GR. Clearance approaches in pharmacology. Pharmacol Rev. 1987;39(1):1–47. [PubMed] [Google Scholar]
- 51.Staatz CE, Willis C, Taylor PJ, et al. Population pharmacokinetics of tacrolimus in adult kidney transplant recipients. Clin Pharmacol Ther. 2002;72(6):660–9. doi: 10.1067/mcp.2002.129304. [DOI] [PubMed] [Google Scholar]
- 52.Staatz CE, Willis C, Taylor PJ, et al. Toward better outcomes with tacrolimus therapy: population pharmacokinetics and individualized dosage prediction in adult liver transplantation. Liver Transpl. 2003;9(2):130–7. doi: 10.1053/jlts.2003.50023. [DOI] [PubMed] [Google Scholar]
- 53.Tada H, Tsuchiya N, Satoh S, et al. Impact of CYP3A5 and MDR1(ABCB1) C3435T polymorphisms on the pharmacokinetics of tacrolimus in renal transplant recipients. Transplant Proc. 2005;37(4):1730–2. doi: 10.1016/j.transproceed.2005.02.073. [DOI] [PubMed] [Google Scholar]
- 54.Passey C, Birnbaum AK, Brundage RC, et al. Dosing Equation for Tacrolimus Using Genetic Variants and Clinical Factors. Br J Clin Pharmacol. 2011 doi: 10.1111/j.1365-2125.2011.04039.x. [DOI] [PMC free article] [PubMed] [Google Scholar]
- 55.Shen DD, Kunze KL, Thummel KE. Enzyme-catalyzed processes of first-pass hepatic and intestinal drug extraction. Adv Drug Deliv Rev. 1997;27(2–3):99–127. doi: 10.1016/s0169-409x(97)00039-2. [DOI] [PubMed] [Google Scholar]
- 56.Beysens AJ, Wijnen RM, Beuman GH, et al. FK 506: monitoring in plasma or in whole blood? Transplant Proc. 1991;23(6):2745–7. [PubMed] [Google Scholar]
- 57.Hashimoto Y, Sasa H, Shimomura M, et al. Effects of intestinal and hepatic metabolism on the bioavailability of tacrolimus in rats. Pharm Res. 1998;15(10):1609–13. doi: 10.1023/a:1011967519752. [DOI] [PubMed] [Google Scholar]
- 58.Kolars JC, Awni WM, Merion RM, et al. First-pass metabolism of cyclosporin by the gut. Lancet. 1991;338(8781):1488–90. doi: 10.1016/0140-6736(91)92302-i. [DOI] [PubMed] [Google Scholar]
- 59.Arima H, Yunomae K, Hirayama F, et al. Contribution of P-glycoprotein to the enhancing effects of dimethyl-beta-cyclodextrin on oral bioavailability of tacrolimus. J Pharmacol Exp Ther. 2001;297(2):547–55. [PubMed] [Google Scholar]
- 60.Zhang H, Wu X, Wang H, et al. Effect of pregnancy on cytochrome P450 3a and P-glycoprotein expression and activity in the mouse: mechanisms, tissue specificity, and time course. Mol Pharmacol. 2008;74(3):714–23. doi: 10.1124/mol.107.043851. [DOI] [PMC free article] [PubMed] [Google Scholar]
- 61.Zhang H, Wu X, Naraharisetti SB, et al. Pregnancy does not increase CYP3A or P-glycoprotein activity in the non-human primate, Macaca nemestrina. J Pharmacol Exp Ther. 2009;330(2):586–95. doi: 10.1124/jpet.109.153569. [DOI] [PMC free article] [PubMed] [Google Scholar]
- 62.Trull A, Hughes V, Cooper D, et al. Influence of albumin supplementation on tacrolimus and cyclosporine therapy early after liver transplantation. Liver Transpl. 2002;8(3):224–32. doi: 10.1053/jlts.2002.31347. [DOI] [PubMed] [Google Scholar]
- 63.Undre NA, Schafer A. Factors affecting the pharmacokinetics of tacrolimus in the first year after renal transplantation. European Tacrolimus Multicentre Renal Study Group. Transplant Proc. 1998;30(4):1261–3. doi: 10.1016/s0041-1345(98)00234-6. [DOI] [PubMed] [Google Scholar]