

Abstract
Recombinant adeno-associated virus (rAAV) vectors have gained an extensive record of safety and efficacy in animal models of human disease. Infrequent reports of genotoxicity have been limited to specific vectors associated with excess hepatocellular carcinomas (HCC) in mice. In order to understand potential mechanisms of genotoxicity, and identify patterns of insertion that could promote tumor formation, we compared a self-complementary AAV (scAAV) vector designed to promote insertional activation (scAAV-CBA-null) to a conventional scAAV-CMV-GFP vector. HCC-prone C3H/HeJ mice and severe combined immunodeficiency (SCID) mice were infected with vector plus secondary treatments including partial hepatectomy (HPX) and camptothecin (CPT) to determine the effects of cell cycling and DNA damage on tumor incidence. Infection with either vector led to a significant increase in HCC incidence in male C3H/HeJ mice. Partial HPX after infection reduced HCC incidence in the cytomegalovirus-green fluorescent protein (CMV-GFP)–infected mice, but not in the cognate chicken β-actin (CBA)-null infected group. Tumors from CBA-null infected, hepatectomized mice were more likely to contain significant levels of vector DNA than tumors from the corresponding CMV-GFP–infected group. Most CBA-null vector insertions recovered from tumors were associated with known proto-oncogenes or tumor suppressors. Specific patterns of insertion suggested read-through transcription, enhancer effects, and disruption of tumor suppressors as likely mechanisms for genotoxicity.
Introduction
Recombinant adeno-associated virus (rAAV) vectors are becoming an important tool in the development of clinical gene therapy applications.1 Upon infection and uncoating in the target cell nucleus, the single-stranded genome of rAAV vectors is converted to double-stranded DNA either by host-cell DNA synthesis or interstrand base pairing in the case of conventional rAAV vectors, or by intrastrand base pairing in the case of self-complementary vectors (scAAV).2,3 The double-stranded vector genomes are then converted to circular forms through host-cell DNA repair processes.4,5,6,7 While the vast majority of rAAV vector genomes are maintained as circular episomes, there is clearly a small percentage (<0.5%) that integrate into host chromosomal sequences.8,9 Despite the overall inefficiency of rAAV integration, there remains a concern for genotoxicity, because even a small fraction of vector integration in a tissue as large as human liver would represent millions of integration events, each with a potential for altering host-cell stasis.
Preclinical studies have overwhelmingly supported the safety of rAAV treatment in numerous different tissues and animal models. To date, only a small number of studies have suggested genotoxicity associated with rAAV treatment. In a mouse disease model of mucopolysaccharidosis type VII, a rAAV vector expressing β-glucuronidase from a chicken β-actin (CBA) promoter was associated with excess liver tumors.10,11 The same vector also led to excess tumors in normal C57BL/6 mice, suggesting that it was not the underlying genetic disease that promoted oncogenesis. In a retrospective analysis of rAAV treatment in a mouse model of ornithine transcarbamylase deficiency, an association with excess liver tumors was detected when the vector carried the LacZ gene, but not the therapeutic ornithine transcarbamylase gene.12 It should be noted that the genetic background of the ornithine transcarbamylase mice, B6C3F1, was a liver tumor-prone strain. In a third study, wherein excess tumors were associated with rAAV treatment in a mouse model of phenylketonuria, the oncogenic effects were attributed to the surreptitious expression of a woodchuck hepadnavirus X-protein coding region from the vector construct.13 Finally, excess tumors were associated with rAAV-CBA-MOCS1 gene therapy treatment in both neonate and adult Mocs1-deficient mice.14 Together, these studies suggest that the risk of liver oncogenicity is related to specific features of certain rAAV vector constructs rather than rAAV vector treatment in general.
Analysis of rAAV integration sites from infected mouse tissues, with or without selection, has revealed a non-random distribution of vector. There is a significant preference for integration within genes, ribosomal DNA sequences, CpG islands, regions near transcription initiation sites, and palindromic sequences of >20 bp.15,16 Similar patterns were observed for rAAV integration in cultured human cells without selection, though with a lesser preference for integration within genes.17 While the transcribed regions of genes were targeted in both studies, neither the mouse nor the human studies showed correlations between observed integration within specific genes and the levels of active transcription from those genes in the tissues and cells analyzed. Both the mouse and human studies revealed integration hotspots wherein three or more integration events were detected within <500 bp regions.
In the mucopolysaccharidosis type VII model, a subsequent analysis of the rAAV integration sites in four tumors revealed that each had integrated vector within a 6 kb region of chromosome 12.10 This region contains a large number of small nucleolar RNA and regulatory microRNA genes in two loci termed Rian and Mirg, and these small RNAs were overexpressed in the tumor tissues, suggesting an insertional activation mechanism of tumor promotion. The finding that the four tumors contained integrations in the same region, rather than the many other proto-oncogenes that have been implicated in liver carcinogenesis, suggests that it is either an integration hotspot, or there are very specific interactions between transcriptional elements within the vector and the Rian-Mirg locus that lead to overexpression.
In a more recent study of the potential for rAAV genotoxicity, no significant increase in tumor incidence was observed in a large cohort of mice receiving a rAAV vector expressing human factor IX.18 Vector sequences from normal liver and four liver tumors in the rAAV-treated groups were amplified and analyzed by pyrosequencing for vector–chromosome junctions. Among 809 vector junctions recovered from normal tissue, and 220 from tumors, there were no differences in the likelihood of integration near oncogenes, and no integrations within the Rian-Mirg locus. There was no evidence of overexpressed genes in the regions of rAAV integration.
Together, these studies suggest that some vector constructs are more prone to genotoxicity than others, though the features that might contribute to this effect are not clear. In this study, we use a vector designed to promote read-through transcription into neighboring chromosomal sequences to test for patterns of rAAV integration that may promote tumors. scAAV vectors were used to eliminate variables associated with conversion to double-stranded DNA under different experimental conditions. To further increase the probability of detecting tumors, we used the liver tumor-prone C3H/HeJ mouse strain as well as severe combined immunodeficiency (SCID) mice. We identified three common insertion sites associated with proto-oncogenes in liver tumors, each involving specific modes of integration that suggested either read-through transcription or transcriptional enhancer effects on the target gene. We also noted an elevated tumor incidence in tumor-prone mice that were infected with a more conventional scAAV-GFP vector, though vector–chromosome junctions were not recovered from these tumors.
Results
Experimental design
Two different scAAV vectors were used in this study: the first was a CMV-GFP construct, expressing green fluorescent protein (GFP) from the cytomegalovirus (CMV) promoter with an SV40-derived mini intron, and containing two sequential polyadenylation signals (Figure 1a). The second vector, CBA-null was comprised of a CBA promoter only (CMV enhancer, CBA promoter, rabbit globin intron), with no protein-coding sequence and no polyadenylation signal. This vector was designed to promote insertional activation in order to test for common patterns of insertion, or mechanisms of proto-oncogene activation associated with excess tumors. In both constructs, the direction of transcription was oriented toward the hairpin end of the folded scAAV genome, which contains a deletion of the AAV terminal resolution site and D-sequence within the inverted terminal repeat (ITR). Transcripts through the wt ITR include a potential ATG translation initiation codon which can reduce expression of downstream reading frames.
Figure 1.

Liver tumor incidence in C3H/HeJ mice in response to scAAV vector infection. (a) Diagrams of scAAV-CMV-GFP vector and scAAV-CBA-null vector. CMV-GFP vector contains two polyadenylation signals derived from SV40 and bovine growth hormone gene. CBA-null vector does not contain protein-coding sequences or a polyadenylation signal. ΔITR, AAV inverted terminal repeat mutated to generate scAAV genomes. Paired arrows indicate the target site in the CMV enhancer for qPCR analysis. (b) Tumor incidence in uninfected (saline)or scAAV vector-infected (CMV-GFP and CBA-null) male C3H/HeJ mice at 10–14 months post-infection. Groups were subjected to: no secondary treatment (none), 43% partial hepatectomy (HPX), single dose of camptothecin (CPT), or both (HPX + CPT) at the time of infection. P values between treatment groups (significant differences in bold): a–b, 0.489; a–c, 0.072; a–d, 0.481; a–e, 0.009; a–i, 0.010; b–d, 0.193; b–f, 0.217; b–j, <0.001; c–d, 0.213; c–g, 0.132; c–k, 0.428; d–h, 0.775; d–l, 0.004; e–f, 0.045; e-g, 0.393; e–h, 0.010; e–i, 0.900; f–h, 0.741; f–j, <0.001; g–h, 0.015; g–k, 0.496; h–l, 0.010; i–j, 0.110; i–k, 1; i–l, 0.308; j–l, 0.308; k–l, 0.303. (c) Tumor incidence in females (note different Y-axis scale). P values: a–b, 1; a–c, 1; a–d, 1; a–e, 1; a–i, 0.075; b–d, 1; b–f, 1; b–j, 1; c–d, 1; c–g, 1; c–k, 1; d–h, 1; d–l, 1; e–f, 1; e–g, 1; e–h, 1; e–i, 1; f–h, 1; f–j, 1; g–h, 0.691; g–k, 0.558; h–l, 0.942; i–j, 0.079; i–k, 0.458; i–l, 0.528; j–l, 1; k–l, 0.923. CBA, chicken β-actin; CMV, cytomegalovirus; GFP, green fluorescent protein; qPCR, quantitative PCR; scAAV, self-complementary adeno-associated virus.
The potential for scAAV tumorigenicity was evaluated in two mouse models, C3H/HeJ and SCID, which were anticipated to be sensitive to potential AAV genotoxicity. The C3H/HeJ strain is prone to development of hepatocellular carcinomas, with 30–50% incidence in males by 2 years of age, and 1–2% in virgin females.19 The SCID strain was chosen because the DNA repair deficiency in these mice (DNA-PKCS−/−) has been reported to lead to higher rates of rAAV integration, which would be expected to lead to greater numbers of potentially oncogenic events.6
Subgroups (n = 25 each for males and females) from both the CMV-GFP and CBA-null vector treatment groups and both mouse strains were further treated with either 43% partial hepatectomy (HPX) at 16 hours postinjection, or a single dose of camptothecin (CPT) at 5 hours postinjection, or both. The HPX treatment was designed to test the effects of cell cycling on genotoxicity. Liver regeneration ensues between 32 and 36 hours after HPX in mice and is complete within 10 days.20 The CPT treatment was designed to induce DNA double-strand breaks (DSB) early during vector infection to test the possibility of increased genotoxicity due to increased integration. Pre-existing DSB have been shown to be targets of rAAV integration.21,22
Liver tumor incidence in scAAV-infected mice
Macroscopic liver tumors were quantified by visual inspection at necropsy. Of the 24 experimental groups, only the C3H/HeJ males showed a statistically significant increase in tumor incidence in response to scAAV vector treatment (Figure 1b, Table 1). In contrast, in the SCID mice, very few liver tumors were found among the different experimental groups, and no significant differences in tumor incidence were observed between vector-treated groups and untreated controls. While an increase in tumor incidence was noted among CPT-treated mice, this was unrelated to vector treatment. All SCID groups were terminated before 12 months of age due to high prevalence of lymphoma, which is common in SCID mice. The endpoint for each group was determined when >25% of the animals had been euthanized. There were no differences in lymphoma incidence between vector-treated mice and controls.
Table 1. Liver tumor incidence.
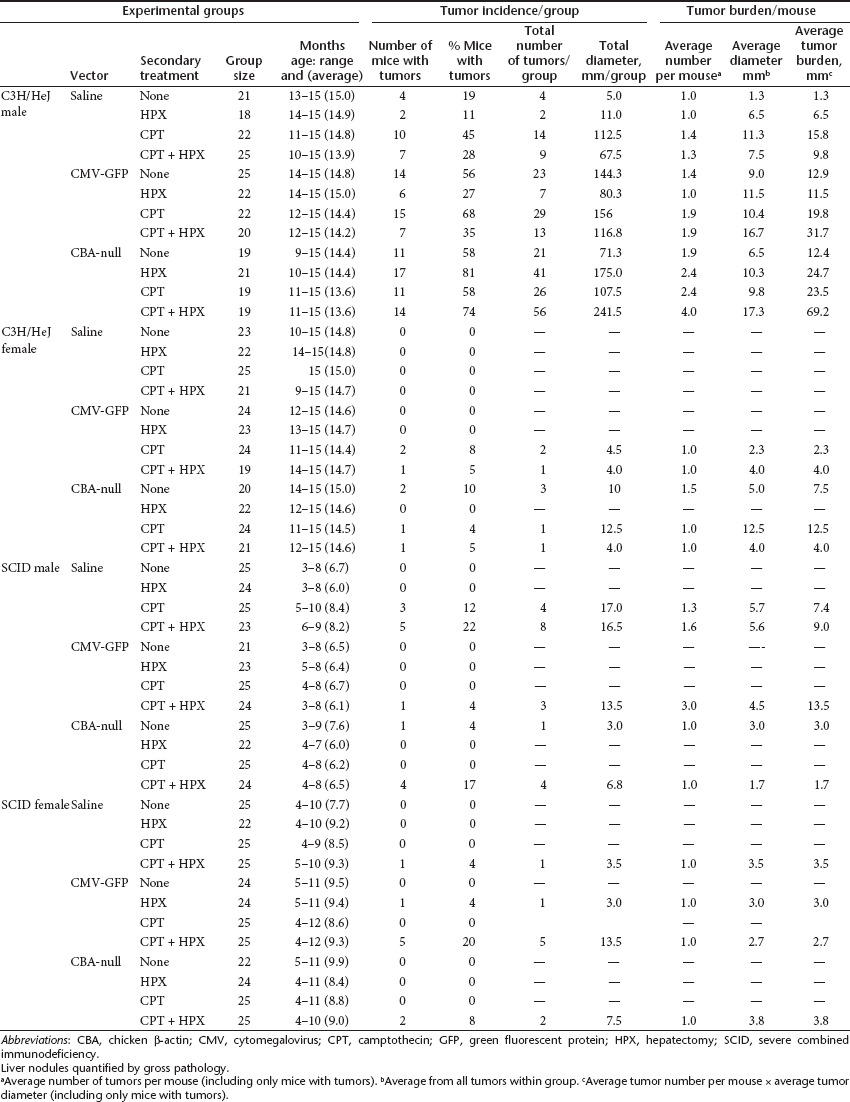
In the C3H/HeJ experimental groups, hepatic tumor incidence was higher in males than females, as expected for this mouse strain. In the male C3H/HeJ mice without HPX or CPT treatment, there were statistically significant, 3.4-fold and 3.1-fold increases in tumor incidence in CMV-GFP– and CBA-null–infected animals, respectively, compared with uninfected controls (Figure 1b). However, in mice treated with HPX, the behavior of the two vectors diverged. In CMV-GFP–infected animals, HPX treatment significantly decreased the tumor incidence (2.4-fold, P = 0.045). In contrast, in CBA-null–infected animals, tumor incidence increased (1.4-fold) rather than decreased. Though this increase was not statistically significant compared with the non-HPX group (P = 0.110), the response to HPX treatment was clearly different from the CMV-GFP–infected group. Uninfected control animals also showed a small (not statistically significant) decrease in tumor incidence, demonstrating that the HPX treatment in itself does not promote tumors in these animals. This suggests that the CBA-null vector was more likely than CMV-GFP to initiate tumors in proliferating cells.
These results were largely recapitulated in CPT-treated groups. The CPT treatment led to small increases in tumor incidence in uninfected mice, which, though not statistically significant (P = 0.072 and P = 0.193 for mice without and with HPX), is consistent with its known genotoxicity. However, this did not appear to synergize with vector-related genotoxicity. There was no statistically significant increase in tumor incidence in vector-infected animals subjected to CPT treatment relative to vector-infected groups that did not receive CPT treatment. Again, HPX led to a decrease in tumor incidence in the control and CMV-GFP–infected groups, though only the CMV-GFP decrease reached statistical significance (P = 0.015). In CBA-null–infected mice, there was no such decrease, but rather a small increase that did not reach significance compared with the nonhepatectomized group (P = 0.303).
In female C3H/HeJ mice, no tumors were detected in the uninfected groups at >14 months of age (Figure 1c). Although tumors were found in vector-infected groups, the incidence did not reach statistical significance. Trends observed in the males, such as consistent differences in hepatectomized mice, were not fully recapitulated in females.
Classification of liver neoplastic lesions in C3H/HeJ males
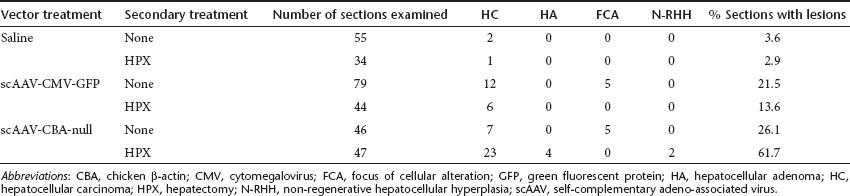
In the cohorts of C3H/HeJ and SCID mice that were not treated with CPT, tissues from each animal were evaluated for neoplastic and preneoplastic lesions by histopathological examination. Apart from liver, there were no other common malignancies found in other tissues examined including: bone marrow, thymus, spleen, lymph node, kidney, salivary gland, pancreas, lung, heart, testes, and ovaries. The vast majority of liver neoplasias were hepatocellular carcinomas (HCC) (Table 2), and the incidence among the different experimental groups closely paralleled the results of the macroscopic evaluations. Hepatocellular adenomas were found only in the group treated with CBA-null vector plus HPX, which also had the highest incidence of HCC. Small numbers of foci of cellular alteration were found among the vector treated groups without HPX, and 2 non-regenerative hepatocellular hyperplasias were scored in the CBA-null plus HPX group. Apart from HCC and hepatocellular adenomas, we could not detect any trends in the incidence of neoplastic or preneoplastic lesions among the experimental groups.
Table 2. Distribution of liver neoplastic lesions in C3H/HeJ males.
Vector genome content in tumors and normal liver tissue from C3H/HeJ mice
Tumors of >2 mm diameter were excised and divided for histopathology and molecular analysis. To determine whether scAAV integration may have contributed to oncogenesis, total cellular DNA was isolated from tumor and adjacent normal liver tissue and subjected to quantitative real-time PCR (qPCR) using primer/probe for the CMV enhancer region that is common to both vectors. Vector genome copy numbers were normalized to the cellular diploid genome copy number (VC/DG) determined using primer/probe for the cellular β-actin gene in parallel PCR reactions.
In normal liver tissue, VC/DG from nonhepatectomized males ranged from 0.03 to 0.6 at the experimental endpoint, with means in the different treatment groups ranging from 0.13 to 0.28 (Table 3). This was down from ~10–20 VC/DG in mice killed at 2 weeks post-infection. Vector genome content was substantially lower in normal liver from HPX groups (means ranging from 0.02 to 0.07), due to hepatocyte cell division and loss of episomal vector. There were no statistically significant differences in normal liver tissue between CMV-GFP– and CBA-null–infected animals in any treatment group.
Table 3. C3H/HeJ male tumors; vector genome content summary.
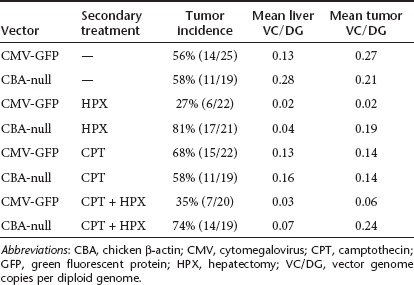
In tumor tissues from nonhepatectomized C3H/HeJ groups, the mean VC/DG was similar between CMV-GFP– and CBA-null–infected animals (Table 3 and Figure 2). However, in the two HPX groups, the mean VC/DG in tumors from CBA-null–infected animals was significantly higher than in tumors from mice infected with CMV-GFP vector (P = 0.042 and P = 0.002 for HPX and HPX + CPT treatment groups, respectively). The differences reflect a drop in VC/DG in tumors from CMV-GFP–infected mice that were subjected to HPX, paralleling the decreased tumor incidence in these groups. This suggested that the CBA-null vector insertions were more often associated with tumors in the context of dividing hepatocytes.
Figure 2.

Vector genome content in tumors from scAAV-infected C3H/HeJ mice. Vector genome copies per diploid genome (VC/DG) in tumors were measured by qPCR using primers and probe specific for a segment of the CMV enhancer present in both vectors (CMV-GFP or CBA-null). Two-tailed P values for differences between the indicated medians for each vector were evaluated using the Mann–Whitney test. (a) Untr, tumors from vector-infected mice without secondary treatment (P = 0.588); (b) CPT, vector-infected mice treated with camptothecin (P = 0.371); (c) HPX, vector-infected mice treated with 43% partial hepatectomy (P = 0.042); (d) CPT + HPX, vector-infected mice subjected to both CPT and HPX treatment (P = 0.002). CBA, chicken β-actin; CMV, cytomegalovirus; CPT, camptothecin; GFP, green fluorescent protein; HPX, hepatectomy; qPCR, quantitative PCR; scAAV, self-complementary adeno-associated virus; untr, untreated.
Vector insertion sites from tumors in C3H/HeJ males
We used inverse PCR and linker-ligation–mediated PCR to amplify junctions between vector and cellular DNA from tumor samples. We were able to recover sequences only from CBA-null–infected animals. Tumors from CMV-GFP–infected mice did not yield PCR products, possibly because of poor availability of suitable restriction sites in this vector. Among 22 tumors analyzed from CBA-null vector-treated C3H/HeJ males, 15 contained vector sequences that were clearly associated with known or suspected proto-oncogenes. Other readable sequences were mostly vector-inverted repeat concatemers. Only two junctions clearly mapped to intergenic regions. Among the associations with proto-oncogenes, some were observed to have occurred multiple times, thus representing common insertion sites, each with its own characteristic insertion pattern (Table 4). The insertions and their chromosomal context are described below.
Table 4. CBA-null vector insertion sites from C3H/HeJ males.
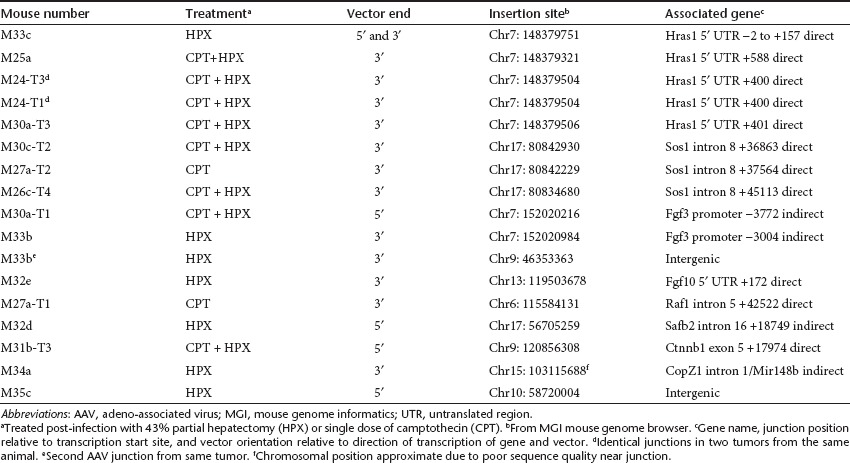
Hras1. The most common insertion site in tumors from CBA-null–infected mice was within the Hras1 gene. Four tumors, from different animals, contained this insertion, always in a direct orientation relative to transcription from the vector promoter and the Hras1 promoter (Figure 3a). A second tumor from one of these animals (M24) contained an identical junction, suggesting a metastasis from a primary tumor. Each of the four unique insertion sites was within the 1,064 bp 5′ untranslated region (5′ UTR) of the Hras1 gene. Vector sequences from the 3′ ITR junction (downstream from the CBA promoter) were recovered from all four tumors, and were distributed within 588 bp (+588) of the Hras1 transcription start site, with two of the junctions only 1 bp apart at +400 and +401 (breakpoint numbers designated from the first base that is unambiguously of cellular origin) (Figure 3b). From one tumor (M33c), both the 5′ and 3′ ITR junctions were recovered. While the 3′ junction from M33c was at +157, the 5′ ITR junction spanned the Hras1 transcript start site in an 8 bp region of homology between the ITR and chromosomal sequence. The vector insertion resulted in deletion of Hras1 sequences from approximately +9 to +153, with an intervening 12 bp inversion of Hras1 sequence from +107 to +118. The vector insertion in M33c was associated with a putative hairpin forming inverted repeat sequence (80% base pairing over 41 bases). The 5′ ITR junction was within the upstream arm of this inverted repeat, which also spanned the transcription initiation site, whereas the 12 bp inverted segment of Hras1 sequence at the 3′ junction was within the downstream arm of the inverted repeat. This suggested that the secondary structure of the chromosomal sequence may have contributed to the vector insertions at this site. We were not able to determine the locations of the 5′ ITR junctions in the other Hras1 insertions, or whether they were also associated with the inverted repeat region.
Figure 3.

CBA-null insertions in the Hras1 gene. (a) Context of vector insertions in Hras1 gene on chromosome 7. The end(s) and orientation for each recovered vector insertion are shown below. The position of a large, inverted repeat sequence in the Hras1 5′ untranslated region (UTR) is shown as blue inverted arrows above insertion M33c. Box (E1)indicates first exon including translation start site (ATG). (b) Sequences of vector–chromosome junctions showing ITR sequences (underlined), Hras1 5′ UTR (blue), overlapping microhomology between ITR and Hras1 (orange), insertions (red), and an inversion of Hras1 sequence (italics). Sequences from four insertions are shown including the 5′ and 3′ ends of the vector in a tumor from mouse M33c, the 3′ ends of vectors from tumors 1 and 3 from mouse M24, tumor 3 from M30a, and tumor from M25a. The endogenous Hras1 transcript initiation site in M33c 5′ junction is indicated by an arrow. Junction positions relative to the endogenous transcript initiation site are designated as the first base that is unambiguously of cellular origin. AAV, adeno-associated virus; CBA, chicken β-actin; ITR, inverted terminal repeat.
We quantified the copy numbers of these specific junctions in each of the tumors with Hras1 insertions using qPCR forward primer and probe within the vector 3′ ITR sequence that was contained in all of the junctions. Reverse primers were made immediately adjacent to the insertion site in chromosomal sequences for each insertion (the same primer and standard was used for M24-T1 and M30a-T3 which are only 1 bp apart) (Figure 3 and Supplementary Table S1). Standards for determining target sequence concentration were made by synthesizing 90–110 bp oligonucleotide sequences spanning the priming sites, based on sequence information from each junction. Specific junction copy numbers varied widely between the four tumors (M33c, 0.03; M24-T1, 0.1; M30a-T3, 0.6; M25a, 0.003 VC/DG). This suggested that the vector genomes were prone to rearrangement after the insertion event, or that vector-initiated oncogenic events lead to complex tumorigenesis.
Sos1. Three CBA-null vector junctions were within the Sos1 gene (son of sevenless). Unlike those in Hras1, all three were located within the 10 kb 8th intron of Sos1; two within ~2.5 kb of the splice donor site, and one within 400 bp of the splice acceptor site (Figure 4a). All were in a direct orientation with respect to transcription of the vector and gene. Only the 3′ ITR junctions (downstream from the CBA promoter) from each insertion were recovered.
Figure 4.

Vector insertion sites within proto-oncogenes. (a–g) The positions and orientations of CBA-null vector insertions within each cellular proto-oncogene are diagramed with exons (E#) depicted as boxes and introns as dashed lines. Transcription start sites for cellular genes and vectors are indicated. Priming sites for RT-PCR are indicated above in a,b, and c by inverted arrows (F, forward, R, reverse). Each vector is indicated by tumor designation and insertion position relative to the transcription start site of the gene, with junctions recovered from vector 3′ ends shown with ITR (small box) downstream from direction of transcription and 5′ ends upstream. CBA, chicken β-actin; ITR, inverted terminal repeat; RT-PCR, reverse transcription-PCR.
To determine whether the vector insertion caused overexpression of either the entire Sos1 gene, or the downstream exons, we used reverse transcription-PCR (RT-PCR) to compare the abundance of exon 7- and exon 10-containing transcripts in total RNA from normal liver (from a different animal, M32e) and two of the Sos1 insertion-containing tumors (M26c-T4 and M30c-T2). There were no significant differences in the abundance of exon 7-containing transcripts between the three samples, suggesting that there was not a transcriptional enhancer effect on Sos1 expression from the vector insertion (Figure 5a). In contrast, in the M30c-T2 tumor, there was an 11-fold excess abundance of exon 10, suggesting that the vector insertion led to read-through transcription of the downstream portion of the Sos1 gene. However, we did not detect overexpression of the downstream exon in RNA from the M26c-T4 tumor, which has the 3′ vector junction located near the 3′ splice acceptor site of the intron.
Figure 5.

Activated transcription of CBA-null vector-associated proto-oncogenes. (a) Overabundance of transcript downstream from Sos1 vector insertion. Transcripts containing exon 7 (black) and exon 10 (hatched) were measured in tumors with insertions in exon 8 of the Sos1 gene (M26c-T4 and M30a-T2), using the ΔCt method with GAPDH as standard, and normalized to expression of each exon in normal liver from a different animal. Only 30c-T2 showed overexpression of downstream exon. Means ± SD of RT-PCR in triplicate are shown. (b) Overexpression of Fgf10 in tumor with insertion in 5′ UTR of Fgf10 gene (M32e, hatched) compared with tumor from a different animal (M32a, black). Transcript levels were normalized to M32a tumor. Transcript levels from Fgfr2b, a major receptor for Fgf10, were measured for comparison. Means ± SD from two experiments performed in duplicate and combined are shown. CBA, chicken β-actin; GAPDH, glyceraldehyde 3-phosphate dehydrogenase; RT-PCR, reverse transcription-PCR; UTR, untranslated region.
Fgf3. Two CBA-null junctions were associated with the Fgf3 gene. In contrast to the Hras1 and Sos1 insertions, both were located upstream of the Fgf3 promoter, and in an indirect orientation relative to the direction of transcription (Figure 4b). Both insertions were within an ~190 bp region more than 3,000 bp upstream of the transcript initiation site, well outside any known transcribed sequences on either strand in the mouse genome. One junction (M30a-T1) contained the vector 5′ ITR at −3371 relative to the Fgf3 transcription start site. The second Fgf3 insertion (M33b) contained the vector 3′ ITR inserted between −3181 and −3303 relative to the transcription start site.
Using RT-PCR, we measured transcript levels from the Fgf3 gene, as well as the Fgf4 and Fgf15 genes situated immediately downstream as a cluster on the same chromosome. These genes are not normally expressed in adult liver, and no transcripts were detected in normal liver from an unrelated mouse (M32a), or in normal liver from the two mice with Fgf3 insertions. However, in the tumor from M30a-T1, the Fgf3 transcript was readily detected at a level approximately eightfold lower than the GAPDH reference for this sample (26.2 PCR cycles for Fgf3 and 23.3 cycles for GAPDH). Neither Fgf4 nor Fgf15 transcripts were detected from this tumor. The other tumor with an Fgf3 insertion (M33b) had no detectable transcripts from any of the three FGF genes. This tumor also contained a second, apparently unrelated vector junction sequence that mapped to an intergenic region on chromosome 9, far from any transcribed sequences. The observation that the Fgf3 insertions were upstream from the gene in an inverse orientation suggested an enhancer-mediated activation of the adjacent proto-oncogene in at least one of these tumors.
Fgf10. One CBA-null vector junction was located in the 5′ UTR of the Fgf10 gene, in a direct orientation (Figure 4c). Fgf10 is expressed during embryogenesis but is not normally active in adult liver. We tested for activation of this gene by RT-PCR from tumor and normal liver tissue from this animal (M32e), and a different animal with an unrelated tumor (M32a) (Figure 5b). Transcripts from Fgf10 were undetectable from normal liver in M32a, and barely detectable in tumor tissue from this mouse. In M32e, which contained the Fgf10 insertion, the level of Fgf10 transcript was ~40,000-fold higher than the M32a tumor. This suggested that the vector insertion had the direct effect of increasing transcription from the associated proto-oncogene. We also measured transcript levels from the Fgfr2b gene in these tumors, which is a receptor for Fgf10. Although the Fgfr2b gene was expressed in all samples, there were no significant differences between either of the tumors or normal liver.
Other integration sites (Table 4). Additional CBA-null vector insertions associated with proto-oncogenes in tumors were in intron 5 of Raf1, intron 16 of Safb2, and exon 5 of Ctnnb1 (Figure 4d–f). Unlike all of the other intron insertions, the vector in Safb2 was in an indirect orientation relative to transcription of the gene.
Another insertion (M34a) was located in intron 1 of the CopZ1 gene, which is not recognized as a proto-oncogene. However, the vector junction was ~150 bp from a microRNA gene, Mir148b, hosted within this intron (Figure 4g). The Mir148b microRNA has been associated with tumor suppressor functions in multiple tissues, suggesting that the vector insertion disrupted its expression, though this was not directly tested.
Apart from the secondary junction in M33b, only one other vector insertion among all the tumors tested was clearly intergenic. Located on chromosome 10, it was ~30 kb from Ankrd57 and 60 kb from the P4ha1 gene. Neither of these genes are known or suspected proto-oncogenes, and there are no known microRNAs or alternate transcripts from this region. It is likely that this was either an insertion event that occurred in a cell that spontaneously developed into a tumor, or that there was a second AAV integration which was not recovered.
Discussion
We used two different scAAV vectors to test for specific patterns of insertion associated with liver tumors in mice. We took specific steps to increase the likelihood of tumor promotion, including a vector with a high propensity for read-through transcription (CBA-null), a tumor-prone mouse model (C3H/HeJ), deficiency in a DNA repair pathway which increases AAV integration frequency (DNA-PKCS−/− SCID), cell cycling induced by partial HPX, and DNA damage induced with CPT. Clearly, these were not meant to directly reflect conditions anticipated to be encountered in therapeutic applications. Rather, they were designed to test specific hypotheses regarding the ways that AAV vector genomes interact with chromosomal sequences which may promote genotoxicity. Our primary outcome measure was the incidence of liver tumors, although each animal was carefully screened for neoplasias in other tissues.
Excess tumors over mock-infected control animals were observed only in the tumor-prone C3H/HeJ strain after 10 months of age. Liver tumor incidences in SCID mice were similar to uninfected controls, although these groups could be maintained for an average of only 6–9 months of age due to the development of lymphomas. While treatment with CPT may have increased tumors' incidence in uninfected C3H/HeJ males, there was no apparent synergy with vector infection. Both the SCID and CPT groups were included in the study to determine the effects of increased vector integration, which has previously been demonstrated in liver in SCID mice, and in association with DNA-damaging agents. It remains possible that induction of DNA damage over a longer period of time, rather than the single dose 5 hours post-infection, or the use of a different DNA-damaging agent, might have led to increased vector integration associated with tumorigenesis.
Male C3H/HeJ mice are more likely to develop liver tumors than females, and the only statistically significant increases in tumor incidence were in the male treatment groups. In female C3H/HeJ mice, liver tumors were observed only in the vector-treated groups, though the numbers did not reach statistical significance. Increases were observed in males infected with either scAAV-CMV-GFP vector or scAAV-CBA-null vector. Although the increase was similar for both vectors in otherwise untreated animals, HPX treatment in CMV-GFP–infected males resulted in a significant reduction in tumors, whereas in CBA-null–infected males, there was no such decrease, but instead, a small increase. Previous studies have shown that HPX alone does not increase liver tumors in C3H/HeJ males.23 The dynamics of the vector–host interaction in the HPX animals are complex, given that 43% of the initial vector dose is removed from the animal along with the liver tissue, and the induction of cell division throughout the remaining liver leads to rapid loss of episomal vector genomes at an early timepoint. This would be expected to reduce the risk of vector integration at later timepoints. While the loss of infected tissue and episomal vector may have contributed to the decrease in tumor incidence in the hepatectomized CMV-GFP–treated groups, the same dynamics would also have affected the CBA-null–infected animals, which did not respond with a decrease in tumor incidence.
The difference between the two vectors in response to HPX was also reflected in the amount of vector DNA present in the tumors. In CMV-GFP–infected animals, there was a significant decrease in the mean VC/DG in tumors from HPX mice, which paralleled the difference in tumor incidence. This suggested that tumors in these mice were more likely to be spontaneous, and not caused by vector integration. In contrast, the mean VC/DG in tumors from CBA-null–infected mice did not change between HPX and non-HPX groups. These observations are not easily explained by the greater insertional activation potential of the CBA-null vector alone, because we did not observe a greater tumor incidence in non-HPX animals. This suggests that partial hepatectomy amplifies the insertional activation potential of the CBA-null vector, possibly by altering the patterns of vector insertion toward genes involved in growth and cell division.
While the collective vector copy number data from the different treatment groups is consistent with the differences in tumor incidence, copy numbers from individual tumors should be interpreted cautiously. While several tumors contained ~1 VC/DG, which would suggest clonal expansion of a progenitor cell with a vector insertion, most were far lower and spanned a wide range. Even in the four tumors that contained vector inserted in the 5′ UTR of Hras1, the copy numbers varied widely from <0.01 to 0.6 VC/DG. This may be due to vector rearrangements after insertion, copy number variations in different regions of the tumor, or paracrine effects from activated proto-oncogenes such as Fgf3 and Fgf10 that promote growth of bystander cells.24
Among the tumors in CBA-null–infected C3H/HeJ males, three vector insertions were associated with growth factor genes (Fgf3 and Fgf10) that are normally not expressed in adult liver, but are induced in response to injury. All three Fgf insertions were from hepatectomized mice, in which these genes would have been induced within hours of vector infection. While this suggests a connection between induction of proto-oncogene expression and tumor incidence in hepatectomized animals, previous studies showed no correlation between the probability of integration in a gene and its expression level in that specific cell type.16,17 However, there may be events associated with the induction phase of transcriptional activation that promote rAAV integration, which are not reflected in constitutive transcription. A spate of insertions in genes associated with proliferation would explain the high tumor incidence in CBA-null–infected animals after hepatectomy. Alternatively, there may have been an increase in the total number of vector integrations due to an increase in the incidence of DNA DSB, which are targets of rAAV integration.21,22 Most endogenous DSB occur during S-phase, when DNA replication forks encounter nicked or damaged DNA template.25
In a previous study of rAAV genotoxicity, the finding that all four tumors had AAV integrated within a 6 kb region of chromosome 12 was striking, and suggested a very specific interaction between the vector and the chromosomal locus. We observed a greater variety of integration sites associated with proto-oncogenes, although in several instances the same proto-oncogene was involved in different tumors. Among these, each displayed a specific pattern of insertion. All of the Hras1 insertions were in the 5′ UTR of the transcribed region, all Sos1 insertions were within intron 8, and both Fgf3 insertions were upstream from the transcript initiation site, in an indirect orientation. None of these insertions corresponded to rAAV integration hotspots identified in previous studies. This raises the question as to whether these are preferred recombination sites for the vector, or instead, simply the most effective ways of promoting a tumor in this animal background. Although there is evidence for both possibilities, the latter appears to be the dominant mechanism based on the large number of insertions affecting one particular pathway.
Most vector insertions were likely to affect the Hras1 signaling pathway. Four junctions were directly inserted in the 5′ UTR of Hras1, three within intron 8 of the Sos1 gene, and one was in intron 5 of the Ras1 gene. Sos1 is a guanine nucleotide exchange factor with the primary function of activating Ras signaling.26 Notably, the catalytic domain of Sos1 is downstream from intron 8 and the regulatory domain is upstream, suggesting that overexpression of the downstream exons of Sos1 would result in constitutively activated Ras. We confirmed in one of two Sos1 insertion tumors tested that the downstream region of the gene was overexpressed relative to the upstream region. Raf1 is a serine/threonine kinase, and one of the principal downstream effectors of Ras in the mitogen-activatd protein kinase pathway. Constitutive activation of Raf and Ras are indistinguishable in their potential to induce malignant transformation.27
The Sos1 insertions were located at either end of the intron, and separated by 7 kb, suggesting that the driving force behind the oncogenic event was transcription of the downstream exons rather than a specific integration hotspot. Taken together, this group of insertions suggests that activation of the Hras1 pathway is the most efficient mechanism for generating liver tumors in these animals, and indeed, most spontaneous tumors in C3H/HeJ mice contain an activating mutation in Hras1.28 In this case, the sensitivity of this mouse strain to activation of Hras1 signaling is more likely to explain the multiple integrations associated with this gene than a recombination hotspot. Further, the Hras1 locus was not among a group of identified rAAV integration hotspots in mouse liver in a previous study.16
Consistent with the idea that multiple associations with specific proto-oncogenes in tumors are driven by efficient mechanisms of transformation rather than integration hotspots, we detected two insertions upstream from the Fgf3 gene, which is located at the head of a cluster of proto-oncogenes on mouse chromosome 7, including Fgf4, Fgf15, Oraov1, and Ccnd1. Both insertions were in the opposite transcriptional orientation as Fgf3, and oriented away from the rest of the gene cluster. In one of two tumors tested, we confirmed that Fgf3 was overexpressed relative to normal liver. This locus is also a common insertion site for mouse mammary tumor virus.29 The predominant mechanism for activation of Fgf3 by mouse mammary tumor virus insertion is through enhancer effects, and this is the likely mechanism for the scAAV-CBA-null vector effect in these tumors. While the insertions may have affected multiple genes within the cluster, we did not observe activation of the adjacent Fgf4 and Fgf15 genes in either the tumor that overexpressed Fgf3, or another similar insertion in which Fgf3 activation was not detected.
In the previous study linking rAAV integration in the Rian locus to liver tumors, two of four insertions were within a microRNA transcript.10 Although we did not find vector insertions associated with this locus, one of the CBA-null insertions was within 150 bp of a microRNA gene (Mir148b) which is under-represented in multiple cancer types including HCC.30,31 While the vector insertion did not interrupt the stem-loop structural portions of the microRNA, it is possible that it interfered either with its processing or with expression/splicing of the host gene. Together with the previously identified Rian insertions, this suggests that microRNA genes are a preferred target for integration. It has been suggested that these palindromic sequences promote DNA DSB, and integration of rAAV vector has previously been associated with known chromosomal fragile sites.15,32 However, in the present study, only one vector insertion (M32d, Safb2) was within 5 Mb of a known mouse chromosomal fragile site.33
Most of the CBA-null insertions are consistent with insertional activation of the associated proto-oncogene. Two possible exceptions to a strictly activation-based mechanism for tumor promotion are the Mir148b insertion discussed above, and the insertion in intron 16 of the Safb2 gene. This locus is frequently missing in breast cancer tumors, suggesting that the vector insertion in this tumor may represent an inactivating mutation.34
In multiple studies, rAAV integration has been shown to be dispersed throughout the genome with some degree of preference for transcribed regions and other general features, but without targeting proto-oncogenes. Thus, in the context of all rAAV insertions, those near oncogenes are relatively rare. In this study, we observed multiple tumors with insertions in the same proto-oncogene, and sharing a common pathway (Hras signaling), or a common juxtaposition relative to the gene. Rather than integration hotspots, this oversampling of specific patterns of insertion suggests that even among the random insertions expected in or near proto-oncogenes, only a specific subset result in tumors.
The C3H/HeJ mouse does not reflect the majority of animal models that have been used in rAAV preclinical studies in terms of tumor promotion, nor is it likely to quantitatively predict genotoxic risk in humans. However, the CH3/HeJ male mouse may be a valuable tool for determining the relative genotoxic risk between different rAAV vector constructs, and may help to identify potential tumor-promoting elements within these vectors.
Materials and Methods
Vector preparation. sc-rAAV constructs were packaged in AAV serotype rh74 (AAVrh74), which is closely related to AAV serotype 8, and efficiently infects liver, heart, and skeletal muscle in mice.35 The scAAV-CMV-GFP and scAAV-CBA-null vectors (GenBank accession numbers: JX445134 and JX445135, respectively) were prepared by the NCH-RI Viral Vector Core facility using three-plasmid transient transfection in HEK293 cells as previously described. The vectors were concentrated by tangential flow ultrafiltration and purified by ion exchange chromatography. Titers were determined by qPCR and verified by dot-blot hybridization.
Animals. Male and female C3H/HeJ and SCID mice (C3Smn.CB17-Prkdcscid/J) were purchased from Jackson Laboratory (Bar Harbor, ME) at 6–10 weeks of age. All animal protocols were approved by the Institutional Animal Care and Use Committee of Nationwide Children's Hospital.
Treatments. Cohorts of 25 adult animals per strain and gender received one of three injections (scAAV-CMV-GFP, scAAV-CBA-null, or sterile saline solution), with or without CPT treatment, and with or without partial HPX. rAAV vectors were administered to mice at 8–12 weeks of age by tail vein injection at a dose of 5 × 10¹⁰ genome copies per animal, equivalent to a dose of 2 × 10¹² genome copies/kg. Half of the injected mice were subjected to partial HPX performed 16 hours after vector delivery. Briefly, mice were anesthetized by inhalation of 2% isoflurane. A subxiphoid midline abdominal incision exposed the liver. The left and right posterior lobes were ligated at their stem by two separate ligatures and removed. The abdominal cavity was rinsed with sterile saline solution and closed by two layers of continuous sutures. All surgical procedures were performed using strict aseptic technique. Mortality associated with surgery was <2%. Preliminary studies indicated that the two lobes removed constituted 43% of the total liver weight in both genders in this mouse strain.
A second cohort of SCID and C3H/HeJ mice received the same vector treatments, with and without partial HPX, and were additionally treated with a single dose of CPT (Sigma-Aldrich, St Louis, MO), by intraperitoneal route at a dose of 62.5 µg/mouse (2.5 mg/kg), at 5 hours after vector injection.
Follow up. Animals were housed in microisolator cages for up to 12 months of age for SCID mice, and 15 months for C3H/HeJ, under frequent observation for signs or symptoms of disease. Animals showing distress, or with palpable tumors, were euthanized and evaluated for the presence of gross tumors and for histopathology as below. Animals found dead in cages were necropsied, but were not used in quantitative evaluation of tumor incidence or histopathology. In the C3H/HeJ groups, no tumors were detected in any animal before the age of 9 months, and mice that died or were euthanized before this age for incidental health reasons were not included in the statistical evaluation. When ~25% of the mice in each treatment cohort had been euthanized due to the detection of large tumors by palpation, or incidental attrition, the remainder of the group was terminated to maintain statistically significant, roughly age-matched groups. Mouse cohorts were maintained in separate cages during the study and received individual designators when they reached an endpoint, either through attrition, tumor burden, or end of designated study period. For example, mouse M11b was the second animal to reach an endpoint in cage 11 from a male cohort. In mice that had more than one tumor, each tumor was numbered, i.e., M26c-T3 and M26c-T4 were two tumors from mouse M26c identified by gross pathology.
Quantification of tumor incidence and tissue collection. Mice were deeply anesthetized by intraperitoneal injection of Avertin (2,2,2-Tribromoethanol; Sigma-Aldrich) followed by gross examination of the abdominal cavity through a midline abdominal incision. The liver was carefully examined for the presence of macroscopically visible nodules, and the number and diameters of gross nodules were recorded.
Transcardial perfusion was performed, first with phosphate-buffered saline containing 10 U/ml of heparin, followed with 4% buffered paraformaldehyde. Healthy and tumor liver samples were collected before paraformaldehyde perfusion and snap-frozen in liquid nitrogen for DNA and RNA analysis. All the organs were fixed in paraformaldehyde for histopathology.
Histopathology. Tissues were collected immediately following perfusion as described above. After overnight fixation in 4% buffered paraformaldehyde, tissues were transferred to 70% ethanol and processed routinely, paraffin-embedded, sectioned at 5 µm then stained with hematoxylin and eosin. Slides containing liver sections with representative lesions were scanned to ×400 magnification with an Aperio ScanScope digital scanner and images were captured with Aperio ImageScope software (Aperio, Vista, CA). Neoplastic and preneoplastic liver lesion diagnoses were based upon standard nomenclature for hepatic lesions in rats and mice recently recommended by the IHAND project (International Harmonization of Nomenclature and Diagnostic Criteria for Lesions in Rats and Mice) (Thoolen, B et al., 2010). Neoplastic and preneoplastic liver lesion diagnoses included non-regenerative hepatocellular hyperplasia, focus of cellular alteration, hepatocellular adenoma, and HCC (Supplementary Figure S1).
In the cohorts of C3H/HeJ and SCID mice subjected to vector (or saline control) injection, with and without partial HPX (but not cohorts treated with CPT), each animal was evaluated for other abnormalities by histopathology. Tissues examined included liver, bone marrow, thymus, lymph nodes, spleen, kidney, lung, heart, pancreas, thyroid gland, salivary gland, testes, and ovaries. Multiple liver sections from each animal were evaluated for neoplastic or preneoplastic lesions. Three liver sections from mice without HPX, and two sections from animals with HPX were examined, except in livers containing large tumors. In the cohorts treated with CPT, only tumor-bearing liver sections were examined to confirm tumor identification.
Statistical analysis. For tumor incidence, groups of 18–25 animals were compared using Firth's penalized maximum likelihood estimation (GENMOD procedure in SAS 9.2). For vector genome content in tumors from different treatment groups, medians from each group were compared using a two-tailed Mann–Whitney test in GraphPad Prism software (GraphPad Software, La Jolla, CA).
Vector genome content in tumor and normal tissue. Total DNA was extracted from 15–25 mg of snap-frozen liver or tumor samples using DNeasy spin columns (Qiagen, Valencia, CA). The DNA concentrations were approximated by OD260/280 and 0.5 µg aliquots were subjected to TaqMan qPCR using primers and probes specific for a region of the CMV enhancer that is identical in both CMV-GFP and CBA-null vectors (Supplementary Table S1). Vector genome amplification in liver DNA samples was compared against plasmid DNA standards mixed with DNA from uninfected mouse liver (in duplicate). Cellular diploid genome copy numbers in DNA samples were determined in separate parallel reactions with primer/probe against the cellular β-actin gene using carefully quantified uninfected mouse liver DNA as standard.
Copy numbers for specific vector insertion junctions within the Hras1 gene were quantified by qPCR using forward primer and probe within the vector 3′ ITR and reverse primers derived from chromosomal sequence adjacent to the insertion sites (Supplementary Table S1). Standards for these assays were synthetic oligonucleotides comprising 90–110 bp region spanning the junction-priming sites, derived from the junction sequences.
Gene expression in tumor and normal tissue. Total RNA was extracted from snap-frozen tumor and normal liver samples using SV total RNA (Promega, Madison, WI) spin columns, and reverse transcribed using Verso cDNA kit (Thermo Scientific, Waltham, MA). Transcript levels from specific genes associated with vector insertions were analyzed by RT-PCR (40 amplification cycles) using SYBR green detection. Relative transcript levels were derived by comparison to GAPDH transcripts using the comparative Ct method. Primer sequences are shown in Supplementary Table S2.
Vector insertion site analysis. Junctions between rAAV vector and chromosomal sequences were amplified by inverse PCR or linker-ligation–mediated PCR. For inverse PCR, genomic DNA (0.5 µg) from tumor was digested with Mse I, and the products were ligated into circles in a volume of 400 µl. First round PCR was performed with 100 ng ligated genomic DNA in 50 µl reactions using Herculase II DNA polymerase (Agilent Technologies, Santa Clara, CA) and 40 amplification cycles. Primers were situated near the 5′ and 3′ ends of the vector and the nearest internal Mse I sites to amplify the intervening chromosomal sequence. Second round PCR with nested primers was performed with 2.5 µl of first round PCR product as template in 50 µl reactions using Herculase II and 40 cycles. Second round PCR products were gel-purified and subjected to a third round of PCR using the second round primers. Third round PCR products were directly sequenced using the nested PCR primers and conventional automated DNA sequencing.
For linker-ligation–mediated PCR, 0.5 µg genomic DNA from tumor was digested with Tsp509 I, and ligated to splinkerettes in a 400 µl volume followed by PCR and gel purification as above.36
Sequences were mapped to the mouse genome individually using the NCBI BLAST analysis and the mouse genome informatics (MGI) mouse genome browser. The sequences were further analyzed using the Gene Therapy Safety Group (GTSG) online analysis package.33
SUPPLEMENTARY MATERIAL Figure S1. Histopathologic liver lesions. Table S1. Primers for vector copy number qPCR. Table S2. Primers for RT-PCR.
Acknowledgments
This work was supported by National Institutes of Health grant R01AI070244. We are grateful to the Viral Vector Core and the Biostatistics Core at The Research Institute at Nationwide Children's Hospital for vector production and for data analysis. The authors declared no conflict of interest.
Supplementary Material
Histopathologic liver lesions.
Primers for vector copy number qPCR.
Primers for RT-PCR.
REFERENCES
- Mingozzi F., and, High KA. Therapeutic in vivo gene transfer for genetic disease using AAV: progress and challenges. Nat Rev Genet. 2011;12:341–355. doi: 10.1038/nrg2988. [DOI] [PubMed] [Google Scholar]
- Nakai H, Storm TA., and, Kay MA. Recruitment of single-stranded recombinant adeno-associated virus vector genomes and intermolecular recombination are responsible for stable transduction of liver in vivo. J Virol. 2000;74:9451–9463. doi: 10.1128/jvi.74.20.9451-9463.2000. [DOI] [PMC free article] [PubMed] [Google Scholar]
- McCarty DM. Self-complementary AAV vectors; advances and applications. Mol Ther. 2008;16:1648–1656. doi: 10.1038/mt.2008.171. [DOI] [PubMed] [Google Scholar]
- Yue Y., and, Duan D. Double strand interaction is the predominant pathway for intermolecular recombination of adeno-associated viral genomes. Virology. 2003;313:1–7. doi: 10.1016/s0042-6822(03)00432-x. [DOI] [PubMed] [Google Scholar]
- Nakai H, Storm TA, Fuess S., and, Kay MA. Pathways of removal of free DNA vector ends in normal and DNA-PKcs-deficient SCID mouse hepatocytes transduced with rAAV vectors. Hum Gene Ther. 2003;14:871–881. doi: 10.1089/104303403765701169. [DOI] [PubMed] [Google Scholar]
- Song S, Lu Y, Choi YK, Han Y, Tang Q, Zhao G.et al. (2004DNA-dependent PK inhibits adeno-associated virus DNA integration Proc Natl Acad Sci USA 1012112–2116. [DOI] [PMC free article] [PubMed] [Google Scholar]
- Cataldi MP., and, McCarty DM. Differential effects of DNA double-strand break repair pathways on single-strand and self-complementary adeno-associated virus vector genomes. J Virol. 2010;84:8673–8682. doi: 10.1128/JVI.00641-10. [DOI] [PMC free article] [PubMed] [Google Scholar]
- Deyle DR., and, Russell DW. Adeno-associated virus vector integration. Curr Opin Mol Ther. 2009;11:442–447. [PMC free article] [PubMed] [Google Scholar]
- McCarty DM, Young SM., Jr, and, Samulski RJ. Integration of adeno-associated virus (AAV) and recombinant AAV vectors. Annu Rev Genet. 2004;38:819–845. doi: 10.1146/annurev.genet.37.110801.143717. [DOI] [PubMed] [Google Scholar]
- Donsante A, Miller DG, Li Y, Vogler C, Brunt EM, Russell DW.et al. (2007AAV vector integration sites in mouse hepatocellular carcinoma Science 317477. [DOI] [PubMed] [Google Scholar]
- Donsante A, Vogler C, Muzyczka N, Crawford JM, Barker J, Flotte T.et al. (2001Observed incidence of tumorigenesis in long-term rodent studies of rAAV vectors Gene Ther 81343–1346. [DOI] [PubMed] [Google Scholar]
- Bell P, Wang L, Lebherz C, Flieder DB, Bove MS, Wu D.et al. (2005No evidence for tumorigenesis of AAV vectors in a large-scale study in mice Mol Ther 12299–306. [DOI] [PubMed] [Google Scholar]
- Embury JE, Frost S, Charron CE, Madrigal E, Perera O.et al. (2008Hepatitus virus protein X-phenylalanine hydroxylase fusion proteins identifed in PKU mice treated with AAV-WPRE vectors Gene Ther Mol Biol 1269–76. [Google Scholar]
- Reiss J., and, Hahnewald R. Molybdenum cofactor deficiency: Mutations in GPHN, MOCS1, and MOCS2. Hum Mutat. 2011;32:10–18. doi: 10.1002/humu.21390. [DOI] [PubMed] [Google Scholar]
- Inagaki K, Lewis SM, Wu X, Ma C, Munroe DJ, Fuess S.et al. (2007DNA palindromes with a modest arm length of greater, similar 20 base pairs are a significant target for recombinant adeno-associated virus vector integration in the liver, muscles, and heart in mice J Virol 8111290–11303. [DOI] [PMC free article] [PubMed] [Google Scholar]
- Nakai H, Wu X, Fuess S, Storm TA, Munroe D, Montini E.et al. (2005Large-scale molecular characterization of adeno-associated virus vector integration in mouse liver J Virol 793606–3614. [DOI] [PMC free article] [PubMed] [Google Scholar]
- Miller DG, Trobridge GD, Petek LM, Jacobs MA, Kaul R., and, Russell DW. Large-scale analysis of adeno-associated virus vector integration sites in normal human cells. J Virol. 2005;79:11434–11442. doi: 10.1128/JVI.79.17.11434-11442.2005. [DOI] [PMC free article] [PubMed] [Google Scholar]
- Li H, Malani N, Hamilton SR, Schlachterman A, Bussadori G, Edmonson SE.et al. (2011Assessing the potential for AAV vector genotoxicity in a murine model Blood 1173311–3319. [DOI] [PMC free article] [PubMed] [Google Scholar]
- Drinkwater NR., and, Ginsler JJ. Genetic control of hepatocarcinogenesis in C57BL/6J and C3H/HeJ inbred mice. Carcinogenesis. 1986;7:1701–1707. doi: 10.1093/carcin/7.10.1701. [DOI] [PubMed] [Google Scholar]
- Fausto N. Liver regeneration. J Hepatol. 2000;32 suppl. 1:19–31. doi: 10.1016/s0168-8278(00)80412-2. [DOI] [PubMed] [Google Scholar]
- Miller DG, Petek LM., and, Russell DW. Adeno-associated virus vectors integrate at chromosome breakage sites. Nat Genet. 2004;36:767–773. doi: 10.1038/ng1380. [DOI] [PubMed] [Google Scholar]
- Miller DG, Rutledge EA., and, Russell DW. Chromosomal effects of adeno-associated virus vector integration. Nat Genet. 2002;30:147–148. doi: 10.1038/ng824. [DOI] [PubMed] [Google Scholar]
- Hanigan MH, Winkler ML., and, Drinkwater NR. Partial hepatectomy is a promoter of hepatocarcinogenesis in C57BL/6J male mice but not in C3H/HeJ male mice. Carcinogenesis. 1990;11:589–594. doi: 10.1093/carcin/11.4.589. [DOI] [PubMed] [Google Scholar]
- Memarzadeh S, Xin L, Mulholland DJ, Mansukhani A, Wu H, Teitell MA.et al. (2007Enhanced paracrine FGF10 expression promotes formation of multifocal prostate adenocarcinoma and an increase in epithelial androgen receptor Cancer Cell 12572–585. [DOI] [PMC free article] [PubMed] [Google Scholar]
- Vilenchik MM., and, Knudson AG. Endogenous DNA double-strand breaks: production, fidelity of repair, and induction of cancer. Proc Natl Acad Sci USA. 2003;100:12871–12876. doi: 10.1073/pnas.2135498100. [DOI] [PMC free article] [PubMed] [Google Scholar]
- Gureasko J, Kuchment O, Makino DL, Sondermann H, Bar-Sagi D., and, Kuriyan J. Role of the histone domain in the autoinhibition and activation of the Ras activator Son of Sevenless. Proc Natl Acad Sci USA. 2010;107:3430–3435. doi: 10.1073/pnas.0913915107. [DOI] [PMC free article] [PubMed] [Google Scholar]
- Beeram M, Patnaik A., and, Rowinsky EK. Raf: a strategic target for therapeutic development against cancer. J Clin Oncol. 2005;23:6771–6790. doi: 10.1200/JCO.2005.08.036. [DOI] [PubMed] [Google Scholar]
- Buchmann A, Bauer-Hofmann R, Mahr J, Drinkwater NR, Luz A., and, Schwarz M. Mutational activation of the c-Ha-ras gene in liver tumors of different rodent strains: correlation with susceptibility to hepatocarcinogenesis. Proc Natl Acad Sci USA. 1991;88:911–915. doi: 10.1073/pnas.88.3.911. [DOI] [PMC free article] [PubMed] [Google Scholar]
- Clausse N, Baines D, Moore R, Brookes S, Dickson C., and, Peters G. Activation of both Wnt-1 and Fgf-3 by insertion of mouse mammary tumor virus downstream in the reverse orientation: a reappraisal of the enhancer insertion model. Virology. 1993;194:157–165. doi: 10.1006/viro.1993.1245. [DOI] [PubMed] [Google Scholar]
- Song YX, Yue ZY, Wang ZN, Xu YY, Luo Y, Xu HM.et al. (2011MicroRNA-148b is frequently down-regulated in gastric cancer and acts as a tumor suppressor by inhibiting cell proliferation Mol Cancer 101. [DOI] [PMC free article] [PubMed] [Google Scholar]
- Li R, Qian N, Tao K, You N, Wang X., and, Dou K. MicroRNAs involved in neoplastic transformation of liver cancer stem cells. J Exp Clin Cancer Res. 2010;29:169. doi: 10.1186/1756-9966-29-169. [DOI] [PMC free article] [PubMed] [Google Scholar]
- Rivadeneira ED, Popescu NC, Zimonjic DB, Cheng GS, Nelson PJ, Ross MD.et al. (1998Sites of recombinant adeno-associated virus integration Int J Oncol 12805–810. [DOI] [PubMed] [Google Scholar]
- Appelt JU, Giordano FA, Ecker M, Roeder I, Grund N, Hotz-Wagenblatt A.et al. (2009QuickMap: a public tool for large-scale gene therapy vector insertion site mapping and analysis Gene Ther 16885–893. [DOI] [PubMed] [Google Scholar]
- Hammerich-Hille S, Bardout VJ, Hilsenbeck SG, Osborne CK., and, Oesterreich S. Low SAFB levels are associated with worse outcome in breast cancer patients. Breast Cancer Res Treat. 2010;121:503–509. doi: 10.1007/s10549-008-0297-6. [DOI] [PubMed] [Google Scholar]
- Rodino-Klapac LR, Montgomery CL, Bremer WG, Shontz KM, Malik V, Davis N.et al. (2010Persistent expression of FLAG-tagged micro dystrophin in nonhuman primates following intramuscular and vascular delivery Mol Ther 18109–117. [DOI] [PMC free article] [PubMed] [Google Scholar]
- Uren AG, Mikkers H, Kool J, van der Weyden L, Lund AH, Wilson CH.et al. (2009A high-throughput splinkerette-PCR method for the isolation and sequencing of retroviral insertion sites Nat Protoc 4789–798. [DOI] [PMC free article] [PubMed] [Google Scholar]
Associated Data
This section collects any data citations, data availability statements, or supplementary materials included in this article.
Supplementary Materials
Histopathologic liver lesions.
Primers for vector copy number qPCR.
Primers for RT-PCR.