Abstract
DNA barcoding is an attractive technology as it allows sensitive and multiplexed target analysis. However, DNA barcoding of cellular proteins remains challenging, primarily because barcode amplification and readout techniques are often incompatible with the cellular microenvironment. Here, we describe the development and validation of a photocleavable DNA barcode-antibody conjugate method for rapid, quantitative and multiplexed detection of proteins in single live cells. Following target binding, this method allows DNA barcodes to be photoreleased in solution, enabling easy isolation, amplification and readout. As a proof of principle, we demonstrate sensitive and multiplexed detection of protein biomarkers in a variety of cancer cells.
The ability to detect scant proteins and antigens in single cells is becoming increasingly important in biological research, forensic science as well as in clinical diagnostics. Analyzing protein signatures at single-cell resolution would aid in studying the role of cellular heterogeneity in disease progression, stem cell differentiation, response to drugs as well as other cellular signaling processes.1 Clinically, accurate molecular profiling and proteomic analysis of rare cells (e.g. circulating tumor cells) holds considerable promise for early disease detection and monitoring treatment response.2 Thus, sensitive, reliable and multiplex-able protein detection technologies are currently in great demand.3
To date, several platforms for analyzing cellular proteins have been described.4 Although some recently developed methods have shown promise for single cell analysis,5 the majority of current methods are limited either by their need for large cell numbers or by their ability to simultaneously detect only few proteins. One enticing approach is DNA barcoding since a single DNA barcode can be detected through PCR amplification; infinite numbers of DNA bar-codes can be easily discriminated based either on their sequence and/or size.6, 7 Although DNA barcoding technology has been applied to the detection of soluble proteins via several different formats,6, 8, 9 the successful application of this technology to live cells has been rare.10
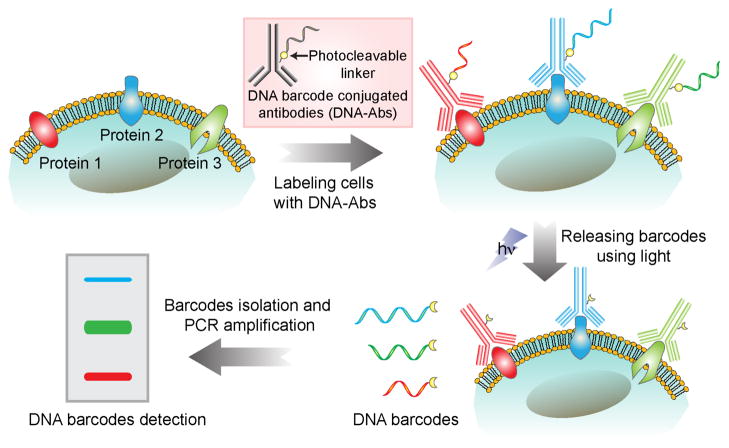
We hypothesized that DNA barcoding could be applied to live cell analysis by using a light-mediated barcode releasing technique, which would enable barcode amplification and readout to be readily carried out following target binding. We describe here the synthesis and validation of a DNA barcoding-based cellular protein detection method, which we term ‘light-mediated cellular barcoding’ (LMCB). The LMCB method relies on the use of antibodies conjugated to specific DNA barcodes through a photocleavable linker molecule for initial target recognition and subsequent bar-code amplification, following cleavage of the DNA-antibody. The generic concept of the LMCB method is shown in Scheme 1. Cells were first labeled with DNA barcode-antibody conjugates (DNA-Abs) targeted to specific protein biomarkers. Irradiation of the labeled cells with light (~365 nm) cleaves the linker between the antibodies and the bar-codes, causing the barcodes to be released into the solution for easy isolation. Barcodes amplification by PCR and subsequent gel electrophoresis analysis of the amplified barcodes allowed simultaneous detection and quantification of multiple protein analytes from single cells.
Scheme 1.
Schematic showing the light-mediated cellular bar-coding strategy. Protein targets were labeled with DNA-Abs and then photocleaved to release DNA barcodes. Amplified bar-codes were analyzed using gel electrophoresis for multiplexed detection of protein biomarkers from single cells.
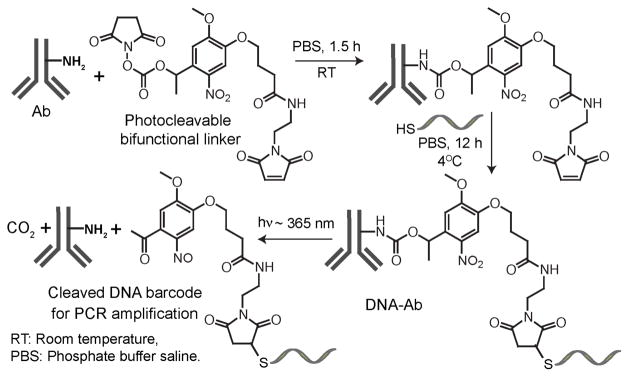
Scheme 2 summarizes the synthetic approach used for the preparation of DNA-Abs. Figure S1 shows the characterization of photocleavage reaction of the bifunctional linker by UV-Vis spectroscopy. For cancer cell analysis, antibodies against epidermal growth factor receptor (EGFR), epithelial cell adhesion molecule (EpCAM) and human epidermal growth factor receptor 2 (HER2/neu) were conjugated with 55, 70 and 85-base DNA barcodes, respectively (Figure S2). After barcode conjugation, we verified that the barcode-modified antibodies still efficiently recognize their specific targets in various cell lines (Figure S3).
Scheme 2.
Synthetic scheme of the antibody DNA conjugation and the photocleavage reaction leading to the barcode release.
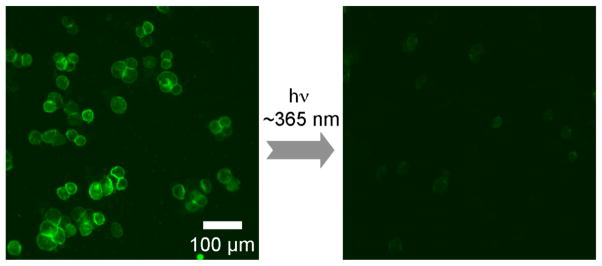
To demonstrate that the barcodes are indeed released upon light irradiation in intact live cells, we initially used fluorescent dye (FAM)-labeled DNA barcode conjugated anti-HER2 antibody (FAM-DNA-HER2). A strong fluorescence signal was seen emanating from the cell surface following incubation of SK-BR-3 cells (overexpressing surface marker HER2/neu) with FAM-DNA-HER2 (Figure 1, left), while our control experiment using HER2/neu negative MDA-MB-231 cells showed negligible fluorescence (Figure S4), indicating specific binding of the barcode-conjugated antibodies to target molecular markers. A microscope image taken after 10 minutes of light exposure to the stained SK-BR-3 cells showed a significant decrease in the fluorescence signal from the cells (Figure 1, right), resulting from the release of the fluorescent barcodes from the cells following photocleavage. DNA barcode release was complete within 15 minutes of light exposure, as measured by flow cytometry (Figure S5a). Control experiment performed with a non photocleavable anti-HER2 antibody showed a minimal decrease of fluorescence over time (Figure S5b), indicating that the barcode release is a consequence of the photolytic cleavage of the linker molecule.
Figure 1.
Fluorescently labeled DNA barcodes conjugated to anti-HER2 antibodies were used to stain SK-BR-3 cells. A decreased fluorescence signal after light irradiation demonstrated that barcodes were released from the labeled cells. See Figure S4 for additional images including bright field images.
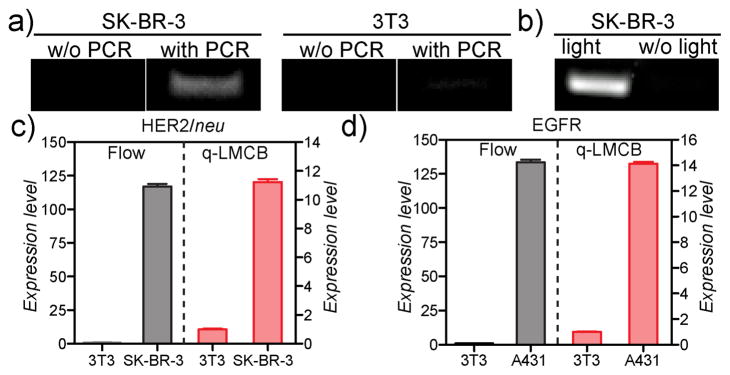
We subsequently applied the LMCB method to single cells, both SK-BR-3 (HER2/neuhigh) and control fibro-blast 3T3 (HER2/neulow) cells, using the 85-base DNA bar-code-conjugated anti-HER2 (85bDNA-HER2) antibody. After labeling cells with 85bDNA-HER2 antibody against HER2/neu, cells were photocleaved for 15 minutes. Released barcodes were separated from cells via centrifugation (at 300 × g, 3 min). PCR was then performed to amplify the 85-base DNA barcodes. The target marker (HER2/neu), which was previously undetectable, could be readily detected from single SK-BR-3 cells after ~25 cycles of PCR; as shown in Figure 2a, a band was seen on the gel corresponding to the 85-base DNA barcode. In contrast, even after 25 cycles of PCR amplification, 3T3 cells failed to show a significant band for the 85-base DNA barcode, which is consistent with the very low expression of HER2/neu in these cells. Other control experiment with HER2/neu negative MDA-MB-231 cells likewise failed to show a significant barcode band following PCR amplification (Figure S6). Omitting the light irradiation step resulted in no detectable signal (Figure 2b), which confirmed the importance of photocleavage in the LMCB method. To quantitatively determine the expression level of different markers, we next performed SYBR® green-based quantitative LMCB (or qLMCB) on the DNA barcodes. Figure 2c shows the HER2/neu expression level in both SK-BR-3 and 3T3 cells, whereas Figure 2d shows the EGFR expression level in human epithelial carcinoma A431 and 3T3 cells. Expression levels determined using the qLMCB method were consistent with those obtained by flow cytometry, with the difference being that flow cytometry required much larger cell numbers for analysis (~105 cells for flow cytometry compared to ~1 cell for qLMCB). Overall, these results demonstrate that the protein signatures of single cells can be easily transformed into a detectable, quantifiable and reliable signal using the LMCB method.
Figure 2.
a) Detection of HER2/neu in SK-BR-3 cells. After 25 cycles of PCR, a DNA band corresponding to the 85-base bar-code was visible. Control 3T3 cells, consistent with their low expression of HER2/neu, had a minimal 85-base DNA band even after PCR amplification. b) No DNA band was detected in the absence of light irradiation, which demonstrated the critical role of light in the assay method. c) HER2/neu expression and d) EGFR expression (both relative to the control 3T3 cells) from qLMCB correlated well with results from standard flow cytometry-based detection. Error bars represent variation between duplicate measurements.
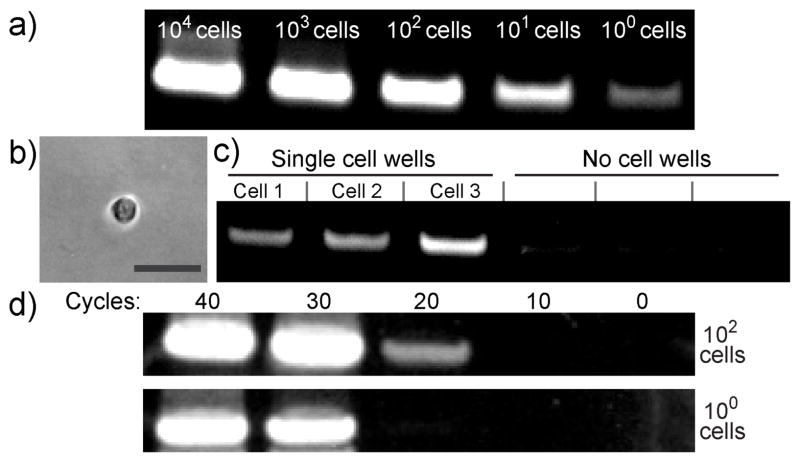
To determine the detection threshold of the LMCB method, we performed dilution experiments with SK-BR-3 cells. Cells were targeted using 85bDNA-HER2 antibody and photocleaved as previously described. Figure 3a shows the gel analysis following 25 cycles of PCR-amplified DNA bar-codes from different numbers of cells. A clear 85-base DNA band (varying in intensity depending on cell concentration) was observed for all samples, which ranged in cell number from 104 cells to single cells. To further verify the single cell sensitivity of the LMCB method, we performed cellular analysis in digital format. A dilute SK-BR-3 cell solution was distributed between many wells of a 384 well microplate, such that each well contained on average either a single cell or no cells. Wells were then imaged to identify single cell containing wells (Figure 3b). Barcodes isolated from the wells containing single SK-BR-3 cells produced a barcode band on the gel, whereas wells containing either no cells or control MDA-MB-231 cells (HER2/neu negative) failed to show a significant band following amplification (Figure 3c and Figure S6). This result indicates that LMCB method provides analysis of individual cells to characterize heterogeneities among a cell type (Figure S7). We also determined the effect of the number of PCR cycles on the detection sensitivity. As shown in Figure 3d, HER2/neu expression from 102 cells could be easily detected after 20 cycles of PCR, whereas for samples containing only single cells, ~30 cycles were required to obtain a detectable signal. This suggests that by adjusting the number of PCR amplification cycles, detection sensitivity could be increased, such that even relatively low abundance biomarkers could be detected in cells.
Figure 3.
Detection sensitivity of the LMCB method. a) After 25 cycles of PCR, the DNA barcodes from samples containing varying numbers of SK-BR-3 cells were detected b) Image showing a single SK-BR-3 cell inside a microplate well for digital analysis (scale bar 50 μm). c) Analysis of a single SK-BR-3 cell using the LMCB method in digital format. Following PCR amplification, an 85-base barcode could be detected in individual wells containing single cells (‘single cell wells’). In contrast, wells in which cells were absent (‘no cell wells’) failed to produce a significant band following amplification. d) Gel electrophoresis results showing the detection sensitivity of the LMCB method as a function of PCR cycle number.
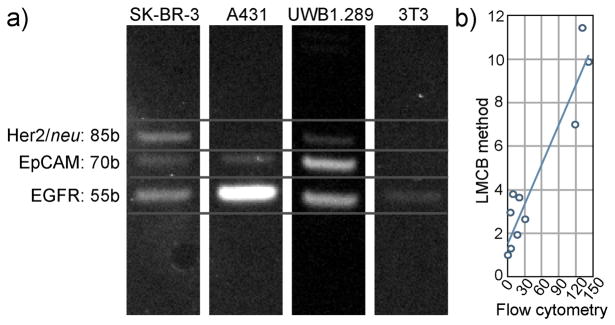
Commonly used multiplexing methods are largely reliant on the use of fluorescent labeled antibodies; this, however, allows only limited numbers of labels to be discriminated. In contrast, the use of DNA barcodes as labels for multiplexing represents an ideal platform since infinite numbers of DNA barcodes can be easily discriminated based either on their sequence and/or size. To test the LMCB method in a multiplexed format, we used barcodes conjugated antibodies for the simultaneous detection of EGFR, EpCAM and HER2/neu in four different cell lines. Cells were incubated with a cocktail of antibodies for respective target binding and then photocleaved for barcode release and isolation. Since all the barcodes have similar sequences towards the 5′ and 3′ end, the barcodes could then be simultaneously PCR-amplified using a single set of primer pairs (Figure S2).9b Following amplification, individual barcodes were separated by gel electrophoresis based on their size. Figure 4a shows that signals from individual biomarkers can be clearly distinguished from each other based on barcode size. Varying band intensities, corresponding to the expression level of biomarkers in different cells, are clearly evident in the gel. To verify the reliability of the multiplexed LMCB method, we compared the results to standard flow cytometry in 105 cells/experiment. As shown in Figure 4b, there was a good correlation between LMCB method and flow cytometry.
Figure 4.
a) Multiplexed protein detection using LMCB method. Individual biomarker signals (corresponding to their expression level) can be clearly distinguished from one other based on their barcode size. b) Comparison of LMCB measurements (from Figure 4a) and measurements taken by flow cytometry. For each biomarker, band intensities (normalized to control 3T3 cells) from the gel were plotted against fluorescent intensities (normalized to control 3T3 cells) from flow cytometry (R2 = 0.90).
In summary, we have developed a novel method (LMCB) that enables rapid, quantitative, multiplexed detection of protein expression in single live cells. The approach is robust and could be adapted to the analysis of other targets of interest such as soluble proteins and pathogens. It is also a relatively simple technique that does not require complex purification steps, during which analytes are often lost. Differently sized DNA barcodes are separated using size chromatography. Whilst this provides a clean and simple model system for validating technology, we ultimately anticipate either sequencing DNA barcodes to enable greater diversity, or using imaging approaches with digital color-coded bar-codes for multiplexing.7a
Supplementary Material
Acknowledgments
We thank H. J. Chung, K. S. Yang and K. Tran for helpful discussions. We thank Y. Fisher-Jeffes for reviewing the manuscript. This work was supported in part by National Institutes of Health (NIH) Grants 2P50CA086355-12, RO1EB010011 and TPEN contract HHSN268201000044C.
Footnotes
ASSOCIATED CONTENT
Experimental methods. This material is available free of charge via the Internet at http://pubs.acs.org.”
References
- 1.(a) Shackleton M, Quintana E, Fearon ER, Morrison SJ. Cell. 2009;138:822–829. doi: 10.1016/j.cell.2009.08.017. [DOI] [PubMed] [Google Scholar]; (b) Tay S, Hughey JJ, Lee TK, Lipniacki T, Quake SR, Covert MW. Nature. 2010;466:267–271. doi: 10.1038/nature09145. [DOI] [PMC free article] [PubMed] [Google Scholar]; (c) Abbas HA, Pant V, Lozano G. Cell Cycle. 2011;10:3257–3262. doi: 10.4161/cc.10.19.17721. [DOI] [PMC free article] [PubMed] [Google Scholar]
- 2.(a) Yu M, Stott S, Toner M, Maheswaran S, Haber DA. J Cell Biol. 2011;192:373–382. doi: 10.1083/jcb.201010021. [DOI] [PMC free article] [PubMed] [Google Scholar]; (b) Issadore D, Chung J, Shao H, Liong M, Ghazani AA, Castro CM, Weissleder R, Lee H. Sci Transl Med. 2012;4:141ra92. doi: 10.1126/scitranslmed.3003747. [DOI] [PMC free article] [PubMed] [Google Scholar]
- 3.(a) Wu M, Singh AK. Curr Opin Biotechnol. 2012;23:83–88. doi: 10.1016/j.copbio.2011.11.023. [DOI] [PMC free article] [PubMed] [Google Scholar]; (b) Altelaar AF, Heck AJ. Curr Opin Chem Biol. 2012;16:206–213. doi: 10.1016/j.cbpa.2011.12.011. [DOI] [PubMed] [Google Scholar]
- 4.(a) Koob AO, Bruns L, Prassler C, Masliah E, Klopstock T, Bender A. Anal Biochem. 2012;425:120–124. doi: 10.1016/j.ab.2012.02.034. [DOI] [PMC free article] [PubMed] [Google Scholar]; (b) Homola J. Chem Rev. 2008;108:462–493. doi: 10.1021/cr068107d. [DOI] [PubMed] [Google Scholar]; (c) Thurer R, Vigassy T, Hirayama M, Wang J, Bakker E, Pretsch E. Anal Chem. 2007;79:5107–5110. doi: 10.1021/ac070932m. [DOI] [PubMed] [Google Scholar]; (d) Ellerbee AK, Phillips ST, Siegel AC, Mirica KA, Martinez AW, Striehl P, Jain N, Prentiss M, Whitesides GM. Anal Chem. 2009;81:8447–8452. doi: 10.1021/ac901307q. [DOI] [PubMed] [Google Scholar]; (e) Haun JB, Castro CM, Wang R, Peterson VM, Marinelli BS, Lee H, Weissleder R. Sci Transl Med. 2011;3:71ra16. doi: 10.1126/scitranslmed.3002048. [DOI] [PMC free article] [PubMed] [Google Scholar]; (f) Rosi NL, Mirkin CA. Chem Rev. 2005;105:1547–1562. doi: 10.1021/cr030067f. [DOI] [PubMed] [Google Scholar]; (g) Rotem D, Jayasinghe L, Salichou M, Bayley H. J Am Chem Soc. 2012;134:2781–2787. doi: 10.1021/ja2105653. [DOI] [PMC free article] [PubMed] [Google Scholar]
- 5.(a) Bendall SC, Simonds EF, Qiu P, Amir e-AD, Krutzik PO, Finck R, Bruggner RV, Melamed R, Trejo A, Ornatsky OI, Balderas RS, Plevritis SK, Sachs K, Pe’er D, Tanner SD, Nolan GP. Science. 2011;332:687–696. doi: 10.1126/science.1198704. [DOI] [PMC free article] [PubMed] [Google Scholar]; (b) Shi Q, Qin L, Wei W, Geng F, Fan R, Shin YS, Guo D, Hood L, Mischel PS, Heath JR. Proc Natl Acad Sci U S A. 2012;109:419–424. doi: 10.1073/pnas.1110865109. [DOI] [PMC free article] [PubMed] [Google Scholar]
- 6.Nam JM, Thaxton CS, Mirkin CA. Science. 2003;301:1884–1886. doi: 10.1126/science.1088755. [DOI] [PubMed] [Google Scholar]
- 7.(a) Geiss GK, Bumgarner RE, Birditt B, Dahl T, Dowidar N, Dunaway DL, Fell HP, Ferree S, George RD, Grogan T, James JJ, Maysuria M, Mitton JD, Oliveri P, Osborn JL, Peng T, Ratcliffe AL, Webster PJ, Davidson EH, Hood L, Dimitrov K. Nat Biotechnol. 2008;26:317–325. doi: 10.1038/nbt1385. [DOI] [PubMed] [Google Scholar]; (b) Venkatesan BM, Bashir R. Nat Nanotechnol. 2011;6:615–624. doi: 10.1038/nnano.2011.129. [DOI] [PubMed] [Google Scholar]
- 8.(a) Wacker R, Ceyhan B, Alhorn P, Schueler D, Lang C, Niemeyer CM. Biochem Biophys Res Commun. 2007;357:391–396. doi: 10.1016/j.bbrc.2007.03.156. [DOI] [PubMed] [Google Scholar]; (b) Fredriksson S, Dixon W, Ji H, Koong AC, Mindrinos M, Davis RW. Nat Methods. 2007;4:327–329. doi: 10.1038/nmeth1020. [DOI] [PubMed] [Google Scholar]
- 9.(a) Sano T, Smith CL, Cantor CR. Science. 1992;258:120–122. doi: 10.1126/science.1439758. [DOI] [PubMed] [Google Scholar]; (b) Hendrickson ER, Truby TM, Joerger RD, Majarian WR, Ebersole RC. Nucleic Acids Res. 1995;23:522–529. doi: 10.1093/nar/23.3.522. [DOI] [PMC free article] [PubMed] [Google Scholar]
- 10.(a) Kazane SA, Sok D, Cho EH, Uson ML, Kuhn P, Schultz PG, Smider VV. Proc Natl Acad Sci U S A. 2012;109:3731–3736. doi: 10.1073/pnas.1120682109. [DOI] [PMC free article] [PubMed] [Google Scholar]; (b) Konry T, Smolina I, Yarmush JM, Irimia D, Yarmush ML. Small. 2011;7:395–400. doi: 10.1002/smll.201001620. [DOI] [PMC free article] [PubMed] [Google Scholar]
Associated Data
This section collects any data citations, data availability statements, or supplementary materials included in this article.


