

Abstract
Membrane proteins regulate many cellular processes including signaling cascades, ion transport, membrane fusion, and cell-to-cell communications. Understanding the architecture and conformational fluctuations of these proteins is critical to understanding their regulation and functions. Fluorescence methods including intensity mapping, fluorescence resonance energy transfer, and photo-induced electron transfer, allow for targeted measurements of domains within membrane proteins. These methods can reveal how a protein is structured and how it transitions between different conformational states. Here, I will review recent work done using fluorescence to map the structures of membrane proteins, focusing on how each of these methods can be applied to understanding the dynamic nature of individual membrane proteins and protein complexes.
Introduction
There are currently many of unique membrane protein structures in the protein database. The number and diversity of these structures are constantly expanding while their quality is increasing. With advances in rapid screening techniques and improved analysis tools, it is possible that over the next decade a representative high-resolution structure of each of the major membrane protein groups will be solved. High resolution structures have provided an atomic view of membrane proteins, their topology, and the specific residues critical to their function. These structures have placed a large body of research into an architectural framework, clarifying complex and sometimes contradictory results from physiology and the biochemical analysis of membrane proteins. Structures further highlight the degree to which the linear sequence of a protein can assemble into a complex, and sometimes unexpected, three dimensional fold [1]. In some instances, membrane proteins have been crystallized in the presence of lipids, demonstrating how the complex chemistry of the membrane can influence the structure and behavior of membrane proteins [2-4].
While high-resolution structures are the cornerstone for understanding how a membrane protein works, they are only a starting point to fully unravel a protein’s complex behavior. Each new structure provides many answers and generates many new questions. X-ray Structures provide a snap shot of one conformation of a protein frozen in time. Proteins are highly dynamic and move between many conformational states [5-7]. Furthermore, their motions and fluctuations influence their function [8]. Finally, many proteins have unstructured or flexible domains that are not resolved by crystallography or NMR. It is also difficult to unambiguously link a structure to a functional state of a protein. While NMR can provide information about dynamics, the technical hurdles of obtaining a high resolution 3D NMR structure, including size constraints, the large amount of protein required for an experiment, and the difficulty in residue assignments, has made NMR challenging to use for membrane proteins.
Over the next decade, one of the challenges for structural biology will be using high-resolution structures as guides to inform and direct other structural methods. By applying complementary methods to high-resolution structures, these static images can be transformed into dynamic moving pictures. Techniques including fluorescence, small-angle x-ray scattering, electron paramagnetic resonance, electron microscopy, and computational modeling can all provide the additional information necessary to fully map the landscape of a membrane protein’s conformational transitions. Furthermore, many of these methods can be used in membranes and living cells, allowing for the study of proteins in their native membrane environment [9*]. Fluorescence spectroscopy in particular has become a primary technique useful for tracking the architecture and structural rearrangements of membrane proteins [10]. In this review I will discuss three fluorescence methods that can be applied to the study of membrane structure. I will discuss what these methods have revealed about the structures and conformations of membrane proteins, review the advantages and disadvantages of each method, and present practical considerations for their use and future prospects for their development.
Quantum yield and spectral shifts for mapping membrane protein movements
A fluorophore is a chemical that can first absorb energy of one wavelength (a photon) and then release that energy as a longer wavelength (lower energy photon) [11]. This shift from excitation wavelength to emission wavelength is called the stokes shift. The ability of a fluorophore to absorb encountered light is known as the extinction coefficient. Once energy is absorbed, the fluorophore has some probability less than one of releasing this absorbed energy as light. This characteristic is called the quantum yield. Together, these properties dictate the basic fluorescent properties (brightness and spectra) of an individual fluorescent dye [11].
The fluorescence of many dyes can be modulated by environmental factors [12]. These factors include soluble quenchers, pH, and the local chemical environment. Thus, when a fluorophore moves from one position to another, moving from one local environment to another, a change in the emission strength or peak emission wavelength of a fluorophore can result. In this regard, tracking the brightness (quantum yield) or spectrum (stokes shift) of a fluorophore are key methods for mapping a protein’s structure with fluorescence (Figure 1). Some of the earliest structural measurements that use fluorescence took advantage of intrinsic changes in a dye’s fluorescence [13-17]. Similarly, intrinsic changes in the fluorescence of the native amino acid tryptophan have been used to map structures [18].
Figure 1.
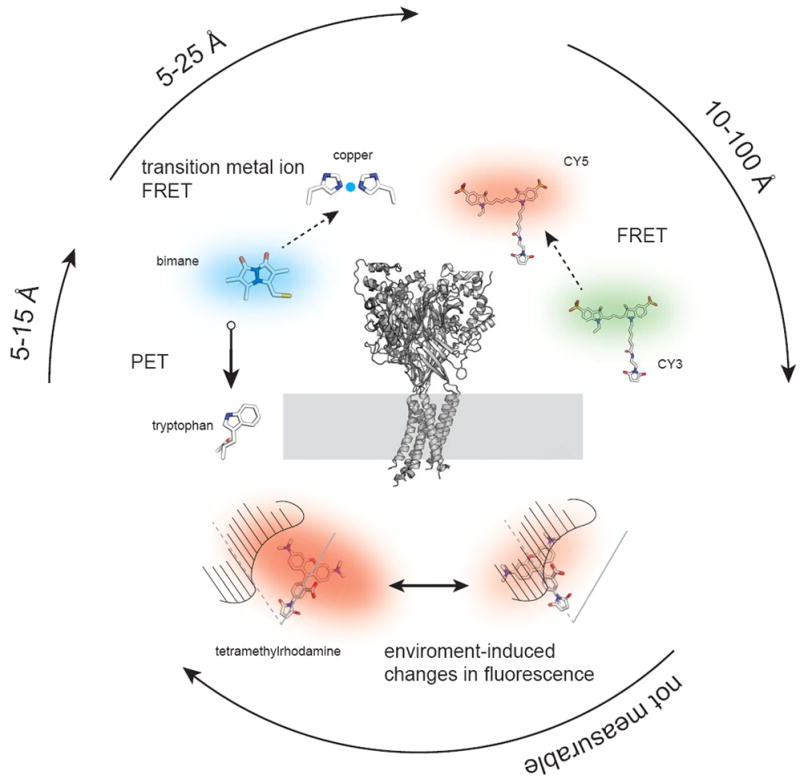
Fluorescent methods used to explore a membrane protein structure. In the center is the crystal structure of the acid sensing ion channel ASICS1 (PDB 2QTS) positioned with its transmembrane domains in a membrane [61]. Surrounding the structure are example fluorescent methods including FRET between the two fluorescent dyes Cy3 and Cy5, transition metal ion FRET between the dye bimane and a di-histidine bound metal, photo-induced electron transfer (PET) between bimane and a tryptophan, and a tetramethyl-rhodamine fluorophore undergoing an environment-induced fluorescent change. The approximate distance scales that each technique works over are indicated by the surrounding arrows.
In these experiments, fluorophores first need to be attached to proteins at defined sites. This is usually done with cysteine chemistry [19]. Native or engineered cysteines can be modified with cysteine-reactive fluorophores. Maleimide-fluorophores in particular exhibit rapid, robust, and stable labeling of free cysteines in proteins. Alternative labeling schemes include genetically tagging the protein with fluorescent proteins, the use of bis-arsenical dyes, or introducing artificial fluorescent amino acids into a protein [20]. The emission spectra or intensity of these site-specific fluorophores can then be measured with microscopy or spectroscopy [21]. A drawback of these methods is that there is no way to directly quantify how a specific fluorescence change observed at an individual fluorophore-labeled site relates to the conformational change in the protein’s structure. The size and the direction of a conformational change are not necessarily proportional to the fluorescence change. Wavelength shifts in fluorophores are more predictable. Blue shifts in a spectrum generally indicate that the fluorophore is experiencing a more hydrophobic local environment. Because of the uncertainty in the response of fluorescent dyes to structural changes, these measurements are much better at highlighting residues or regions that move during a conformational change and how these general movements correlate to the activation state of the protein, e.g. their kinetics. They are, however, not well suited to track exact distances or relational movements within a protein.
Some of the first experiments that used intrinsic fluorescence to track conformational changes in a membrane protein were done on the voltage gated potassium channel [13,14,16,22]. In these channels, membrane depolarization induces a conformational rearrangement of a positively charged S4 transmembrane helix. The outward movement of this helix was proposed to stabilize the open state of the channel. To test for a conformational change in the S4 helix, two groups used a combination of site-specific fluorescent labeling and electrophysiology to measure movements of the S4 helix during voltage activation. This technique, called voltage-clamp fluorometry, allows for the simultaneous measurement of the channel’s function with electrophysiology and structural changes with fluorescence. The power of this method is that fluorescence can indicate how conformational changes are correlated in time to the function of the channel. Again, while quantum yield measurements cannot map the magnitude or direction of a movement, they can provide clues. For example, spectral blue shifts indicate a residue is repositioning to a more hydrophobic environment. Additionally, if a collection of residues all show an extremely large and coordinated changes, this is generally a sign that the group of residues is experiencing a coordinated and dramatic conformational change [23]. This type of analysis was used as a guide to model the resting state of a potassium channel [23]. Other membrane proteins have been mapped with intensity measurements. These include voltage-gated sodium channels, voltage gated proton channels, ligand-gated ion channels, voltage-activated phosphatases, g-protein coupled receptors, and glutamate transporters [24-31]. In each case, site-specific labeling was coupled with functional manipulation of the protein to study how the protein rearranges. Recent work has combined single molecule measurements to gauge the behavior of even single channels [15,32].
Aside from intrinsic changes in fluorescence, the output of a fluorophore can be modulated by chemical quenchers. For example, soluble ions including iodide, and chemicals including acrylimide, will act as quenchers of fluorophores. The quenching of fluorophores by these added chemicals has been used to test for the exposure of labeled residues to the solvent [22,30]. If a residue has access to the solvent, the fluorescence should be reduced if quenchers are added. The magnitude of quenching, however, does not necessarily dependent on the degree of solvent exposure. Other factors, including electrostatics, can effect quenching [30]. Thus, like intrinsic fluorescence changes, the use of soluble quenchers can reveal a change in structure, and hint to the direction of that change, but it is not a useful method for specific distance measurements.
Energy transfer to map angstrom-scale distances in membrane proteins
Another primary fluorescence method used to determine the structure of a protein is fluorescence resonance energy transfer (FRET) [33]. FRET is the excited state transfer of excitation energy from one fluorphore to an acceptor molecule (Figure 1). This transfer of energy is dependent on several factors, including the spectral overlap between the donor and the acceptor, the orientation of the two dipoles, and most importantly, the distance between the two probes [11]. The extremely steep distance dependence of FRET has made it a powerful technique for mapping protein structures and dynamics. In this section, I will review recent work using FRET to map the structures of membrane proteins, discuss possible problems encountered in these experiments, and suggest methods that can be used to mitigate these problems.
The first consideration in using resonance energy transfer is that unlike the method discussed above, two separate probes need to be introduced into the experimental system. This can be done in two general ways. First, one fluorophore can be introduced into the protein and a second probe can be added to the membrane or solution [34**,35]. Alternatively, two (or more) probes can be introduced into the same protein or protein complex. Labeling one protein with two dyes is more difficult and has been accomplished in several ways. For example, reactive donor dyes can be introduced at very low concentrations relative to the acceptor to ensure that individual proteins are not labeled with two donors [36,37]. This is important because labeling a population of proteins with two donors can severely perturb FRET measurements. In this labeling scheme, many proteins will be labeled with two acceptors, a fraction will be labeled with one donor and one acceptor, and it is hoped no proteins will be labeled with two donors. A modification of this method takes advantage of the reaction kinetics of individual cysteines. For example, a fast-reacting cysteine can be labeled first with a donor, and then slower reacting cysteines can be reacted later with the acceptor [37]. In extreme cases, cysteines are completely protected from modification when the protein is in one state but are reactive in another state [30,35]. In these instances, the cysteine can be labeled when the protein is occupying the reactive state. In either case, the proportion of donors to acceptors can be controlled. Another technique takes advantage of genetically encoded fluorophores to add one of the probes and a reactive cysteine to add the second [10,35,38]. Alternatively, two genetically encoded fluorophores can be used [39]. In transition metal ion FRET, the donor is a single cysteine-modified fluorophore and the acceptor is a metal bound to an engineered di-histidine metal binding site (Figure 1) [40*,41]. Recent work, also using transition metal ions, has developed a novel method to protect specific cysteines in a protein with engineered cadmium binding sites [42*]. In this work, cadmium-bound cysteines did not react with the fluorophore, and free cysteines reacted. This method allows for the targeted labeling of a specific cysteine in a protein and should open the door to robust two-dye FRET measurements within individual populations of proteins.
For membrane proteins, two general methods have been used to quantify FRET signals. One method, called donor-quenching, relies on the fact that the fluorescence of the donor decreases proportionally to the amount of FRET occurring in the system. In this regard, the amount of FRET can be calculated from the amount of donor that is quenched when the acceptor is present. Similar to donor quenching measurements, FRET causes a decrease in the donor’s excited state lifetime. Thus, measuring a decrease in a donor’s lifetime can be used to quantify FRET signals. The second method for quantifying FRET signals is called acceptor sensitization. In these experiments the fluorescence from the acceptor is measured when the donor is excited. The amount of fluorescence from the acceptor increases as FRET increases. Various methods have been devised to specifically extract the fluorescence from the acceptor that is due to FRET [10].
Like quantum yield measurements, some of the earliest FRET measurements in membrane proteins were done in voltage-gated potassium channels [17]. For these studies, a variant of FRET that utilizes luminescent metals (lanthanide resonance energy transfer or LRET) was used to track distances and distance changes in the protein [43]. A cysteine reactive group that bound to lanthanide ions was introduced into the channel, and a fluorophore-labeled channel-binding toxin was added as an acceptor probe. LRET was then used to map the structure of the channel in the open and closed states. Further work on these channels used FRET between fluorophore-labeled channels and a dye added to the membrane [34*,44]. Similar work was done in cyclic-nucleotide-gated ion channels [35]. In these experiments, small but significant movements were detected during the channel’s gating.
Measuring distances within a molecule with FRET has been troublesome. Several considerations must be made if data derived from FRET is to be used to accurately reconstruct the structure of a protein. For example, common fluorophores are quite large. Cyanine-based dyes such as Cy5 are ~22 angstroms in diameter and are generally attached to proteins by long (15 angstrom) very flexible multi-carbon linkers. While these linkers allow free rotation of the dye, they can contribute to significant errors when interpreting FRET data. This is because distances in proteins are generally reported for the residue that the dye is attached to and not the dye’s emission or absorption dipoles. In an extreme case, the dipoles might be tens of angstroms from the attachment site of the dye. While it is clear that FRET accurately reports distances between two dipoles, the question remains as to where those dipoles are in space relative to the protein backbone during the measurement. The use of smaller dyes that still maintain conformational flexibility (i.e. do not pack into one conformation on the protein’s surface) during the excited state lifetime of the fluorophore can help mitigate errors associated with using larger dyes [41]. The use of larger dyes can skew distance measurements and lead to severe underestimations of the magnitude of a conformational change that occurs in a protein. Thus, the use of smaller probes that more accurately map the structure of the backbone is critical. Large dyes have been used, but modeling needs to be done to orient the fluorophore in the context of the protein [45-46,47*,48]. Other techniques including Bayesian probability mapping and molecular dynamics simulations also have been used to predict the effects of large, chemically complex, and flexible fluorophores on FRET [49-51].
Some of the most exciting recent work using FRET in membrane proteins has been done with single molecule fluorescence measurements. In these studies, x-ray or NMR structures were used in combination with FRET to determine the structure, topology, and dynamics of single proteins in a membrane-like environment [47*,52**,53,54**]. Single molecule measurements have the ability to track individual proteins as they move between unique states, a method similar in spirit to single channel recordings [7]. Specifically, the stochastic behavior of individual proteins can be followed over time. Generally, individual molecules are expressed in bacteria, labeled with dyes, embedded in a lipid micelle, bicelle, or placed into a supported bilayer. These single molecules then can be imaged with total internal reflection fluorescence microscopy or confocal microcopy. The correlated changes in the donor and acceptor fluorophore then can be tracked. These measurements are limited to the speed of acquisition. This generally places a lower limit of ~1 millisecond/frame for a point source microscope, and ~20 milliseconds/frame for a widefield microscope. Thus, any motions that occur over faster time scales will be missed. Single molecule FRET measurements recently have been used to watch the dynamics of SNARE proteins involved in membrane fusion and membrane transporters as they move substrate across the membrane [9*,46,47*,48,52**,53,54**].
Another energy transfer technique that has been used for studying the structure of membrane proteins is photon-induced electron transfer (PET) (Figure 1) [55]. In electron transfer, a donor fluorophore transfers excited state energy to an acceptor through a quantum mechanical transfer or exchange of an electron. This process decreases the fluorescence emission of the donor. For example, the small fluorophore bimane can undergo photo-induced electron transfer if it is very close to a tryptophan residue [56-59]. This has been used to look for conformational changes in membrane proteins. Unlike FRET, it is difficult to correlate the amount of quenching due to PET to the exact distances between the two probes. These measurements are generally interpreted as a range of distances between the two probes, for example 0-5 angstroms, 5-15 angstroms, and over 15 angstroms [60]. Aside from this caveat, the ease of using a native amino acid as a quenching group has made this method a robust and powerful technique for mapping structures.
Conclusion
Fluorescence methods have provided a view into the dynamic nature of membrane proteins. As a group of techniques, they allow site-specific probing of domains within proteins with millisecond time resolution. Using structures as guides, fluorescence can test which parts of a protein move and how those movements are correlated to the functional states of the protein. Each method discussed in this review has advantages and disadvantages. Intensity measurements are relatively easy to perform but do not provide the accurate mapping of distance. FRET is accurate to an angstrom-scale resolution. It is, however, a more challenging technique to implement. PET provides a middle ground of distance mapping and has ease of labeling. The distances generated from PET, however, are not as precise as FRET. Together, all these methods provide a range of choices to explore the dynamic structure of a protein. The continued development of new methods for specifically labeling proteins and new optical methods is opening the door to a future of exploring membrane protein structures in living cells in real time.
Highlights.
Fluorescence spectroscopy can be used to map the structure of a membrane protein.
Three primary methods are presented: 1) intensity measurements, 2) fluorescence resonance energy transfer, and 3) photo-induced electron transfer.
Fluorescence can provide information about the dynamics of a system.
Acknowledgments
J.W. Taraska is supported by the intramural research program at the National Heart Lung and Blood Institute, National Institutes of Health.
Footnotes
Publisher's Disclaimer: This is a PDF file of an unedited manuscript that has been accepted for publication. As a service to our customers we are providing this early version of the manuscript. The manuscript will undergo copyediting, typesetting, and review of the resulting proof before it is published in its final citable form. Please note that during the production process errors may be discovered which could affect the content, and all legal disclaimers that apply to the journal pertain.
References
- 1.Sobolevsky AI, Rosconi MP, Gouaux E. X-ray structure, symmetry and mechanism of an AMPA-subtype glutamate receptor. Nature. 2009;462:745–756. doi: 10.1038/nature08624. [DOI] [PMC free article] [PubMed] [Google Scholar]
- 2.Gonen T, Cheng Y, Sliz P, Hiroaki Y, Fujiyoshi Y, Harrison SC, Walz T. Lipid-protein interactions in double-layered two-dimensional AQP0 crystals. Nature. 2005;438:633–638. doi: 10.1038/nature04321. [DOI] [PMC free article] [PubMed] [Google Scholar]
- 3.Hansen SB, Tao X, MacKinnon R. Structural basis of PIP2 activation of the classical inward rectifier K+ channel Kir2.2. Nature. 2011;477:495–498. doi: 10.1038/nature10370. [DOI] [PMC free article] [PubMed] [Google Scholar]
- 4.Long SB, Tao X, Campbell EB, MacKinnon R. Atomic structure of a voltage-dependent K+ channel in a lipid membrane-like environment. Nature. 2007;450:376–382. doi: 10.1038/nature06265. [DOI] [PubMed] [Google Scholar]
- 5.Hille B. Ion channels of excitable membranes. 3. Sunderland, Mass: Sinauer; 2001. [Google Scholar]
- 6.Henzler-Wildman K, Kern D. Dynamic personalities of proteins. Nature. 2007;450:964–972. doi: 10.1038/nature06522. [DOI] [PubMed] [Google Scholar]
- 7.Sakmann B, Neher E. Single-channel recording. 2. New York, NY: Springer; 2009. [Google Scholar]
- 8.Henzler-Wildman KA, Lei M, Thai V, Kerns SJ, Karplus M, Kern D. A hierarchy of timescales in protein dynamics is linked to enzyme catalysis. Nature. 2007;450:913–916. doi: 10.1038/nature06407. [DOI] [PubMed] [Google Scholar]
- *9.Sakon JJ, Weninger KR. Detecting the conformation of individual proteins in live cells. Nat Methods. 2010;7:203–205. doi: 10.1038/nmeth.1421. In this paper, a fluorphore-labeled SNARE protein, SNAP-25, was microinjected into living cells. Intramolecular FRET was then used to probe the conformation of single membrane proteins. [DOI] [PMC free article] [PubMed] [Google Scholar]
- 10.Taraska JW, Zagotta WN. Fluorescence applications in molecular neurobiology. Neuron. 2010;66:170–189. doi: 10.1016/j.neuron.2010.02.002. [DOI] [PMC free article] [PubMed] [Google Scholar]
- 11.Lakowicz JR. Principles of fluorescence spectroscopy. 3. New York: Springer; 2006. [Google Scholar]
- 12.Turro NJ, Ramamurthy V, Scaiano JC. Modern molecular photochemistry of organic molecules. Sausalito, Calif: University Science Books; 2009. [Google Scholar]
- 13.Mannuzzu LM, Moronne MM, Isacoff EY. Direct physical measure of conformational rearrangement underlying potassium channel gating. Science. 1996;271:213–216. doi: 10.1126/science.271.5246.213. [DOI] [PubMed] [Google Scholar]
- 14.Glauner KS, Mannuzzu LM, Gandhi CS, Isacoff EY. Spectroscopic mapping of voltage sensor movement in the Shaker potassium channel. Nature. 1999;402:813–817. doi: 10.1038/45561. [DOI] [PubMed] [Google Scholar]
- 15.Sonnleitner A, Mannuzzu LM, Terakawa S, Isacoff EY. Structural rearrangements in single ion channels detected optically in living cells. Proc Natl Acad Sci U S A. 2002;99:12759–12764. doi: 10.1073/pnas.192261499. [DOI] [PMC free article] [PubMed] [Google Scholar]
- 16.Cha A, Bezanilla F. Characterizing voltage-dependent conformational changes in the Shaker K+ channel with fluorescence. Neuron. 1997;19:1127–1140. doi: 10.1016/s0896-6273(00)80403-1. [DOI] [PubMed] [Google Scholar]
- 17.Cha A, Snyder GE, Selvin PR, Bezanilla F. Atomic scale movement of the voltage-sensing region in a potassium channel measured via spectroscopy. Nature. 1999;402:809–813. doi: 10.1038/45552. [DOI] [PubMed] [Google Scholar]
- 18.Chapman ER, Davis AF. Direct interaction of a Ca2+-binding loop of synaptotagmin with lipid bilayers. J Biol Chem. 1998;273:13995–14001. doi: 10.1074/jbc.273.22.13995. [DOI] [PubMed] [Google Scholar]
- 19.Hermanson GT. Bioconjugate techniques. San Diego: Academic Press. 1996 [Google Scholar]
- 20.Crivat G, Taraska JW. Imaging proteins inside cells with fluorescent tags. Trends Biotechnol. 2012;30:8–16. doi: 10.1016/j.tibtech.2011.08.002. [DOI] [PMC free article] [PubMed] [Google Scholar]
- 21.Zheng J, Zagotta WN. Patch-clamp fluorometry recording of conformational rearrangements of ion channels. Sci STKE. 2003;2003:PL7. doi: 10.1126/stke.2003.176.pl7. [DOI] [PubMed] [Google Scholar]
- 22.Cha A, Bezanilla F. Structural implications of fluorescence quenching in the Shaker K+ channel. J Gen Physiol. 1998;112:391–408. doi: 10.1085/jgp.112.4.391. [DOI] [PMC free article] [PubMed] [Google Scholar]
- 23.Pathak MM, Yarov-Yarovoy V, Agarwal G, Roux B, Barth P, Kohout S, Tombola F, Isacoff EY. Closing in on the resting state of the Shaker K(+) channel. Neuron. 2007;56:124–140. doi: 10.1016/j.neuron.2007.09.023. [DOI] [PubMed] [Google Scholar]
- 24.Chanda B, Asamoah OK, Bezanilla F. Coupling interactions between voltage sensors of the sodium channel as revealed by site-specific measurements. J Gen Physiol. 2004;123:217–230. doi: 10.1085/jgp.200308971. [DOI] [PMC free article] [PubMed] [Google Scholar]
- 25.Villalba-Galea CA, Miceli F, Taglialatela M, Bezanilla F. Coupling between the voltage-sensing and phosphatase domains of Ci-VSP. J Gen Physiol. 2009;134:5–14. doi: 10.1085/jgp.200910215. [DOI] [PMC free article] [PubMed] [Google Scholar]
- 26.Kohout SC, Ulbrich MH, Bell SC, Isacoff EY. Subunit organization and functional transitions in Ci-VSP. Nat Struct Mol Biol. 2008;15:106–108. doi: 10.1038/nsmb1320. [DOI] [PubMed] [Google Scholar]
- 27.Kohout SC, Bell SC, Liu L, Xu Q, Minor DL, Jr, Isacoff EY. Electrochemical coupling in the voltage-dependent phosphatase Ci-VSP. Nat Chem Biol. 2010;6:369–375. doi: 10.1038/nchembio.349. [DOI] [PMC free article] [PubMed] [Google Scholar]
- 28.Tombola F, Ulbrich MH, Kohout SC, Isacoff EY. The opening of the two pores of the Hv1 voltage-gated proton channel is tuned by cooperativity. Nat Struct Mol Biol. 2010;17:44–50. doi: 10.1038/nsmb.1738. [DOI] [PMC free article] [PubMed] [Google Scholar]
- 29.Muroi Y, Arcisio-Miranda M, Chowdhury S, Chanda B. Molecular determinants of coupling between the domain III voltage sensor and pore of a sodium channel. Nat Struct Mol Biol. 2010;17:230–237. doi: 10.1038/nsmb.1749. [DOI] [PMC free article] [PubMed] [Google Scholar]
- 30.Zheng J, Zagotta WN. Gating rearrangements in cyclic nucleotide-gated channels revealed by patch-clamp fluorometry. Neuron. 2000;28:369–374. doi: 10.1016/s0896-6273(00)00117-3. [DOI] [PubMed] [Google Scholar]
- 31.Larsson HP, Tzingounis AV, Koch HP, Kavanaugh MP. Fluorometric measurements of conformational changes in glutamate transporters. Proc Natl Acad Sci U S A. 2004;101:3951–3956. doi: 10.1073/pnas.0306737101. [DOI] [PMC free article] [PubMed] [Google Scholar]
- 32.Blunck R, McGuire H, Hyde HC, Bezanilla F. Fluorescence detection of the movement of single KcsA subunits reveals cooperativity. Proc Natl Acad Sci U S A. 2008;105:20263–20268. doi: 10.1073/pnas.0807056106. [DOI] [PMC free article] [PubMed] [Google Scholar]
- 33.Selvin PR. Fluorescence resonance energy transfer. Methods Enzymol. 1995;246:300–334. doi: 10.1016/0076-6879(95)46015-2. [DOI] [PubMed] [Google Scholar]
- **34.Chanda B, Asamoah OK, Blunck R, Roux B, Bezanilla F. Gating charge displacement in voltage-gated ion channels involves limited transmembrane movement. Nature. 2005;436:852–856. doi: 10.1038/nature03888. In this work, FRET between a membrane embeeded FRET acceptor, DPA, was used to track the movement of the potassium channel voltage sensor helix in a living cell membrane. [DOI] [PubMed] [Google Scholar]
- 35.Taraska JW, Zagotta WN. Structural dynamics in the gating ring of cyclic nucleotide-gated ion channels. Nat Struct Mol Biol. 2007;14:854–860. doi: 10.1038/nsmb1281. [DOI] [PubMed] [Google Scholar]
- 36.Bruening-Wright A, Larsson HP. Slow conformational changes of the voltage sensor during the mode shift in hyperpolarization-activated cyclic-nucleotide-gated channels. J Neurosci. 2007;27:270–278. doi: 10.1523/JNEUROSCI.3801-06.2007. [DOI] [PMC free article] [PubMed] [Google Scholar]
- 37.Koch HP, Larsson HP. Small-scale molecular motions accomplish glutamate uptake in human glutamate transporters. J Neurosci. 2005;25:1730–1736. doi: 10.1523/JNEUROSCI.4138-04.2005. [DOI] [PMC free article] [PubMed] [Google Scholar]
- 38.Hoffmann C, Gaietta G, Bunemann M, Adams SR, Oberdorff-Maass S, Behr B, Vilardaga JP, Tsien RY, Ellisman MH, Lohse MJ. A FlAsH-based FRET approach to determine G protein-coupled receptor activation in living cells. Nat Methods. 2005;2:171–176. doi: 10.1038/nmeth742. [DOI] [PubMed] [Google Scholar]
- 39.An SJ, Almers W. Tracking SNARE complex formation in live endocrine cells. Science. 2004;306:1042–1046. doi: 10.1126/science.1102559. [DOI] [PubMed] [Google Scholar]
- *40.Taraska JW, Puljung MC, Olivier NB, Flynn GE, Zagotta WN. Mapping the structure and conformational movements of proteins with transition metal ion FRET. Nat Methods. 2009;6:532–537. doi: 10.1038/nmeth.1341. Here, small transition metal ions are used as FRET acceptors to map the fine-scale movement of cyclic-nucleotide-regulated ion channels. [DOI] [PMC free article] [PubMed] [Google Scholar]
- 41.Taraska JW, Puljung MC, Zagotta WN. Short-distance probes for protein backbone structure based on energy transfer between bimane and transition metal ions. Proc Natl Acad Sci U S A. 2009;106:16227–16232. doi: 10.1073/pnas.0905207106. [DOI] [PMC free article] [PubMed] [Google Scholar]
- *42.Puljung MC, Zagotta WN. Labeling of specific cysteines in proteins using reversible metal protection. Biophys J. 2011;100:2513–2521. doi: 10.1016/j.bpj.2011.03.063. In this work, a new method is presented that allows for the targeted labeling of individual cysteine residues by fluorophores. This method has the potential to allow for specific and controllable labeling of proteins with multiple fluorescent dyes. [DOI] [PMC free article] [PubMed] [Google Scholar]
- 43.Selvin PR. Principles and biophysical applications of lanthanide-based probes. Annu Rev Biophys Biomol Struct. 2002;31:275–302. doi: 10.1146/annurev.biophys.31.101101.140927. [DOI] [PubMed] [Google Scholar]
- 44.Chanda B, Blunck R, Faria LC, Schweizer FE, Mody I, Bezanilla F. A hybrid approach to measuring electrical activity in genetically specified neurons. Nat Neurosci. 2005;8:1619–1626. doi: 10.1038/nn1558. [DOI] [PubMed] [Google Scholar]
- 45.Boura E, Rozycki B, Herrick DZ, Chung HS, Vecer J, Eaton WA, Cafiso DS, Hummer G, Hurley JH. Solution structure of the ESCRT-I complex by small-angle X-ray scattering, EPR, and FRET spectroscopy. Proc Natl Acad Sci U S A. 2011;108:9437–9442. doi: 10.1073/pnas.1101763108. [DOI] [PMC free article] [PubMed] [Google Scholar]
- 46.Brunger AT, Strop P, Vrljic M, Chu S, Weninger KR. Three-dimensional molecular modeling with single molecule FRET. J Struct Biol. 2011;173:497–505. doi: 10.1016/j.jsb.2010.09.004. [DOI] [PMC free article] [PubMed] [Google Scholar]
- *47.Choi UB, Strop P, Vrljic M, Chu S, Brunger AT, Weninger KR. Single-molecule FRET-derived model of the synaptotagmin 1-SNARE fusion complex. Nat Struct Mol Biol. 2010;17:318–324. doi: 10.1038/nsmb.1763. Using single molecule FRET, the authors of this work were able to map and model the interaction between Synaptotagmin and the SNARE complex. [DOI] [PMC free article] [PubMed] [Google Scholar]
- 48.Vrljic M, Strop P, Ernst JA, Sutton RB, Chu S, Brunger AT. Molecular mechanism of the synaptotagmin-SNARE interaction in Ca2+-triggered vesicle fusion. Nat Struct Mol Biol. 2010;17:325–331. doi: 10.1038/nsmb.1764. [DOI] [PMC free article] [PubMed] [Google Scholar]
- 49.Muschielok A, Andrecka J, Jawhari A, Bruckner F, Cramer P, Michaelis J. A nano-positioning system for macromolecular structural analysis. Nat Methods. 2008;5:965–971. doi: 10.1038/nmeth.1259. [DOI] [PubMed] [Google Scholar]
- 50.Best RB, Merchant KA, Gopich IV, Schuler B, Bax A, Eaton WA. Effect of flexibility and cis residues in single-molecule FRET studies of polyproline. Proc Natl Acad Sci U S A. 2007;104:18964–18969. doi: 10.1073/pnas.0709567104. [DOI] [PMC free article] [PubMed] [Google Scholar]
- 51.Schroder GF, Alexiev U, Grubmuller H. Simulation of fluorescence anisotropy experiments: probing protein dynamics. Biophys J. 2005;89:3757–3770. doi: 10.1529/biophysj.105.069500. [DOI] [PMC free article] [PubMed] [Google Scholar]
- **52.Zhao Y, Terry D, Shi L, Weinstein H, Blanchard SC, Javitch JA. Single-molecule dynamics of gating in a neurotransmitter transporter homologue. Nature. 2010;465:188–193. doi: 10.1038/nature09057. In this work, FRET was used to map single LeuT transporters over time to measure the transporter’s dynamic conformational changes. [DOI] [PMC free article] [PubMed] [Google Scholar]
- 53.Zhao Y, Terry DS, Shi L, Quick M, Weinstein H, Blanchard SC, Javitch JA. Substrate-modulated gating dynamics in a Na+-coupled neurotransmitter transporter homologue. Nature. 2011;474:109–113. doi: 10.1038/nature09971. [DOI] [PMC free article] [PubMed] [Google Scholar]
- **54.Morrison EA, DeKoster GT, Dutta S, Vafabakhsh R, Clarkson MW, Bahl A, Kern D, Ha T, Henzler-Wildman KA. Antiparallel EmrE exports drugs by exchanging between asymmetric structures. Nature. 2012;481:45–50. doi: 10.1038/nature10703. Here, NMR was combined with FRET to determine the topoogy of the small membrane exporter EmrE. [DOI] [PMC free article] [PubMed] [Google Scholar]
- 55.Moser CC, Keske JM, Warncke K, Farid RS, Dutton PL. Nature of biological electron transfer. Nature. 1992;355:796–802. doi: 10.1038/355796a0. [DOI] [PubMed] [Google Scholar]
- 56.Mansoor SE, Farrens DL. High-throughput protein structural analysis using site-directed fluorescence labeling and the bimane derivative (2-pyridyl)dithiobimane. Biochemistry. 2004;43:9426–9438. doi: 10.1021/bi036259m. [DOI] [PubMed] [Google Scholar]
- 57.Mansoor SE, McHaourab HS, Farrens DL. Mapping proximity within proteins using fluorescence spectroscopy. A study of T4 lysozyme showing that tryptophan residues quench bimane fluorescence. Biochemistry. 2002;41:2475–2484. doi: 10.1021/bi011198i. [DOI] [PubMed] [Google Scholar]
- 58.Yao X, Parnot C, Deupi X, Ratnala VR, Swaminath G, Farrens D, Kobilka B. Coupling ligand structure to specific conformational switches in the beta2-adrenoceptor. Nat Chem Biol. 2006;2:417–422. doi: 10.1038/nchembio801. [DOI] [PubMed] [Google Scholar]
- 59.Islas LD, Zagotta WN. Short-range molecular rearrangements in ion channels detected by tryptophan quenching of bimane fluorescence. J Gen Physiol. 2006;128:337–346. doi: 10.1085/jgp.200609556. [DOI] [PMC free article] [PubMed] [Google Scholar]
- 60.Mansoor SE, Dewitt MA, Farrens DL. Distance mapping in proteins using fluorescence spectroscopy: the tryptophan-induced quenching (TrIQ) method. Biochemistry. 2010;49:9722–9731. doi: 10.1021/bi100907m. [DOI] [PMC free article] [PubMed] [Google Scholar]
- 61.Jasti J, Furukawa H, Gonzales EB, Gouaux E. Structure of acid-sensing ion channel 1 at 1.9 A resolution and low pH. Nature. 2007;449:316–323. doi: 10.1038/nature06163. [DOI] [PubMed] [Google Scholar]