
Fig. 1.
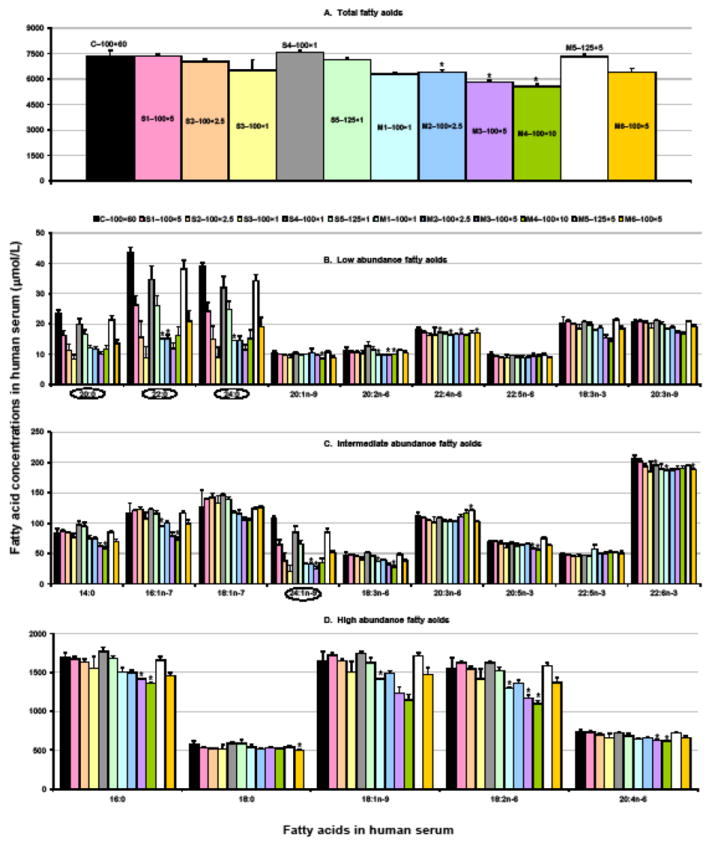
Comparison of the concentrations of fatty acids (μmol/L) in human serum determined by microwave accelerated assay for eleven conditions (S and M series) with those by Lepage & Roy assay, the reference method (control group C–100×60). Values are presented as mean ± SD, n = 3 except M1–100×5 (n = 2) and C–100×60 (n = 16). (A) Total fatty acids; (B) Low abundance fatty acids, <50 μM; (C) Intermediate abundance fatty acids, 50–250 μM; (D) High abundance fatty acids, >250 μM. Further details regarding the reaction conditions are presented in Table 1. One-way ANOVA followed by Tamhane’s T2 was applied to multiple comparison; asterisks indicate statistically different in comparison with control group at P <0.01. Unit conversion: 1 μmol/L of fatty acid ≈ 0.36 μg/mL