Abstract
The arginine 132 (R132) mutation of isocitrate dehydrogenase –1 (IDH1R132) results in production of 2-hydroxyglutarate (2-HG) and is associated with a better prognosis compared with wild-type (WT) in glioma patients. The majority of lower-grade gliomas express IDH1R132, whereas this mutation is rare in grade IV gliomas. The aim of this study was to noninvasively investigate metabolic and physiologic changes associated with the IDH1 mutation in a mouse glioma model. Using a 7T magnet, we compared MRI and proton magnetic resonance spectroscopy (MRS) in U87 glioma cells overexpressing either the mutated IDH1R132 or IDH1 wild-type (IDH1WT) gene in a mouse flank xenograft model. Flank tumors overexpressing IDH1R132 showed a resonance at 2.25 ppm corresponding to the 2-HG peak described for human IDH1R132 gliomas. WT tumors lacked this peak in all cases. IDH1 mutant tumors demonstrated significantly reduced glutamate by in vivo MRS. There were no significant differences in T2, apparent diffusion coefficient (ADC), or perfusion values between the mutant and IDH1WT tumors. The IDH1R132 mutation results in 2-HG resonance at 2.25 ppm and a reduction of glutamate levels as determined by MRS. Our results establish a model system where 2-HG can be monitored noninvasively, which should be helpful in validating 2-HG levels as a prognostic and/or predictive biomarker in glioma.
Keywords: animal models, glioblastoma, glioma, isocitrate dehydrogenase 1 (IDH1), MRI, MRS
A comprehensive genomic analysis of human glioblastoma multiforme (GBM) in 2008 revealed a mutation in the active site of isocitrate dehydrogenase–1 (IDH1) (without loss of heterozygosity) in 12% of GBM patients.1 Over the past 3 years, additional studies have reported the presence of the IDH1 mutation in acute myeloid leukemia,2–4 acute lymphoblastic leukemia,5 prostate cancer,5 colorectal cancer,6 and melanoma.7 Subsequent investigation confirmed the presence of a point mutation affecting arginine at residue 132 (R132) of the IDH1 protein (IDH1R132) in >70% of lower-grade gliomas.8 The R132 residue is conserved among species, likely representing the substrate binding site.9 IDH1R132 appears to be an early event in gliomagenesis before the emergence of the p53 mutation,10 leading to the speculation that it contributes to malignant transformation. Median overall survival among patients with anaplastic astrocytoma harboring mutations in either the IDH1 or IDH2 gene is significantly longer than that among patients without these mutations (65 vs 20 months).8 Similarly, glioblastoma patients with mutated IDH1 or IDH2 have a median survival of 31 months v 15 months for patients with IDH wild-type (IDHWT).1,8
In 2009, Dang et al.11 reported that IDH1R132 in gliomas is associated with the production of 2-hydroxyglutarate (2-HG), instead of α-ketoglutarate, and proposed a potential “gain of function” effect, rather than just a dominant inhibition of IDH1 catalytic activity. The same study also determined that the carbon source for 2-HG production is derived from glutamine after oxidation to α-ketoglutarate. Reduced levels of α-ketoglutarate were reported as a consequence of IDH1R132,12 suggesting that this mutation may also influence metabolism. Whether oncogenic potential can derive from 2-HG, as previously speculated,11,13,14 or from metabolic changes related to IDH1R132 is still under investigation.
Based on these data, 2-HG has been proposed as a potential biomarker for patients with glioma. Investigating this possibility, multiple researchers,15–17 including our own group,18 have used proton magnetic resonance spectroscopy (MRS) to noninvasively measure 2-HG levels in human glioma patients. However, gliomas are heterogeneous tumors both genetically and metabolically,19 so it is difficult to control for tumor differences not related to the IDH1 mutation in human patients (eg, tumor grade or other oncogenic mutations). Conversely, the U87 mouse glioma model presents an opportunity to compare IDH1 mutant and WT tumors in a controlled environment.
Thus, in this study, we used human U87 glioma cells transfected with IDH1R132 in order to study the consequences of IDH1R132 overexpression on tumor imaging features, physiology, and metabolism. This is the first step in establishing a well-characterized experimental model system in order to test the ability of noninvasive 2-HG measures to act as a biomarker of glioma growth and treatment response.
Methods
Cell Lines and the Generation of Constructs
All cells were cultured at 37°C and 5% CO2 in a 90% humidified tissue incubator. Culture medium was composed of Dulbecco's modified Eagle's medium/F12 medium supplemented with 10% fetal bovine serum (FBS), 2 mM glutamine, and 100 units/mL of penicillin/streptomycin. Human WT IDH1 coding sequences were amplified from U87 malignant glioma (MG) cells. The cDNA was fused in-frame with a FLAG tag at the C-terminus by the adapter primers (forward primer with the XhoI site underlined: 5′-TACTCGAGATGTCCAAAAAAATCAGTGG-3′, reverse primer with the EcoRI site underlined and the FLAG tag italicized: 5′-ACGAATTCTTACTTGTCATCGTCATCCTTGTAATCCATAAGTTTGGCCTG-3′) and inserted into a XhoI- and EcoRI-linearized pLPCX vector. The IDH1R132H alteration was generated in pLPCX-IDH1-WT-FLAG using the Quikchange method (Stratagene) with the following primer sequence: 5′R132H (5′-ACCTATCATCATAGGTCATCATGCTTATGGG-3′) and 3′R132H (5′-TGACCTATGATGATAGGTTTTACCCATCCAC-3′). A FuGene HD transfection system (Roche) was used to transfect plat-A cells with pLPCX-IDH1-ΔR132H-Flag, pLPCX-IDH1-WT-Flag, and vector control pLPCX-Flag constructs. U87 cells were infected with a retrovirus produced by plat-A package cells in medium containing 8 μg/mL polybrene. After 48 h, cells were selected with 0.7 μg/mL puromycin. Protein expression was confirmed by immunoblot and immunofluorescence (data not shown).
Animal Model
All animal experiments were approved by the University of California at Los Angeles Institutional Animal Care and Use Committee. Male NOD-scid mice (6–8 weeks old) were used for all experiments except 2-HG injection, where a phosphatase and tensin homolog (PTEN)/K-Ras knockout mouse was used (see below). Three groups of NOD-scid mice were injected with 106 glioma cells into the right flank as follows: (i) IDH1WT-U87 cells (n = 7); (ii) mock-transfected U87 cells (U87-vector control) (n = 2); and (iii) U87 cells transfected with the IDH1R132 construct (n = 8).
Magnetic Resonance Imaging and 1H Magnetic Resonance Spectroscopy
MRI and MRS were performed on a 7T Bruker system with a custom-built 2.2-cm radiofrequency birdcage coil. Mice were imaged at 14 and 21 days following glioma cell injections. Before imaging, we anesthetized the animals with isoflurane (4% induction, maintenance with 1.5%). During imaging, respiration was monitored and isoflurane levels were adjusted if breathing was <20 or >60 breaths per minute. Mice were kept warm with water heated to 37°C circulated using a TP500 water pump (Gaymar Solid State). To quantify T2 of different tumors, a multislice multi-echo (MSME) spin echo sequence was used (repetition time (TR)/echo time (TE) = 2000/7.26–101.64 ms, 14 echoes, 78 μm2 in-plane resolution, 1-mm slice thickness, number of experiments [NEX] = 2). A diffusion-weighted imaging–echo planar imaging (DWI-EPI) sequence (TR/TE = 3800/22.03 ms, with 3 b-values: 0, 500, 1000; 3 diffusion directions; and 1562 μm2 resolution; 1-mm slice thickness; NEX = 2) was used to measure ADC. Nonlinear least-squares regression was used to estimate ADC from multiple b-value DWIs and T2 from MSME data on a voxel-wise basis. Dynamic susceptibility contrast (DSC) perfusion MRI was collected using an EPI readout with 500 ms temporal resolution (2 slices; TR/TE = 500/7.18 ms; flip-angle = 45 degrees; 3122 μm2 in-plane resolution; 0.5-mm slice thickness; NEX = 1; 360 repetitions) following tail-vein injection of 0.05 mL of 0.5 mol/L gadolinium-based contrast agent (Magnevist, Berlex). Following DSC-MRI, we acquired a postcontrast T1-weighted spin-echo dataset (1-mmthick slices, TR/TE 500/7.3 ms, 78 μm2 resolution, 2 NaX).
Perfusion data were processed offline using ImageJ (National Institutes of Health; rsbweb.nih.gov/ij/), and the DSCoMAN plugin was written by Daniel Barboriak (Duke University, https://dblab.duhs.duke.edu/wysiwyg/downloads/DSCoMAN_1.0.pdf). DSC-MRI analysis consisted of truncating the first 5 time points in the DSC-MRI time series to ensure steady-state magnetization, calculating the pre-bolus signal intensity on a voxel-wise basis, converting the truncated DSC-MRI time series to a concentration-time curve based on the T2* relaxivity of the contrast agent, and estimating relative tumor blood flow (rTBF) on a voxel-wise basis by using the first moment of the delta R2 (R2 = 1/T2) curves to calculate mean transit time and with leakage correction to calculate tumor blood volume as described in a previous publication.20
MRS was performed using a point-resolved spectroscopic sequence (TR/TE = 4000/6.9 ms; NEX = 512; 3-mL voxel volume within the tumor) and a variable pulse power and optimized relaxation delay water suppression scheme.21 MRS data were quantified using the LCModel,22 and 2-HG was modeled based on J-coupling.23 To optimize detection of 2-HG, MRS was performed on a 2-HG phantom (1-M concentration) using multiple TE times (6.9–30 ms, with 5-ms increments). We found the strongest signal-to-noise ratio for the 2-HG peak in the spectra with the shortest TE (∼6.9 ms). Importantly, glutamate resonance (at 2.31–2.35 ppm) was distinct from 2-HG resonance (at 2.24–2.26 ppm). Metabolites with standard deviation (Cramer–Rao lower bounds) less than 20% of the estimated metabolite concentration were considered. Relative metabolite concentrations were expressed with respect to choline, since creatine levels were very low. This choice was justified by the lack of significant difference in the absolute choline concentration observed among the flank tumors.
Validation of 2-HG Chemical Shift on MRS in a PTEN/K-Ras Knockout Mouse
Validation of the precise 2-HG chemical shift on the MRS spectrum was determined by injecting exogenous 2-HG (Santa Cruz Biotechnology) into a PTEN/K-Ras knockout mouse24 with a 3-mm optic glioma. This model was chosen to ensure maximum delivery of 2-HG to the tumor, since flank tumors have relatively poor perfusion and areas with limited contrast-agent uptake. Phosphate buffered saline (PBS) was used to prepare 1 M 2-HG solution, and pH was adjusted to 7.4. Serum concentration following a 0.1-mL injection of 1 M 2-HG for a 15-g mouse was ∼10 mM. MRS was performed before and 30 min after 2-HG injection with a similar protocol as previously described, with the exception of NEX = 256 and a 2.5-mL voxel volume, which covered the tumor.
Histology and Immunohistochemistry
Following noninvasive MRI and MRS examinations, mice were anesthetized with pentobarbital (100 mg/kg i.p.) and sacrificed. The tumor tissue was fixed by immersion into 4% formalin overnight and then embedded in paraffin. Sections (10-μm thick) were cut, deparaffinized, and stained by standard hematoxylin and eosin (H&E) technique. Tumor necrosis was scored using H&E stained slides. Degree of necrosis was estimated from ≥2 adjacent sections by 2 experienced neuropathologists (W.Y. and L.M.). The percent of necrosis was calculated as necrotic area within the tumor v the whole area of the tumor and expressed as a fraction of 100 to the nearest decile. In addition, adjacent slices were processed with mouse anti-human antibody specific for IDH1R132H mutation25 (Dianova) for immunohistochemistry. Sections were processed using the Dako EnVision+ system (peroxidase) with blocking steps and secondary antibody dilutions per the manufacturer's instructions (DakoCytomation). NovaRED (Vector Laboratories) was used as a chromogen. Mayer's hematoxylin was used as a counterstain.
Statistical Analysis
MRS metabolites, T2, and ADC values within different tumor volumes were analyzed using an analysis of variance (ANOVA) across groups (U87-IDH1R132, U87-IDH1WT, U87-vector). The Holm–Sidak test for multiple pairwise comparisons was used for post hoc comparisons. Sigma Stat 11.0 (Systat Software) was used for ANOVA analysis. P < .05 was considered statistically significant. Data are given as means ± standard deviation (SD) unless stated otherwise.
Results
Validation of 2-HG Chemical Shift Assignment in MRS Spectra
Validation of the chemical shift assigned to 2-HG on the 1H-MR spectrum was performed using 0.1 mL of 1 M 2-HG solution injected into a PTEN/K-Ras mouse with an optic glioma. After 30 min following 2-HG injection, a distinct peak appeared at ∼2.25 ppm, the expected location based on J-coupling simulations using the LCModel (Fig. 1B). This chemical shift corresponded to the strongest peak of 2-HG (hydrogen attached to C-4 of 2-HG), similar to previously published results for 2-HG using J-coupling modeling and MRS.23
Fig. 1.
Verification of 2-HG detection and chemical shift. A PTEN/K-Ras knockout mouse with optic glioma was injected with 0.1 mL of 1 M 2-HG and subjected to MRS before and 30 min after injection. (A) MRS spectrum before injection showing baseline metabolites of the optic glioma. (B) After 30 min following i.v. injection, we noticed the emergence of the additional peak at ∼2.25 ppm that we assigned to 2-HG.
Measurement of 2-HG in Tumors Overexpressing IDH1R132
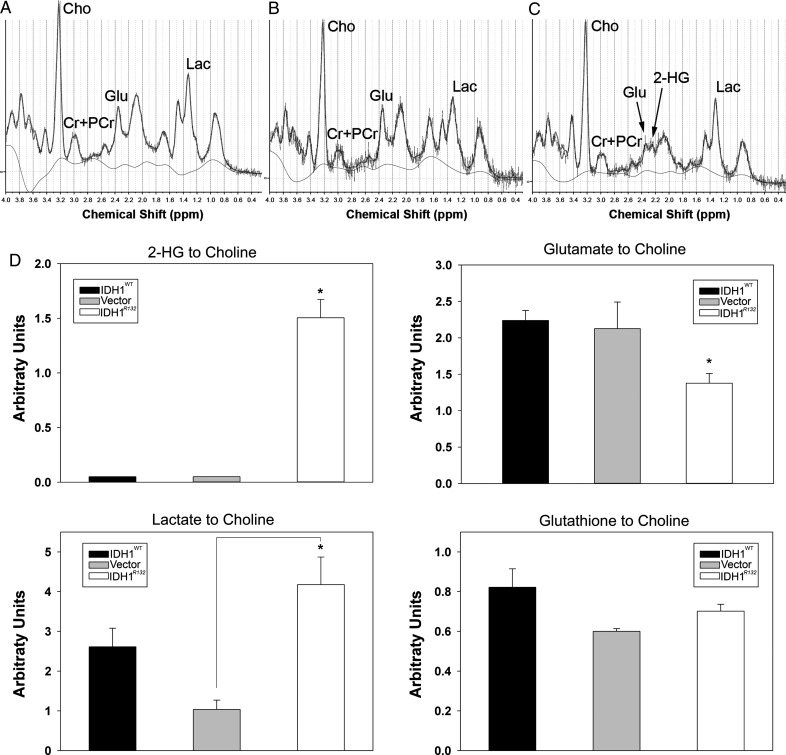
Quantitative MRS using the LCModel algorithm with J-coupling modeling for 2-HG confirmed the presence of a 2-HG peak in all U87 flank tumors overexpressing IDH1R132, whereas 2-HG levels were not detectable in IDH1WT U87 and U87-vector tumors (Fig. 2). The presence of 2-HG in IDH1R132 flank tumors was associated with a significant decrease of glutamate (P < .05, ANOVA with Holm–Sidak post hoc test) (Fig. 2C and D) compared with IDH1WT and vector control tumors. The ratios of lactate:choline and glutathione:choline (thought to be a measure of oxidative stress) were not significantly different between IDH1R132 and IDH1WT tumors (Fig. 2D). The lactate levels, however, in the vector control tumors were significantly reduced (P < .05, ANOVA with Holm–Sidak post hoc test) compared with IDH1R132 (Fig. 2D).
Fig. 2.
Representative 1D MRS spectrum of (A) IDH1WT, (B) vector-control, and (C) tumors overexpressing IDH1R132. Notice the reduced glutamate/glutamine peak and additional peak corresponding to 2-HG at ∼2.25 ppm in IDH1R132 flank tumors. (D) Concentration of 2-HG, glutamate, lactate, and glutathione as a ratio to choline (arbitrary units) expressed as mean ± SD. *P < .05 ANOVA with Holm–Sidak correction for multiple pairwise comparison.
Quantification of T2 and ADC
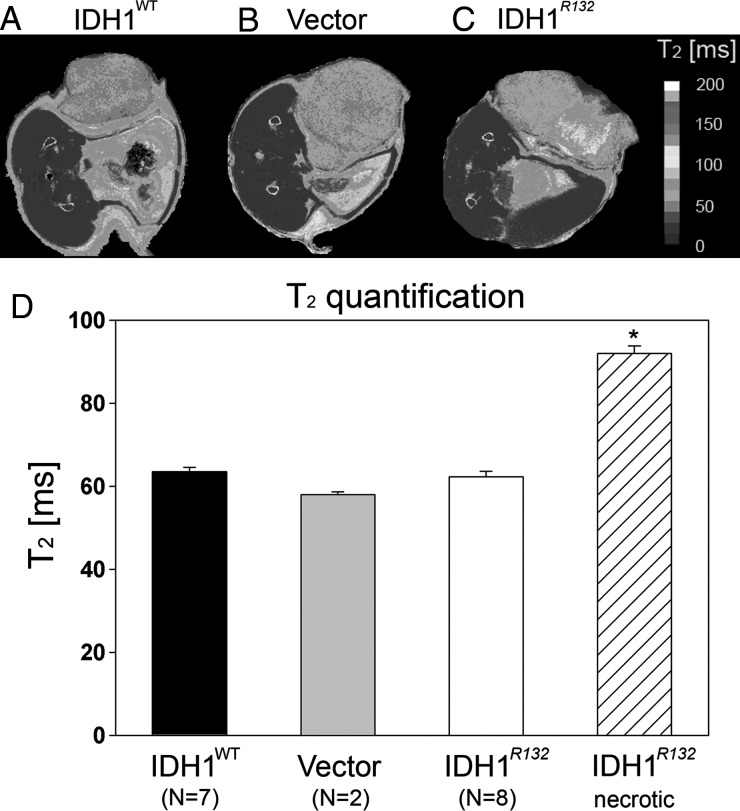
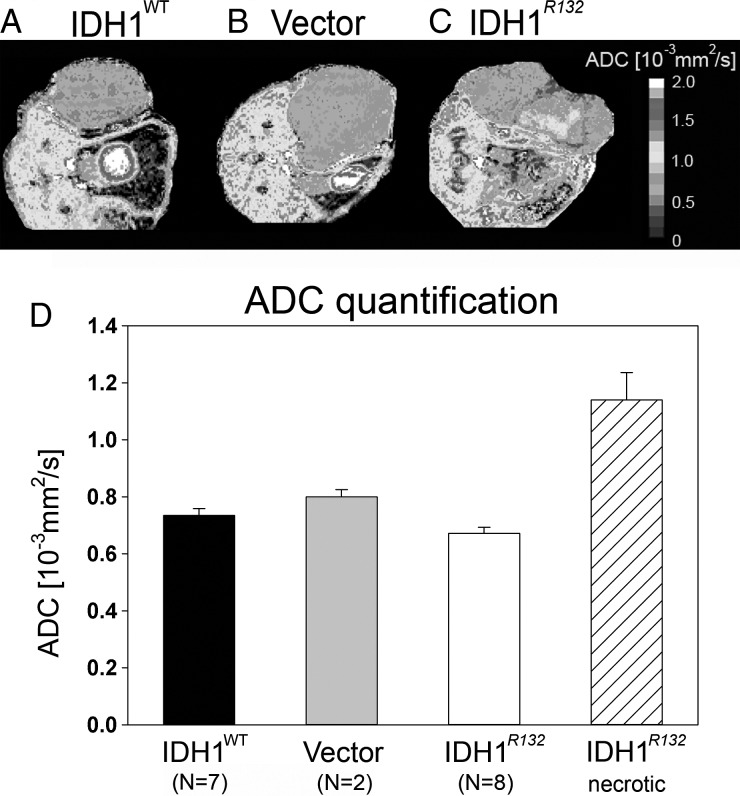
Increased T2 values within tumor tissue are typically attributed to the presence of vasogenic edema or macroscopic necrosis. In the absence of vasogenic edema or necrosis, lower T2 values are expected. No significant differences (1-way ANOVA) in T2 values were detected between IDH1R132 (62.3 ± 3.5 ms), IDH1WT (63.5 ± 2.8 ms), and U87-vector (57.9 ± 1.2 ms) flank tumors (Fig. 3D). However, flank tumors formed from IDH1R132-overexpressing U87 cells had clear areas of macroscopic necrosis with significantly elevated T2 values (ANOVA with Holm–Sidak post hoc test, P < .05) compared with T2 values within the nonnecrotic region (91.9* ± 3.6 62 ms; Fig. 3D). Additionally, no significant differences in ADC (1-way ANOVA, P > .05), a surrogate for tumor cell density,26,27 were found among flank tumors of nonnecrotic-region IDH1R132 (0.672 ± 0.052 × 10⁻³ mm2/s), IDH1WT (0.734 ± 0.057 × 10⁻³ mm2/s), and U87-vector control (0.800 ± 0.057 × 10⁻³ mm2/s) (Fig. 4D); however, the necrotic region of the tumors overexpressing IDH1R132 had significantly higher ADC values (1.140 ± 0.192 × 10⁻³ mm2/s) compared with the nonnecrotic region of these tumors (ANOVA with Holm–Sidak post hoc test, P < .05), presumably owing to decreased cell density and increased extracellular space, as expected for necrotic areas.
Fig. 3.
(A–C) Representative T2 maps showing T2 distribution across different flank tumors. Color scale represents different T2 values. (D) T2 quantification for all 3 tumor types expressed as mean T2 values ± SD. Notice similar T2 distributions except for the necrotic area in IDH1R132 tumor (C) with elevated T2 values, *P < .05 ANOVA with Holm–Sidak correction for multiple pairwise comparison.
Fig. 4.
(A–C) Representative ADC maps showing ADC distribution across different flank tumors. Color scale represents different ADC values. (D) ADC quantification for all 3 tumor types expressed as mean ADC values ± SD. Notice similar ADC distributions except for the necrotic area in IDH1R132 tumor (C) with elevated ADC values, *P < .05 ANOVA with Holm–Sidak correction for multiple pairwise comparison.
MR Perfusion
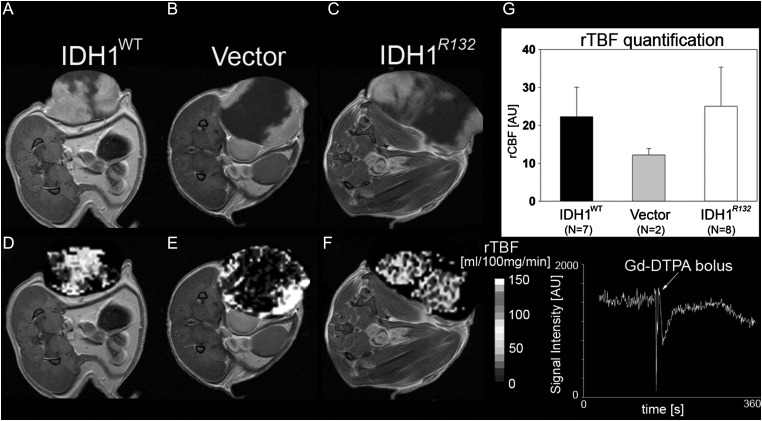
Independent of IDH1R132 or IDH1WT expression, all flank tumors had a similar pattern of contrast enhancement, with an enhancing periphery and non-enhancing T1 hypointense central region (Fig. 5A–C). The slowest-growing WT tumors had a slightly larger area of contrast enhancement compared with IDH1R132 and U87-vector tumors. Central regions exhibiting MR signal intensity consistent with necrosis exhibited very low perfusion, whereas regions with contrast enhancement on postcontrast T1-weighted images appeared to have elevated perfusion (Fig. 5D–F). Relative TBF was not significantly different among flank tumors of IDH1R132 (mean ± SEM = 25.01 ± 10.328 mL/100 mg tissue/min), IDH1WT (22.29 ± 7.748 mL/100 mg tissue/min), and U87-vector (12.20 ± 1.69 mL/100 mg tissue/min) (1-way ANOVA on ranks; Fig. 5G), suggesting a similar degree of vascularity among these tumors.
Fig. 5.
(A–C) Representative postcontrast T1-weighted MRIs of IDH1WT, vector-control, and IDH1R132 flank tumors. Notice areas void of contrast agent enhancement in all 3 tumor types. (D–F) Representative perfusion images (color scale represents different perfusion values, mL/100 mg tissue/min) with DSC signal intensity bolus curve. Areas of reduced perfusion were present in all 3 tumor types, usually matched with areas of poor contrast enhancement. Some of the geometric distortion is due to use of echo planar imaging sequence for DSC perfusion. (G) Graph representing relative tumor blood flow (rTBF) measurements expressed as mean blood flow values ± SEM.
H&E Histology and IDH1R132 Immunohistochemistry
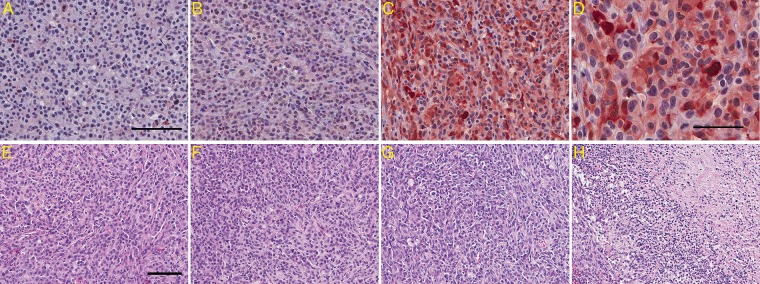
IDH1R132 immunohistochemistry confirmed the presence of IDH1R132 in flank tumors overexpressing IDH1R132, but not IDH1WT and U87-vector (Fig. 6A–D). Interestingly, while most cells appeared immunoreactive for IDH1R132, there were occasional cells that did not stain (Fig. 6D). Whether these represented tumor cells that had lost IDH1R132 or connective cells from the vasculature or other sources is not clear (Fig. 6D). H&E histology confirmed a necrotic area of ∼40%–50% (Fig. 6H) in flank tumors overexpressing IDH1R132 compared with a region of necrosis of ∼10%–20% observed in IDH1WT and vector-control tumors (Fig. 6E–H).
Fig. 6.
IDH1 staining and H&E histology of tumors overexpressing IDHWT, vector control, and IDH1R132. (A–D) Representative IDH1 immunohistochemistry for (A) IDH1WT, (B) vector control, and (C) IDH1R132 showing IDH1R132-positive cells for only IDH1R132-transduced gliomas; scale bar (A) represents 100 μm. (D) Higher magnification of IDH1R132 immunohistochemistry in IDH1R132 flank tumors shows that not all U87 cells are IDH1R132 positive; scale bar represents 50 μm. (E–G) Representative H&E staining for (E) IDH1WT, (F) vector control, and (G) IDH1R132; scale bar represents 100 μm. (H) H&E staining shows the necrotic region in the IDH1R132 flank tumor.
Discussion
The current study is the first controlled experiment validating the link between noninvasive 2-HG detection using MRS and the IDH1R132 mutation in glioma cells. IDH1R132 overexpression in U87 cells led to in vivo detectable levels of 2-HG using MRS, providing further evidence of a causal relationship between the IDH1 mutation and 2-HG production, as previously suggested by in vivo human glioma data.15–18 We also found that glutamate was significantly altered in the IDH1 mutants, while other clinically relevant MRI parameters, including T2 and ADC quantification, were not significantly different.
Previous investigations have demonstrated that MRS can be used to detect 2-HG in human glioma patients.16–18,27 Similar to the findings from human data, we found that the IDH1 mutation resulted in a 2-HG resonance at ∼2.25 ppm chemical shift, adjacent to the glutamate and glutamine peaks. As expected, cells overexpressing IDH1WT lacked this metabolic peak. For our experiments, 2-HG levels were estimated to be between 10 mM and 20 mM in IDH1R132 flank tumors, somewhat higher than the 2–9 mM range reported for humans.16 The glutamate resonance (at 2.31–2.35 ppm) was sufficiently distinct from the 2-HG resonance to prevent contamination of the 2-HG peak, which has been a limitation of 2-HG quantification in tumors with MRS performed on clinical (1.5T and 3T) scanners. Given the similarity of the IDH1 mutant spectra in the current study with those previously published from in vivo human data, this use of IDH1R132 mutant overexpressing cell lines has provided further evidence that the IDH1R132 mutation is responsible for the 2-HG peak and that this resonance is not related to tumor grade or other confounding factors.
Reduced glutamate levels have previously been reported for human oligodendroglioma-derived cell lines stably expressing the IDH1R132 mutation.28 The IDH1R132 mutation also has been associated with decreased α-ketoglutarate (1 of the metabolic precursors for glutamate synthesis, and the substrate for production of 2-HG by IDHR132).12 Since α-ketoglutarate is integral to the Kreb's cycle, reduced glutamate could indicate compromised oxidative metabolism, increased utilization of glutamate for acetyl coenzyme A synthesis, or irreversible conversion to 2-HG. Glutamate is thought to mediate epileptic seizures induced by brain tumors,29 and therefore the relationship between the IDH1 mutation and glutamate levels could have important clinical implications, meriting further investigation.
Results from the current study suggest that IDH1R132 mutant tumors have larger areas of macroscopic necrosis defined by MR compared with IDH1WT. Specifically, extensive areas of necrosis (∼40%–50% of the entire tumor volume) were observed in all tumors overexpressing IDH1R132 ∼21 days following injections, compared with <20% macroscopic necrosis observed in IDH1WT or U87-vector flank tumors. It is conceivable that this may be due to slight size differences in the mutant tumors within the context of the current experiment, as more rapid tumor growth could occur quicker than the angiogenesis necessary to maintain a normoxic environment.18,30,31 Alternatively, elevated levels of 2-HG could potentially be toxic to the tumor cells, leading to more extensive necrotic area. In humans, 2-HG toxicity is suggested by the observation that inborn errors of metabolism resulting in elevated 2-HG levels result in encephalopathy.32,33 Direct toxicity of 2-HG to rat cerebral cortical slices has been demonstrated (at 5-mM concentration), in similar concentrations to those of 2-HG reported for gliomas,11,14,31 and within the range of 2-HG levels calculated for the xenografts used in our study.11,14,34 One caveat to this assumption, however, is that IDH1 mutant glioblastomas seem to have less necrosis than their WT counterparts, at least as detected by MRI.35
In summary, we have demonstrated that overexpression of the IDH1 mutation leads to detectable levels of 2-HG in a mouse glioma model that can be measured in vivo and noninvasively by MRS. This model system is of potential utility in establishing the relationships among 2-HG levels and treatment effect, outcomes, and other variables necessary to validate 2-HG as a clinically important biomarker for glioma.
Conflict of interest statement. None declared.
References
- 1.Parsons DW, Jones S, Zhang X, et al. An integrated genomic analysis of human glioblastoma multiforme. Science. 2008;321(5897):1807–1812. doi: 10.1126/science.1164382. [DOI] [PMC free article] [PubMed] [Google Scholar]
- 2.Mardis ER, Ding L, Dooling DJ, et al. Recurring mutations found by sequencing an acute myeloid leukemia genome. N Engl J Med. 2009;361(11):1058–1066. doi: 10.1056/NEJMoa0903840. [DOI] [PMC free article] [PubMed] [Google Scholar]
- 3.Green A, Beer P. Somatic mutations of IDH1 and IDH2 in the leukemic transformation of myeloproliferative neoplasms. N Engl J Med. 2010;362(4):369–370. doi: 10.1056/NEJMc0910063. [DOI] [PubMed] [Google Scholar]
- 4.Ward PS, Patel J, Wise DR, et al. The common feature of leukemia-associated IDH1 and IDH2 mutations is a neomorphic enzyme activity converting alpha-ketoglutarate to 2-hydroxyglutarate. Cancer Cell. 2010;17(3):225–234. doi: 10.1016/j.ccr.2010.01.020. [DOI] [PMC free article] [PubMed] [Google Scholar]
- 5.Kang MR, Kim MS, Oh JE, et al. Mutational analysis of IDH1 codon 132 in glioblastomas and other common cancers. Int J Cancer. 2009;125(2):353–355. doi: 10.1002/ijc.24379. [DOI] [PubMed] [Google Scholar]
- 6.Sjoblom T, Jones S, Wood LD, et al. The consensus coding sequences of human breast and colorectal cancers. Science. 2006;314(5797):268–274. doi: 10.1126/science.1133427. [DOI] [PubMed] [Google Scholar]
- 7.Lopez GY, Reitman ZJ, Solomon D, et al. IDH1(R132) mutation identified in one human melanoma metastasis, but not correlated with metastases to the brain. Biochem Biophys Res Commun. 2010;398(3):585–587. doi: 10.1016/j.bbrc.2010.06.125. [DOI] [PMC free article] [PubMed] [Google Scholar]
- 8.Yan H, Parsons DW, Jin G, et al. IDH1 and IDH2 mutations in gliomas. N Engl J Med. 2009;360(8):765–773. doi: 10.1056/NEJMoa0808710. [DOI] [PMC free article] [PubMed] [Google Scholar]
- 9.Xu X, Zhao J, Xu Z, et al. Structures of human cytosolic NADP-dependent isocitrate dehydrogenase reveal a novel self-regulatory mechanism of activity. J Biol Chem. 2004;279(32):33946–33957. doi: 10.1074/jbc.M404298200. [DOI] [PubMed] [Google Scholar]
- 10.Nobusawa S, Watanabe T, Kleihues P, Ohgaki H. IDH1 mutations as molecular signature and predictive factor of secondary glioblastomas. Clin Cancer Res. 2009;15(19):6002–6007. doi: 10.1158/1078-0432.CCR-09-0715. [DOI] [PubMed] [Google Scholar]
- 11.Dang L, White DW, Gross S, et al. Cancer-associated IDH1 mutations produce 2-hydroxyglutarate. Nature. 2009;462(7274):739–744. doi: 10.1038/nature08617. [DOI] [PMC free article] [PubMed] [Google Scholar]
- 12.Zhao S, Lin Y, Xu W, et al. Glioma-derived mutations in IDH1 dominantly inhibit IDH1 catalytic activity and induce HIF-1alpha. Science. 2009;324(5924):261–265. doi: 10.1126/science.1170944. [DOI] [PMC free article] [PubMed] [Google Scholar]
- 13.Garber K. Oncometabolite? IDH1 discoveries raise possibility of new metabolism targets in brain cancers and leukemia. J Natl Cancer Inst. 2010;102(13):926–928. doi: 10.1093/jnci/djq262. [DOI] [PubMed] [Google Scholar]
- 14.Xu W, Yang H, Liu Y, et al. Oncometabolite 2-hydroxyglutarate is a competitive inhibitor of alpha-ketoglutarate-dependent dioxygenases. Cancer Cell. 2011;19(1):17–30. doi: 10.1016/j.ccr.2010.12.014. [DOI] [PMC free article] [PubMed] [Google Scholar]
- 15.Andronesi OC, Kim GS, Gerstner E, et al. Detection of 2-hydroxyglutarate in IDH-mutated glioma patients by in vivo spectral-editing and 2D correlation magnetic resonance spectroscopy. Sci Transl Med. 2012;4(116):116ra114. doi: 10.1126/scitranslmed.3002693. [DOI] [PMC free article] [PubMed] [Google Scholar]
- 16.Choi C, Ganji SK, Deberardinis RJ, et al. 2-hydroxyglutarate detection by magnetic resonance spectroscopy in IDH-mutated patients with gliomas. Nat Med. 2012;18:624–629. doi: 10.1038/nm.2682. [DOI] [PMC free article] [PubMed] [Google Scholar]
- 17.Elkhaled A, Jalbert LE, Phillips JJ, et al. Magnetic resonance of 2-hydroxyglutarate in IDH1-mutated low-grade gliomas. Sci Transl Med. 2012;4(116):116ra115. doi: 10.1126/scitranslmed.3002796. [DOI] [PMC free article] [PubMed] [Google Scholar]
- 18.Pope WB, Prins RM, Albert Thomas M, et al. Non-invasive detection of 2-hydroxyglutarate and other metabolites in IDH1 mutant glioma patients using magnetic resonance spectroscopy. J Neurooncol. 2012;107(1):197–205. doi: 10.1007/s11060-011-0737-8. [DOI] [PMC free article] [PubMed] [Google Scholar]
- 19.Nikiforova MN, Hamilton RL. Molecular diagnostics of gliomas. Arch Pathol Lab Med. 2011;135(5):558–568. doi: 10.5858/2010-0649-RAIR.1. [DOI] [PubMed] [Google Scholar]
- 20.Boxerman JL, Schmainda KM, Weisskoff RM. Relative cerebral blood volume maps corrected for contrast agent extravasation significantly correlate with glioma tumor grade, whereas uncorrected maps do not. AJNR Am J Neuroradiol. 2006;27(4):859–867. [PMC free article] [PubMed] [Google Scholar]
- 21.Tkac I, Starcuk Z, Choi IY, Gruetter R. In vivo 1H NMR spectroscopy of rat brain at 1 ms echo time. Magn Reson Med. 1999;41(4):649–656. doi: 10.1002/(sici)1522-2594(199904)41:4<649::aid-mrm2>3.0.co;2-g. [DOI] [PubMed] [Google Scholar]
- 22.Provencher SW. Estimation of metabolite concentrations from localized in vivo proton NMR spectra. Magn Reson Med. 1993;30(6):672–679. doi: 10.1002/mrm.1910300604. [DOI] [PubMed] [Google Scholar]
- 23.Bal D, Gryff-Keller A. H-1 and C-13 NMR study of 2-hydroxyglutaric acid and its lactone. Magnetic Resonance in Chemistry. 2002;40(8):533–536. [Google Scholar]
- 24.Gregorian C, Nakashima J, Dry SM, et al. PTEN dosage is essential for neurofibroma development and malignant transformation. Proc Natl Acad Sci U S A. 2009;106(46):19479–19484. doi: 10.1073/pnas.0910398106. [DOI] [PMC free article] [PubMed] [Google Scholar]
- 25.Capper D, Zentgraf H, Balss J, Hartmann C, von Deimling A. Monoclonal antibody specific for IDH1 R132H mutation. Acta Neuropathol. 2009;118(5):599–601. doi: 10.1007/s00401-009-0595-z. [DOI] [PubMed] [Google Scholar]
- 26.Gupta RK, Cloughesy TF, Sinha U, et al. Relationships between choline magnetic resonance spectroscopy, apparent diffusion coefficient and quantitative histopathology in human glioma. J Neurooncol. 2000;50(3):215–226. doi: 10.1023/a:1006431120031. [DOI] [PubMed] [Google Scholar]
- 27.Lazovic J, Jensen MC, Ferkassian E, Aguilar B, Raubitschek A, Jacobs RE. Imaging immune response in vivo: cytolytic action of genetically altered T cells directed to glioblastoma multiforme. Clin Cancer Res. 2008;14(12):3832–3839. doi: 10.1158/1078-0432.CCR-07-5067. [DOI] [PMC free article] [PubMed] [Google Scholar]
- 28.Reitman ZJ, Jin G, Karoly ED, et al. Profiling the effects of isocitrate dehydrogenase 1 and 2 mutations on the cellular metabolome. Proc Natl Acad Sci U S A. 2011;108(8):3270–3275. doi: 10.1073/pnas.1019393108. [DOI] [PMC free article] [PubMed] [Google Scholar]
- 29.Buckingham SC, Campbell SL, Haas BR, et al. Glutamate release by primary brain tumors induces epileptic activity. Nat Med. 2011;17(10):1269–1274. doi: 10.1038/nm.2453. [DOI] [PMC free article] [PubMed] [Google Scholar]
- 30.Altman DA, Atkinson DS, Jr., Brat DJ. Best cases from the AFIP: glioblastoma multiforme. Radiographics. 2007;27(3):883–888. doi: 10.1148/rg.273065138. [DOI] [PubMed] [Google Scholar]
- 31.Jain RK, di Tomaso E, Duda DG, Loeffler JS, Sorensen AG, Batchelor TT. Angiogenesis in brain tumours. Nat Rev Neurosci. 2007;8(8):610–622. doi: 10.1038/nrn2175. [DOI] [PubMed] [Google Scholar]
- 32.Struys EA. D-2-Hydroxyglutaric aciduria: unravelling the biochemical pathway and the genetic defect. J Inherit Metab Dis. 2006;29(1):21–29. doi: 10.1007/s10545-006-0317-9. [DOI] [PubMed] [Google Scholar]
- 33.Kolker S, Mayatepek E, Hoffmann GF. White matter disease in cerebral organic acid disorders: clinical implications and suggested pathomechanisms. Neuropediatrics. 2002;33(5):225–231. doi: 10.1055/s-2002-36741. [DOI] [PubMed] [Google Scholar]
- 34.Latini A, da Silva CG, Ferreira GC, et al. Mitochondrial energy metabolism is markedly impaired by D-2-hydroxyglutaric acid in rat tissues. Mol Genet Metab. 2005;86(1–2):188–199. doi: 10.1016/j.ymgme.2005.05.002. [DOI] [PubMed] [Google Scholar]
- 35.Carrillo JA, Lai A, Nghiemphu PL, et al. Relationship between tumor enhancement, edema, IDH1 mutational status, MGMT promoter methylation, and survival in glioblastoma. AJNR Am J Neuroradiol. 2012;33:1349–1355. doi: 10.3174/ajnr.A2950. [DOI] [PMC free article] [PubMed] [Google Scholar]


