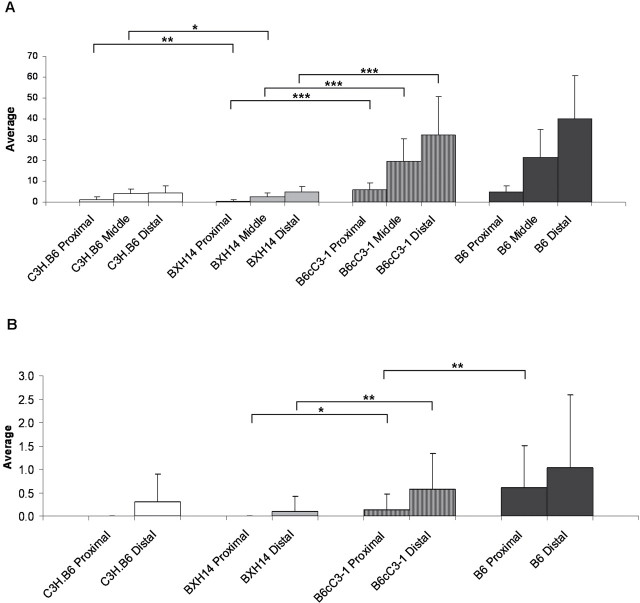
Fig. 1.
Quantitation of intestinal polyposis in control and test mice. Hybrid mice used as controls were (C3H.B6 X B6)F1 Apc Min/+ and (B6 X B6)F1 Apc Min/+. Test mice were (BXH14 X B6)F1 Apc Min/+ and (BcC3-1 X B6)F1 Apc Min/+. All mice were aged to 110–130 days. (A) Average small intestine polyp number (± standard deviation) are shown by region (proximal, middle, and distal). (B) Average colon polyp number (± standard deviation) is shown by region (proximal and distal) (*P < 0.01, **P < 0.001, ***P < 0.0001).

