Abstract
Tunable soft ionization coupled to mass spectroscopy is a powerful method to investigate isolated molecules, complexes and clusters and their spectroscopy and dynamics1-4. Fundamental studies of photoionization processes of biomolecules provide information about the electronic structure of these systems. Furthermore determinations of ionization energies and other properties of biomolecules in the gas phase are not trivial, and these experiments provide a platform to generate these data. We have developed a thermal vaporization technique coupled with supersonic molecular beams that provides a gentle way to transport these species into the gas phase. Judicious combination of source gas and temperature allows for formation of dimers and higher clusters of the DNA bases. The focus of this particular work is on the effects of non-covalent interactions, i.e., hydrogen bonding, stacking, and electrostatic interactions, on the ionization energies and proton transfer of individual biomolecules, their complexes and upon micro-hydration by water1, 5-9.
We have performed experimental and theoretical characterization of the photoionization dynamics of gas-phase uracil and 1,3-dimethyluracil dimers using molecular beams coupled with synchrotron radiation at the Chemical Dynamics Beamline10 located at the Advanced Light Source and the experimental details are visualized here. This allowed us to observe the proton transfer in 1,3-dimethyluracil dimers, a system with pi stacking geometry and with no hydrogen bonds1. Molecular beams provide a very convenient and efficient way to isolate the sample of interest from environmental perturbations which in return allows accurate comparison with electronic structure calculations11, 12. By tuning the photon energy from the synchrotron, a photoionization efficiency (PIE) curve can be plotted which informs us about the cationic electronic states. These values can then be compared to theoretical models and calculations and in turn, explain in detail the electronic structure and dynamics of the investigated species 1, 3.
Keywords: Physics, Issue 68, mass spectroscopy (application), physical chemistry, radiation chemistry, molecular beams, molecular physics, molecular structure, photon interactions with atoms and molecules, Molecular beam, mass spectrometry, vacuum ultraviolet, synchrotron radiation, proton transfer, DNA bases, clusters
Protocol
1. Sample Loading
Remove the back flange and disassemble the 3/8" stainless nozzle tube from the apparatus (See Figure 1 and Figure 2) and make sure it is clean and the 100 mm orifice is clear (This can be done by looking at a light source through it). For cleaning, fill the tube with ~1 ml ethanol and scrub the inside using cotton tips. Alternatively, place the nozzle in an ultrasonic bath filled with soap and water or ethanol for about 20 min. Then dry with compressed air.
Using a small, clean spatula, place about 250 mg of sample in the front part of the nozzle, close to the orifice but not blocking it. A good method to avoid the orifice from getting blocked is to place a small aluminum foil ball or glass wool in front of the orifice and then add the sample powder. Use a cotton tip to push the sample into the tube to ensure it is in the front 25 mm of the tube. This front part will comprise the heated zone.
Reattach the nozzle to the apparatus carefully to avoid moving the sample powder inside. Then attach the birdcage adapter (See Figure 2), heater block and thermocouple (See Figure 3).
Before closing the vacuum chamber, measure the distance from the flange surface to the tip of the nozzle to be 22.5 inches; this will allow 0.5 inch between the nozzle and the skimmer.
When the vacuum chamber is closed, test the heater cartridge and thermocouple connections to make sure they are well connected to the feed-through connectors.
Make sure the carrier gas inlet valve is closed.
Close the venting valve (if it was used).
Slowly begin pumping the chamber using the roughing pumps (4 valves), and when the pressure in the chamber is <1 torr, start the turbomolecular pumps (5 pumps).
When the pressure in the chamber is <10-6 torr, apply the voltages to the ion optics of the time of flight mass spectrometer, and the micro-channel plate detector (the voltage on the latter should be turned on gradually) (See Figure 1 for various voltages).
Open the VUV shutter to allow the photon beam in the chamber.
Open the carrier gas inlet valve and set the backing pressure regulator to 460 (this is a vacuum regulator, measuring in a negative scale from 0 to -760 torr, hence when set to 460 it will regulate the pressure in the line to 300 torr).
Under these conditions the pressure in the source and mass spectrometer chambers should be ~1 x 10⁻⁶ torr and ~1 x 10⁻⁶ torr, respectively.
2. Acquisition of a Mass Spectrum
Start the FAST card (model number P7889, 100 ps/bin) software on the computer and let it run in the background.
Open the Labview data acquisition program: "General Interface.vi"* (Figure 4)
(*This software and the other Labview codes were developed at the beamline and are available to share for no cost from the corresponding author)
Using the ALS Control tab in the Labview software, set the photon energy to the desired wavelength.
On the scaler tab, set the number of time units to be binned together (typically 32), the range (number of bins) and sweeps (the number of mass spectra added on top of each other to form the final mass spectrum), then click accept, so that these values will be stored and used.
Next, click get data to begin the data acquisition. When the acquisition is over, the mass spectrum will appear on the screen.
Save the mass spectrum by clicking the save button. (the X-axis of the obtained spectrum corresponds to the ion flight time in 100 ps units)
3. Acquisition of a Photoionization Efficiency Curve (PIE)
Using the ALS Scan tab (Figure 5) in the Labview software, it is possible to acquire data while tuning one of the beamline motors. In this case, select the motor "Mono T3 energy" to tune over different photon energies (The undulator inside the synchrotron will move automatically to match the desired wavelength). Set the photon energy to the desired value (in eV).
Enter the Start and Stop energies (in eV) as well as the Step size.
Do not enter the number of sweeps - this will be updated automatically by the value you entered in step 2.4.
Click Read current from K486 to read the photocurrent measured by the photodiode.
Next, click Start to begin the scan. You will be prompted to choose a filename where the data will be stored at the end of the run.
The first column in the data file contain the bin number (Bin#) and need to be converted to mass units13. Typical values are: Mass = 0.6 + 1xE-3 (Bin#) + 5xE-7 (Bin#)^2 (A more precise mass calibration can be done using a known mixture of gases or even room air i.e. mostly O2,N2 and H2O mixture and fitting their arrival time to a second order polynomial)
Save the data file with the first column converted to mass.
To plot a PIE curve, one easy way is to use a second Labview program called "ALS energy scan.vi" which is designed to analyze the scan data and produce PIEs.
4. Plotting a Photoionization Efficiency Curve (PIE)
As noted above, the analysis can be done using the "ALS energy scan.vi" program (see Figure 6), however we will also describe here the steps needed to analyze the data without it.
When starting the program you will be prompted to select the file containing the data. This is the file you saved in step 3.7 and contain masses in the first column and ion counts at different photon energies in the next columns. Note that the first and second rows in the file indicate the photon energy and photocurrent of the data in that column, respectively.
In the top panel there is a 2D plot of the data; moving the red horizontal marker selects a mass spectra at a specific photon energy to be displayed in the lower panel.
The next step is to integrate the ion counts of a specific mass at each photon energy while subtracting the background signal. In the lower panel the two vertical red markers should be set around the mass peak to be integrated while the two blue markers around a nearby region with no data which can serve as background value. The software will present the integrated data minus the background in the panel on the right.
To present a true PIE curve one must correct the ion counts to the varying photon flux at every step. This is done automatically by the software. If you choose to skip this correction, click to turn off the current correction button to the right of the top panel. If you choose to do this step manually, the quantum efficiency of the photodiode per photon energy has to be considered as well (obtained from the photodiode manufacturer and available via the corresponding author), see equation 1. Otherwise, this is all done automatically by the software.

Click save spectrum in the lower right corner to save the corrected PIE curve.
Representative Results
Figure 7 shows a typical mass spectrum of the supersonic expansion of 1,3-dimethyluracil vapors (A) and the PIE curves of the three main features (the monomer at m/z 140, protonated monomer at m/z 141, and the 1,3-dimethyluracil dimer at m/z 280) as extracted from a VUV scan between 8 eV and 10 eV (B). The gray shadow is the standard deviation from three consecutive scans.
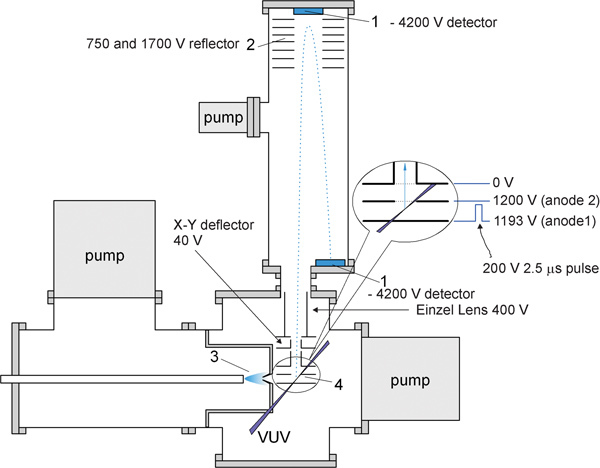 Figure 1. Schematic of the experimental apparatus with voltages shown. (1) Microchannel plate detector, (2) Reflector mirror, (3) Molecular Beam region, (4) Ion optics for extraction.
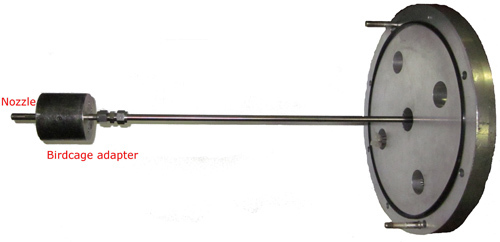 Figure 2. Source flange with nozzle and birdcage adapter.
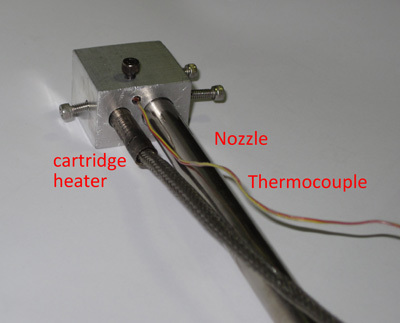 Figure 3. Heater block with the nozzle, heating cartridge and thermocouple.
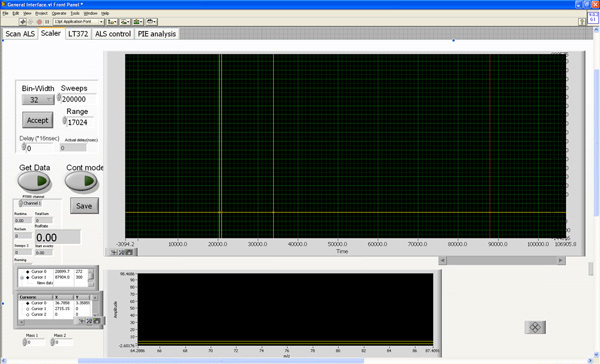 Figure 4. Graphical user interface of the data acquisition program. Click here to view larger figure.
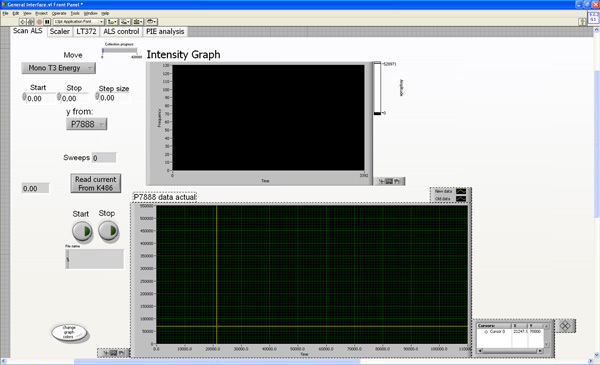 Figure 5. Graphical user interface of the data acquisition program for photoionization efficiency scans. Click here to view larger figure.
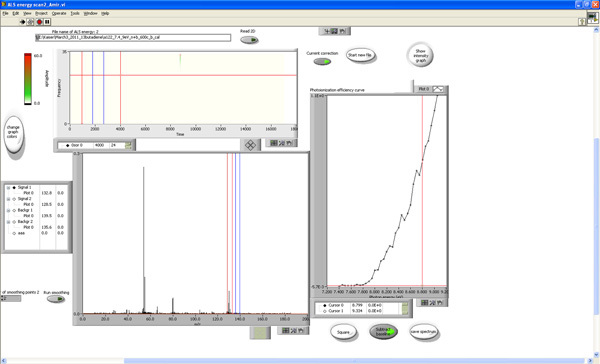 Figure 6. Graphical user interface of the data analysis program. Click here to view larger figure.
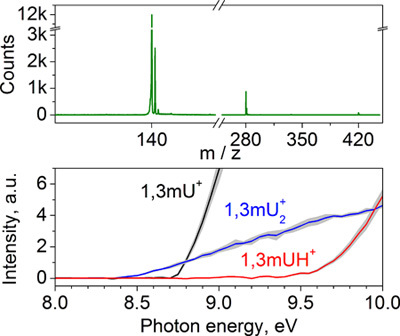 Figure 7. A mass spectrum and photoionization efficiency curve for a 1,3-dimethyluracil molecular beam.
Discussion
The monomers and dimers are generated in a supersonic jet expansion which gives rise to a molecular beam. A small sample of the DNA base is placed in a thermal vaporization source and heated to generate sufficient vapor pressure. Argon gas carries the vapors through a 100 μm orifice and passes a 2 mm skimmer to produce a cold molecular beam14. Alternatively, an effusive beam source can be used, where the sample is placed in a heated oven attached to the repeller plate (ion optics) of the mass spectrometer.
We use vacuum ultraviolet light (7.4-25 eV) to softly ionize the molecules by single photon ionization, this method minimizes the fragmentation and secondary processes and is unmatched by traditional ionization techniques utilizing electron impact schemes. The ions are produced in the interaction region of a Wiley-McLaren13 reflectron Time-of-Flight Mass Spectrometer where they are eventually detected by a micro channel plate. The detector output is fed into a pre-amplifier and a multiscaler card in a personal computer where the data is saved for further analysis. The quasi-continuous radiation arrives from an undulator located at the synchrotron (Advanced Light Source), and then passes through a gas filter where higher harmonics of the light are removed and dispersed via a 3 m monochromator to provide a maximum resolution of 5 meV.
Acknowledgments
The experiments were carried out at the Chemical Dynamics Beamline at the Advanced Light Source, Lawrence Berkeley National Laboratory and supported by the Office of Science, Office of Basic Energy Sciences, of the US Department of Energy under Contract No. DE-AC02-05CH11231, through the Chemical Sciences Division.
References
- Golan A. Ionization of dimethyluracil dimers leads to facile proton transfer in the absence of hydrogen bonds. Nat. Chem. 2012;4:323–329. doi: 10.1038/nchem.1298. [DOI] [PubMed] [Google Scholar]
- Belau L. Vacuum-Ultraviolet Photoionization Studies of the Microhydration of DNA Bases (Guanine, Cytosine, Adenine, and Thymine) The Journal of Physical Chemistry A. 2007;111:7562–7568. doi: 10.1021/jp0705929. [DOI] [PubMed] [Google Scholar]
- Golan A, Ahmed M. Ionization of Water Clusters Mediated by Exciton Energy Transfer from Argon Clusters. The Journal of Physical Chemistry Letters. 2012;3:458–462. doi: 10.1021/jz2016654. [DOI] [PubMed] [Google Scholar]
- Nicolas C. Vacuum Ultraviolet Photoionization of C3. Journal of the American Chemical Society. 2005;128:220–226. doi: 10.1021/ja055430+. [DOI] [PubMed] [Google Scholar]
- Kamarchik E. Spectroscopic signatures of proton transfer dynamics in the water dimer cation. Journal of Chemical Physics. 2010;132 doi: 10.1063/1.3432198. [DOI] [PubMed] [Google Scholar]
- Khistyaev K. The effect of microhydration on ionization energies of thymine. Faraday Discussions. 2011;150:313–330. doi: 10.1039/c0fd00002g. [DOI] [PubMed] [Google Scholar]
- Bravaya KB. The effect of pi-stacking, H-bonding, and electrostatic interactions on the ionization energies of nucleic acid bases: adenine-adenine, thymine-thymine and adenine-thymine dimers. Physical Chemistry Chemical Physics. 2010;12:2292–2307. doi: 10.1039/b919930f. [DOI] [PubMed] [Google Scholar]
- Kostko O. Ionization of cytosine monomer and dimer studied by VUV photoionization and electronic structure calculations. Physical Chemistry Chemical Physics. 2010;12:2860–2872. doi: 10.1039/b921498d. [DOI] [PubMed] [Google Scholar]
- Bravaya KB. Electronic Structure and Spectroscopy of Nucleic Acid Bases: Ionization Energies, Ionization-Induced Structural Changes, and Photoelectron Spectra. Journal of Physical Chemistry A. 2010;114:12305–12317. doi: 10.1021/jp1063726. [DOI] [PubMed] [Google Scholar]
- Leone SR, Ahmed M, Wilson KR. Chemical dynamics, molecular energetics, and kinetics at the synchrotron. Physical Chemistry Chemical Physics. 2010;12:6564–6578. doi: 10.1039/c001707h. [DOI] [PubMed] [Google Scholar]
- Scoles G, Bassi D, Buck U. Atomic and Molecular Beam Methods. 1988;1 [Google Scholar]
- Pauly H. Atom, Molecule and Cluster Beams I. Berlin: Springer-Verlag; 2000. [Google Scholar]
- Wiley WC, McLaren IH. Time-of-Flight Mass Spectrometer with Improved Resolution. Review of Scientific Instruments. 1955;26:1150–1157. [Google Scholar]
- Levy DH. The Spectroscopy of Very Cold Gases. Science. 1981;214:263–269. doi: 10.1126/science.214.4518.263. [DOI] [PubMed] [Google Scholar]


