Abstract
Deterministic mathematical models of biochemical processes operate as if the empirically derived rate constants governing the dynamics are known with certainty. Our objective in this study was to explore the sensitivity of a deterministic model of blood coagulation to variations in the values of its 44 rate constants. This was accomplished for each rate constant at a given time by defining a normalized ensemble standard deviation (wkif(t)) that accounted for the sensitivity of the predicted concentration of each protein species to variation in that rate constant (from 10 to 1000% of the accepted value). A mean coefficient of variation derived from (wkif(t)) values for all protein species was defined to quantify the overall variation introduced into the model's predictive capacity at that time by the assumed uncertainty in that rate constant. A time-average value of the coefficient of variation over the 20-min simulation for each rate constant was then used to rank rate constants. The model's predictive capacity is particularly sensitive (50% of the aggregate variation) to uncertainty in five rate constants involved in the regulation of the formation and function of the factor VIIa–tissue factor complex. Therefore, our analysis has identified specific rate constants to which the predictive capability of this model is most sensitive and thus where improvements in measurement accuracy will yield the greatest increase in predictive capability.
Keywords: blood coagulation, uncertainty, math modeling
1. Introduction
The blood coagulation process represents the initial phase of the biological repair mechanism designed to respond to injuries to the vasculature that result in leakage of blood into the surrounding tissue. Re-establishment of an effective barrier between the intra- and extravascular compartments then allows the slower phase of wound healing to take place. In terms of a chemical reaction network, coagulation involves an intricate sequence of highly interwoven concurrent processes with many simultaneous positive and negative feedback loops regulating its onset, progress and ultimate magnitude. More than 50 soluble and cell-associated protein components of this system have been identified to date (Brummel-Ziedins et al., 2003). The complexity of the catalytic processes has led a number of investigators to use ensembles of ordinary differential equations (ODEs) to achieve an adequate recapitulation of their empirical observations. These include ODE-based models describing the function and regulation of the prothrombinase complex (Nesheim et al., 1984), the extrinsic tenase complex (Lu et al., 2004), fibrinogen conversion to fibrin by thrombin (Lewis et al., 1985) and its regulation by antithrombin III (Naski & Shafer, 1991), and factor Va inactivation (Hockin et al., 1999).
A comprehensive ODE-based model of tissue factor (TF)-initiated blood coagulation developed by Hockin et al. (2002) has been used to understand complex biochemical processes (Bungay et al., 2003; Orfeo et al., 2004, 2005; Butenas et al., 2004; Lo et al., 2005), explore thrombotic risk in healthy and patient populations (Brummel-Ziedins et al. 2005a; Brummel-Ziedins et al. 2005b) and analyze the effectiveness of inhibitors (Adams et al., 2003; Panteleev et al., 2007). A number of groups have reported even more extensive ODE-based models that simulate: blood contributions (Panteleev et al., 2006; Luan et al., 2007; Anand et al., 2008a); flow and blood contributions (Kuharsky & Fogelson, 2001; Ataullakhanov & Panteleev, 2005; Fogelson & Tania, 2005; Anand et al., 2008b) and flow, blood and vessel wall contributions (Xu et al., 2008; Runyon et al., 2008) to the overall coagulation process.
A perfect deterministic model of blood coagulation, i.e. a set of ODEs that explicitly represents all biochemical processes, including the mechanistic contributions of vascular wall elements, extravascular components and circulating cells, combined with flawless measurements of all the relevant protein factor concentrations and knowledge of the position and velocity of all molecules involved in blood flow, could be integrated numerically to make highly accurate predictions of this repair process. However, both practical and theoretical barriers thwart such a construct at this time. Practical impediments include (1) incomplete and/or controversial mechanisms and roles for some proteins (e.g. protein S, protein Z); (2) insufficient empirical data comparing pro- and anticoagulant mechanisms under flow to those observed in closed model systems and (3) a lack of experimental data from models where vessel wall, blood and flow contributions can be analyzed and manipulated to validate the predictions of such a model.
A number of approaches have been taken to circumvent these limitations. Parameter optimization is one approach that addresses insufficiencies in inventory or mechanism by direct fitting of the set of existing model functions to experimental observations (Orfao et al., 2006). Another approach is to reduce the complexity of the model by removing equations that have little or no impact on its predictive capacity (Wagenvoord et al., 2006). However, these reductionist approaches potentially limit the utility of the adjusted model to the empirical system to which they have been fit.
At the theoretical level, ODE-based modelling is constrained because it requires that the rate constants governing the reactions adequately describe the dynamics of the coagulation cascade in all volumes of blood and are without error. In addition, these models assume that rate constants do not vary across a population of subjects from diverse genetic backgrounds. A related limitation is the assumption that the initial concentrations of model reactants are precisely known. To date, studies that assess the sensitivity of ODE-based models to the actual uncertainty that characterizes empirically derived modelling parameters have been used to inform measurement practices (Aldridge et al., 2006), define probability distributions for more sophisticated stochastic simulations (Lo et al., 2005) and identify drug targets (Luan et al., 2007).
In this study, we systematically evaluate the effect of perturbing, across an experimentally relevant range, the rate constants of an empirically validated ODE-based model of TF-initiated blood coagulation. Specific rate constants are identified to which the predictive capacity of the model is most sensitive and where an increase in measurement accuracy will yield the best performance in model accuracy.
2. Methods
2.1. Model description
The Hockin et al. model (2002) describes TF-initiated blood coagulation and, as modified (Butenas et al., 2004), consists of a set of 29 chemical reactions describing the concentrations of a subset of proteins known to be crucial to the coagulation cascade (see Supplemental Table 1) (Jones & Mann, 1994; Hockin et al., 2002). These reactions are converted to a system of 34 ODEs using the laws of mass action kinetics (see Appendix). These ODEs couple via their shared species yielding a reaction pathway representing the production and consumption of individual species. The rate constants (see Supplemental Table 1) governing the rate at which the species concentrations change over time are derived from experimental measurements made under conditions of saturating concentrations of phospholipid or in a few cases by extrapolation from analogous reactions (Hockin et al., 2002).
Initial reaction conditions for the model are given by the concentrations of the 34 species involved, 9 of which are initially non-zero and reflect the average values observed in a healthy population and one species, TF, set to 5 pM (see Supplemental Table 2). MatLab’s stiff solver ode15s (Shampine & Reichelt, 2008) was used to integrate the ODE model with variable time steps whose maximum size was set to 5 × 10⁻³ s. Each simulation consists of a deterministic integration of length 20 min. To evaluate the rate constants in our model, 836 simulations (19 for each rate constant) were performed yielding 20-min time courses for all 34 species at 1-s intervals.
2.2. Model output
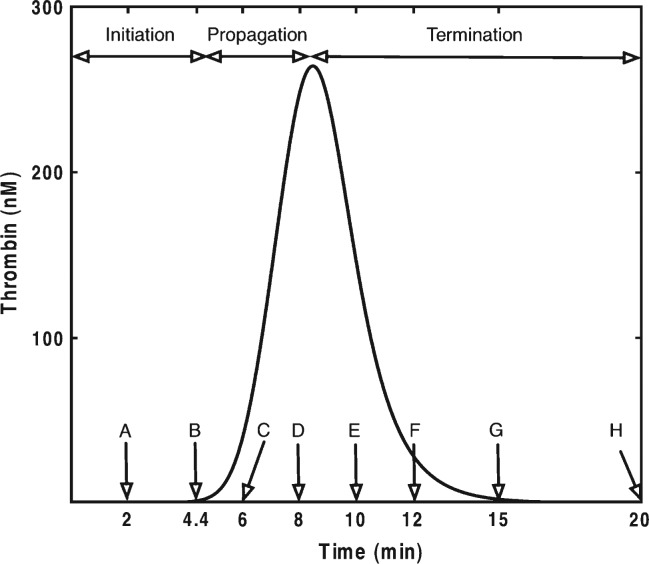
The output of the model specifies the concentrations of 34 species over time. The selected 20-min time frame is sufficient to capture the process of thrombin generation in the empirical models used to validate the Hockin et al. model (2002). In empirical models, thrombin is the most common analyte chosen for examination because of its ease of measurement and its central and diverse roles (Crawley et al., 2007). Thrombin generation in these closed model systems displays three distinct phases: initiation of coagulation, propagation of α-thrombin formation and termination of the procoagulant response. To illustrate in detail the consequences of rate constant uncertainty, we chose eight time points (2, 4.4, 6, 8, 10, 12, 15 and 20 min) reflecting key moments during the process of thrombin generation (a typical numerical solution is shown in Fig. 1). The initiation phase is represented by the 2-min time point (Fig. 1, pt A). The 4.4-min time point represents the average clot time in empirical model systems that relate to the Hockin et al. model (2002). Clot time represents the transition point from the initiation phase to the propagation phase (Fig. 1, pt B). The 6-min point represents the propagation phase, a time of rapid thrombin generation (Fig. 1, pt C). The 8-min point represents peak thrombin levels (Fig. 1, pt D). The 10- and 12-min points span the period during which free thrombin levels are rapidly being suppressed by endogenous protease inhibitors (Fig. 1, pts, E,F), while the 15- and 20-minute points capture the aftermath of the procoagulant response (Fig. 1, pts, G,H), a state of potential importance to the overall barrier function of a clot (Orfeo et al., 2005, 2008).
Fig. 1.
Typical thrombin generation progress curve illustrating the three phases of the clotting process observed in closed model systems of coagulation. Labelled arrows refer to specific times where results of sensitivity analyses are shown.
2.3. Model sensitivity
To characterize the impact of rate constant uncertainty, the magnitude of variation for a given output (e.g. time to peak thrombin level) resulting from simultaneous perturbation of all rate constants across a specific range of values should be calculated. However, such an ensemble experiment, even if each rate constant was only assigned three hypothetical values, would require 344 or ∼ 1020 individual simulations. If each takes 1 min on a single computer, the total computing time would be approximately 1,000,000 billion central processing unit years. The alternative approach taken here to characterize the impact of rate constant (ki) uncertainty was to use values of the rate constants perturbed, one at a time, between 10 and 1000% (0.1ki − 10ki) of the accepted values. The range of variation was selected to encompass the range of variation characterizing the estimates of these rate constants in the published literature. One hundred percent is the standard model value and 10 – 1000% will be referred to as the ensemble range. The sensitivity of rate constant ki is examined by integrating the ODE model with rate constant ki given by 10 linearly spaced values between 10 and 100% of ki and 10 linearly spaced values between 100 and 1000% of ki. The model response to changes in ki is measured by changes in species (f) concentrations.
2.4. Ensemble standard deviation
For any given model species (f) at any selected time (t), an ensemble standard deviation ( ) characterizing the variation in that species concentration is calculated from the set of predicted time courses for that species generated by varying a given rate constant (ki) across a linearly spaced range (10–1000) of values.
2.5. Coefficient of variation
The coefficient of variation ( ) is defined to be the ensemble standard deviation normalized by the peak value (P(f)) of the standard model curve (100% model values) for each species. For example, thrombin (IIa) response to variance in k36 is given by , where 264 nM thrombin is the peak concentration of thrombin under standard conditions (see Fig. 1). Normalization was performed in order to avoid numerical effects related to the differences in concentrations (> 106) between species in the pathway. The peak concentration (P(f)) was chosen as the normalization factor rather than the corresponding concentration at time t from the standard model curve or the ensemble mean curve because these are both time dependent.
2.6. Time-averaged coefficient of variation
For every rate constant and each species, the coefficients of variation ( ) were averaged over the 20-min simulation. For rate constant (ki) at time t, the mean coefficient of variation for all protein species is given by . The time average of γi (t) for ki over the 20-min simulation is given by Γj. This value is a measure of the overall sensitivity of all factors to variation in ki. The relative magnitude of these values provide a simple measure of each species response to uncertainty in rate constant ki. Thrombin was evaluated individually and then a global assessment of the impact on all species was conducted.
2.7. Explained variance
To compare Γj values, we define ‘explained variance’ as , where Γ̂j is given by Γj sorted by magnitude. Thrombin was evaluated individually and then a global assessment of the impact on all species was conducted. The explained variance is a mechanism for ranking rate constants on the basis of their contribution to the total variance and thereby identifies rate constants for which uncertainty in their values has the greatest consequences.
3. Results
3.1. Sensitivity of thrombin to uncertainty
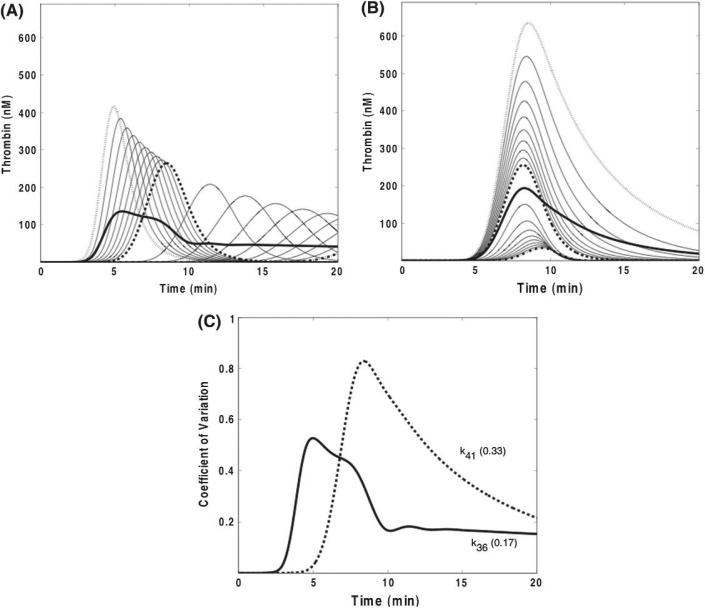
Figure 2 presents the results of varying two of the rate constants on thrombin generation: Panel A presents the family of time course data generated by varying k36 (TF·VIIa·Xa + TFPI → TF·VIIa·Xa·TFPI) and Fig. 2B by varying k41 (IIa + AT → IIa·AT). The ensemble standard deviation (σ(t)) (dark solid curve) provides a quantitative measure of the range of variation in thrombin concentration at each time point induced by rate constant uncertainty. The primary consequences of error in k36 are observed as alterations in the duration of the initiation phase with times to peak thrombin concentrations ranging from 4 to greater than 20 min. However, measurement error in k41 results in peak thrombin levels varying over a 20-fold range, while times to peak thrombin concentrations are relatively constant. Normalization of the σ(t) generated the dimensionless coefficient of variation ( ) as a first approximation for comparative purposes of the thrombin response to uncertainty in ki (Fig. 2C). The temporal dependence of both σ(t) and illustrate the extent to which the sensitivity of f (in this case thrombin) to variance in ki can be related to discrete phases of the coagulation process. For example, the results of the analysis showing that variation in k36 has the most profound effects on the progress of the reaction during the initiation phase are consistent with empirical findings demonstrating that independence from TF·VIIa is achieved prior to the onset of the propagation phase (Orfeo et al., 2005).
Fig. 2.
Sensitivity of α-thrombin concentration to rate constant (ki) variation: time series of thrombin concentrations when varying k36or k41. Panel A: variation of k36 (governing the formation of TF · VIIa · Xa · TFPI from the reaction of TF · VIIa · Xa with TFPI) from 3.2 × 10⁷ M−1s−1 (dotted curve) to 3.2 × 10⁸ M−1s−1 (standard model value, dashed curve) to 3.2 × 10⁹ M−1s−1 (dash dot curve). The standard deviation associated with the mean thrombin concentration at each time point is shown as a solid line. Panel B: variation of k41 (governing the reaction of AT with α-IIa) from 7.2 × 10² M−1 s−1 (dotted curve) to 7.1 × 10³ M−1s−1 (standard model value, dashed curve) to 7.1 × 10⁴ M−1s−1 (dash dot curve). The standard deviation associated with the mean thrombin concentration at each time point is shown as a solid line. Panel C: the coefficient of variation ( ) at each time point is plotted for k36 and k41. The time-averaged coefficient of variation values (defined as the mean of the coefficient of variations across the 20-min simulation) are also shown for each rate constant.
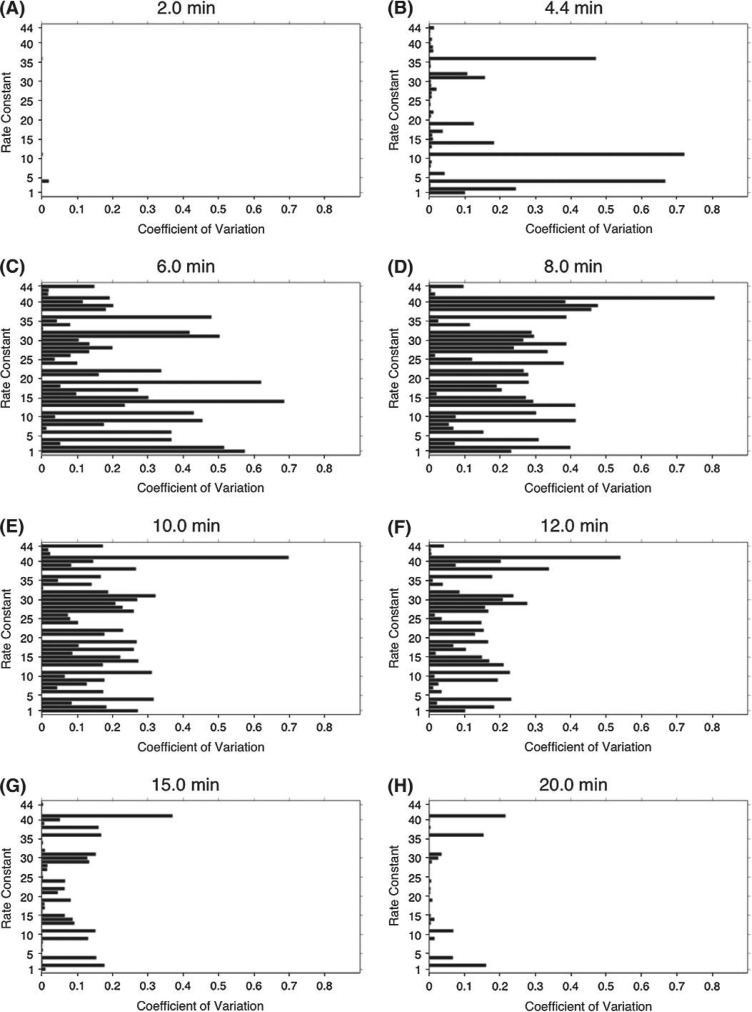
Figure 3 depicts the coefficient of variation for thrombin ( ) as a function of ki at specific times during the phases of coagulation (See Supplemental Table 1 for equations associated with each rate constant). Larger bars indicate that measurement error in those rate constants would have more profound consequences on predicting thrombin levels at that time. Consistent with the more detailed analysis presented for each individual rate constant, k36 and k41 (Fig. 2),the magnitude of the effect of error in each rate constant on thrombin generation has a unique pattern with respect to its temporal dependence. Visual inspection suggests that error in certain rate constants (e.g. k41 & k4) has a comparitively larger impact with respect to predicting thrombin levels throughout the reaction time course.
Fig. 3.
Thrombin sensitivity across the 10–1000% parameter range for each rate constant at selected times. The coefficient of variation ( ) characterizing predicted thrombin concentrations is plotted for each k1−44 at t = 2, 4.4, 6, 8, 10, 12, 15 and 20 min.
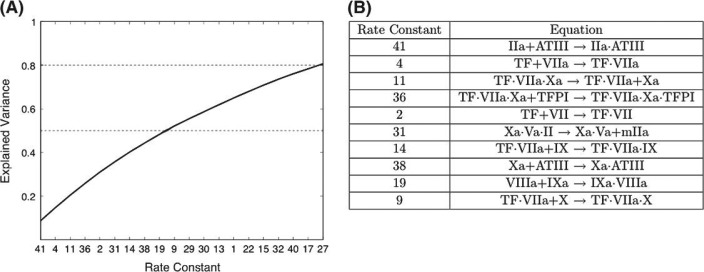
In order to globally compare the effect of uncertainty in each ki with respect to thrombin levels, a time-averaged coefficient for each rate constant was generated and then expressed as a fraction of the sum of all the time-averaged coefficients for all 44 rate constants. These values (termed explained variance, Γj) indicate the relative magnitude of the contribution of uncertainty in each ki to the overall variance in thrombin levels induced by the assumed range of measurement error. Figure 4A presents a ranked ordering of the 20 most contributive rate constants. The first 10 rate constants contribute approximately 50% of the variance observed. The reactions governed by these 10 rate constants are shown in Fig. 4B. These 10 rate constants control processes throughout all three phases of the reaction. Of the remaining 34 rate constants, 24 (not shown in Fig. 4) contribute less than 20% of the aggregate variance.
Fig. 4.
Ranking rate constants by the effect that uncertainty in their values has on thrombin levels. The explained variance is defined as the time-averaged coefficient of variation for thrombin for a given ki expressed as a fraction of the sum of all the time-averaged coefficients of variation for IIa for all 44 ki. Panel A: rate constants (x-axis, see Appendix for list of equations) ranked in descending order by the magnitude of their contribution (Γj) to the overall variance (y-axis). The line displays the aggregate explained variance as each rate constant’s contribution is added. Panel B: the reactions governed by the 10 rate constants where uncertainty in the rate constants has the greatest effect on thrombin levels.
3.2. Sensitivity of all model species (f) to uncertainty
The above analysis stratified rate constants based on the impact that uncertainty in their values would have on the prediction of thrombin levels. The primacy of thrombin as an analyte in experimental coagulation models, however, does not extend to this computational approach where the goal is to recapitulate the complexity of the process, i.e. adequately represent time course data for its 34 species.
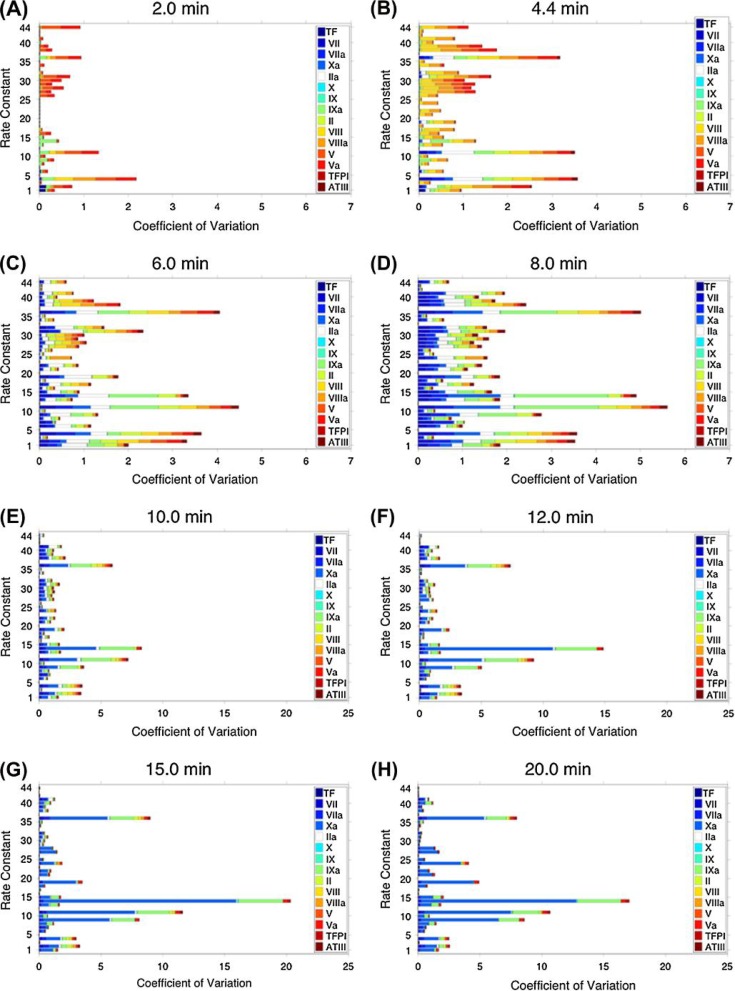
Figure 5 presents coefficients of variation ( ) for a subset of species for all 44 rate constants at specific time points during the three phases of coagulation. Different colored bars represent the various species with the magnitude of the coefficient of variation depicted by bar length. Only 15 species, including the species present at the onset of the reaction and their activated products, are depicted in order to reduce the complexity of the image. A supplemental movie is available that visualizes each second of the reaction in terms of the coefficients of variations of all species for all 44 rate constants. The overall length of each composite bar for each rate constant provides a basis for identifying the rate constants where the assumed error range (or lack of accuracy in the rate constant value) generates the largest variation in species concentrations at that time point.
Fig. 5.
Sensitivity of a selected group of model species across the 10–1000% parameter range for each rate constant. Protein species are identified by colors and block size represents the magnitude of the coefficient of variation ( , x-axis) for each species for each k1−44 (y-axis) at t = 2, 4.4, 6, 8, 10, 12, 15 and 20 min.
Table 1 identifies for all 34 model species the rate constants to which all species concentrations are most (>5% of total variation) and least sensitive (<0.05% of the total variation) in the overall evaluation of the TF-initiated pathway. The analysis in Fig. 5 focuses on 15 of these species. The aggregate bar length of each rate constant is expressed as a fraction of the sum of all the bar lengths within one time point. The analysis indicates that at any time, the major contribution to the overall variance in species concentrations due to uncertainty is from a small number of rate constants and that the ensemble of these rate constants differs at each time point. Across the selected time points, only 10 different rate constants meet the >5% criteria. The number of rate constants contributing <0.05% ranges from 6 to 13 at any of the selected times and involves 17 unique rate constants.
Table 1.
Time-dependent sensitivity of rate constants to uncertainty
| Time (min) | Most Sensitive Rate Constants† | Least Sensitive Rate Constants‡ | |||||||||||||||||
|---|---|---|---|---|---|---|---|---|---|---|---|---|---|---|---|---|---|---|---|
| 2 | k4 | k11 | k36 | k44 | k2 | k31 | k23 | k20 | k12 | k25 | k5 | k7 | k18 | k37 | k21 | k22 | k33 | k24 | k19 |
| 4.4 | k4 | k11 | k36 | k2 | k23 | k20 | k12 | k5 | k37 | k33 | |||||||||
| 6 | k11 | k36 | k4 | k14 | k2 | k31 | k12 | k20 | k5 | k23 | k37 | k33 | |||||||
| 8 | k11 | k36 | k14 | k4 | k2 | k12 | k20 | k5 | k37 | k23 | k33 | ||||||||
| 10 | k14 | k11 | k36 | k9 | k4 | k2 | k20 | k12 | k5 | k37 | k33 | k23 | |||||||
| 12 | k14 | k11 | k36 | k9 | k20 | k5 | k12 | k33 | k37 | k23 | k43 | ||||||||
| 15 | k14 | k11 | k36 | k9 | k5 | k20 | k12 | k33 | k43 | k37 | k26 | k16 | k23 | ||||||
| 20 | k14 | k11 | k9 | k36 | k19 | k24 | k5 | k20 | k12 | k43 | k26 | k16 | k33 | k44 | k37 | ||||
>5% of total variation.
<0.5% of total variation.
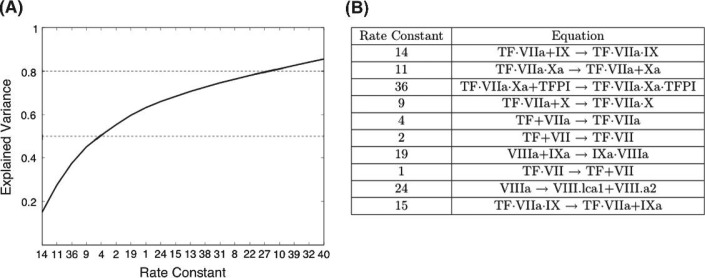
Reevaluating the data in terms of explained variance resulted in the identification and ranking of the 20 largest contributors to the overall variance for all species (Fig. 6A). This analysis indicates that measurement uncertainty in five rate constants contribute approximately 50% of the variance observed from perturbation of all 44 rate constants; the reactions controlled by these rate constants are shown in Fig. 6B. These five rate constants govern reactions in the initiation phase and are involved in the regulation of the formation and function of TF·VIIa. Twenty-four rate constants, not displayed in Fig. 6, contribute less than 13% of the total variance calculated.
Fig. 6.
Ranking rate constants by the effect that uncertainty in their values has on the levels of all model species. Panel A: rate constants (x-axis, see Appendix for list of equations) ranked in descending order by the magnitude of their contribution (Γj) to the overall variance (y-axis). The line displays the aggregate explained variance as each rate constant’s contribution is added. Panel B: the reactions governed by the 10 rate constants where uncertainty in the rate constants has the greatest effect on model predictability.
3.3. Stability of the system of ODEs
During a single numerical simulation, using normal values for rate constants and factor concentrations, the number of eigenvalues of the Jacobian (matrix of partial derivatives) with positive real part is bounded between 1 and 10 and averages approximately 5. This implies that during a typical simulation, the numerical solution is unstable in as many as 10 different directions in the state space and on average uncertainty in factor concentrations will be growing in approximately 5 dimensions (some very slowly) and shrinking in approximately 24 directions (most very slowly) (Danforth & Yorke, 2006).
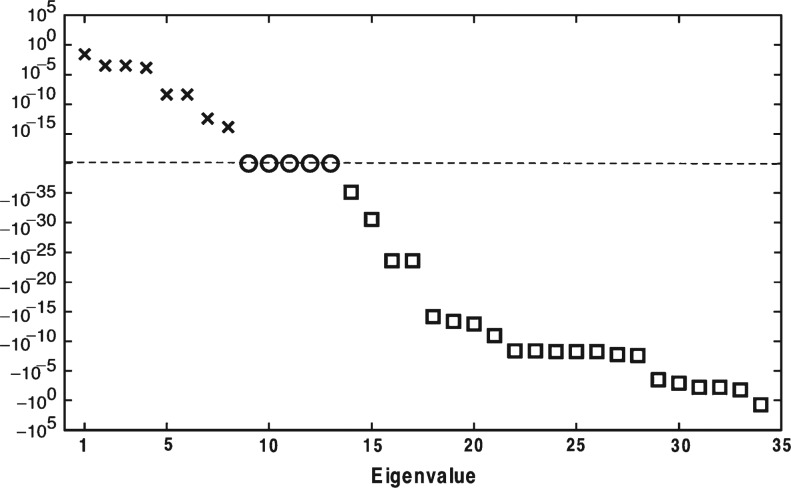
Figure 7 presents the analysis of one time point, 4.4 min. At this time, there are 8 eigenvalues with positive real part and 21 with negative real part (Fig. 7). Five of the eigenvalues are zero due to the fact that chemical expressions 23 through 27, seen in Supplemental Table 1, produce species that do not interact (antithrombin III complexes with enzymes). Across the entire 20-min time frame, the average number of eigenvalues with positive real part is seen to vary between 4 and 7 for one-by-one perturbation of rate constants (data not shown). Rate constants whose accuracy was shown to have little effect on predicted species levels (the 24 rate constants that accounted for <13% of the explained variance in Fig. 6) were also seen to have negligible effect on the average number of eigenvalues with positive real part.
Fig. 7.
The eigenvalue spectrum for the Jacobian matrix associated with the ODE model at time t = 4 min. There are 8 eigenvalues with positive real part and 21 with negative real part. The system of ODE’s is stiff, with a condition number (ratio of the largest singular value to the smallest) of roughly 1025 at t = 4.4 min.
4. Discussion
In this study, we evaluate the effect of uncertainty in the value of rate constants used in a previously published mathematical model (Hockin et al., 2002) describing the TF-initiated pathway of coagulation. These analyses have identified 5 of 44 rate constants to which the predictive capacity of the model is most sensitive, accounting for 50% of the overall variation induced by the selected parameter range. These same rate constants explain 25% of the aggregate variation in predicted thrombin levels.
Compilations of empirically derived rate constant(s) for a given process typically yield a range of values when reported by different laboratories or from the same laboratory at different times. Sources of this variation are well known to investigators and include the origins of the proteins (e.g. recombinant vs. plasma derived), variations in the specific activity of proteins after isolation from the same source, variable buffer composition, differences in the handling and assay of relatively unstable species (e.g. factor VIIIa) and differences in the surfaces upon which many coagulation catalytic complexes must assemble and function (e.g. phospholipid composition and concentration). Even for a relatively simple reaction, one without surface or cofactor dependence, like the reaction of factor Xa with antithrombin III (k38 in this analysis), published values from four laboratories vary over a 3-fold range.
In principle, a single integration of a deterministic ODE-based model cannot incorporate available empirical estimates of the magnitude of measurement variation as part of its respective model values and therefore can not generate predictions that capture the consequences of this uncertainty. The current analysis attempts to gauge the implications of measurement imprecision in a reaction network governed by 44 rate constants by mechanically probing a parameter range extending from 10-fold below to 10-fold above the standard model value for each rate constant. The intent was to exceed the range of variation that characterizes the state of the art with respect to the most complex of the modeled reactions. A central result of our analyses was that rate constants could be stratified in terms of the impact that uncertainty in their values, i.e. measurement imprecision, caused in model outputs. If the consequences of perturbing each of the rate constants across the same parameter range had been of equal significance, each would have contributed 1/44th(∼ 2.3%) to the aggregate variance. However, with respect to the output of all model species across the entire time frame, 10 rate constants contribute less than 0.1% each to the aggregate variance and 24 rate constants collectively contribute no more than k14 alone. A similar result was observed when thrombin was the monitored output parameter: 12 rate constants contributed less than 0.1% each and the contribution of the most sensitive rate constant (k41) was equivalent to the contribution of the 19 least influential rate constants.
In the global analysis of the effects of rate constant uncertainty, the five most sensitive rate constants govern reactions critical to events during the initiation phase. All involve the TF–VIIa complex. The effect of uncertainty in these rate constants is not limited to the prediction of species levels during the initiation phase but is seen throughout the 20-min reaction time course (see Table 1). When the analysis is focused on a single species, thrombin, a major difference from the global assessment is the importance of k41, which governs the inhibition of thrombin by antithrombin III. Literature values for k41 are in good agreement, falling within a 2-fold range. However, the importance of rate constants k36, k11 and k4 is still present, reflecting the importance of accurately measuring the rate constants governing the initiating complex.
In summary, our analyses identified a handful of rate constants for which the effects on the predictive capacity of the model are most severe if differences exist between the current model values and the ‘actual’ values governing reactions in a given empirical setting under study. Improvements, if possible, in the measurement accuracy of these rate constants will yield the greatest benefits to the predictive capacity of this model. Likewise, rate constants whose variance is determined to have little effect should remain unperturbed in predictions made by drawing ensembles of rate constants from stochastic distributions. The lack of sensitivity to uncertainty in these rate constants reduces the dimension of the space from which the ensemble is sampling.
Acknowledgments
The authors would like to thank Matthew T. Gissel for his work on the mathematical model.
Footnotes
Funding
This work was supported by the DOE Experimental Program to Stimulate Competitive Research to T.O. and K.B.Z. and NIH HL46703 to K.B.Z.
References
- Adams TE, Everse SJ, Mann KG. Predicting the pharmacology of thrombin inhibitors. J Thromb Haemost. 2003;1:1024–1027. doi: 10.1046/j.1538-7836.2003.00127.x. [DOI] [PubMed] [Google Scholar]
- Aldridge BB, Burke JM, Lauffenburger DA, Sorger PK. Physicochemical modelling of cell signalling pathways. Nat Cell Biol. 2006;8:1195–1203. doi: 10.1038/ncb1497. [DOI] [PubMed] [Google Scholar]
- Anand M, Rajagopal K, Rajagopal KR. A model for the formation, growth, and lysis of clots in quiescent plasma. A comparison between the effects of antithrombin III deficiency and protein C deficiency. J Theor Biol. 2008a;253:725–738. doi: 10.1016/j.jtbi.2008.04.015. [DOI] [PubMed] [Google Scholar]
- Anand M, Rajagopal K, Rajagopal KR. A model incorporating some of the mechanical and biochemical factors underlying clot formation and dissolution in flowing blood. J Theor Med. 2008b;5:183–218. [Google Scholar]
- Ataullakhanov FI, Panteleev MA. Mathematical modeling and computer simulation in blood coagulation. Pathophysiol Haemost Thromb. 2005;34:60–70. doi: 10.1159/000089927. [DOI] [PubMed] [Google Scholar]
- Brummel-Ziedins K, Orfeo T, Jenny NS, Everse SJ, Mann KG. Blood coagulation and fibrinolysis. In: Greer JP, Foerster J, Lukens J, Rodgers GM, Paraskevas F, Glader B, editors. Wintrobe’s Clinical Hematology. Philadelphia, PA: Lippincott Williams & Wilkins; 2003. pp. 677–774. [Google Scholar]
- Brummel-Ziedins KE, Vossen CY, Butenas S, Mann KG, Rosendaal FR. Thrombin generation profiles in deep venous thrombosis. J Thromb Haemost. 2005a;3:2497–2505. doi: 10.1111/j.1538-7836.2005.01584.x. [DOI] [PMC free article] [PubMed] [Google Scholar]
- Brummel-Ziedins KE, Vossen CY, Rosendaal FR, Umezaki K, Mann KG. The plasma hemostatic proteome: thrombin generation in healthy individuals. J Thromb Haemost. 2005b;3:1472–1481. doi: 10.1111/j.1538-7836.2005.01249.x. [DOI] [PMC free article] [PubMed] [Google Scholar]
- Bungay SD, Gentry PA, Gentry RD. A mathematical model of lipid-mediated thrombin generation. Math Med Biol. 2003;20:105–129. doi: 10.1093/imammb/20.1.105. [DOI] [PubMed] [Google Scholar]
- Butenas S, Orfeo T, Gissel MT, Brummel KE, Mann KG. The significance of circulating factor IXa in blood. J Biol Chem. 2004;279:22875–22882. doi: 10.1074/jbc.M400531200. [DOI] [PubMed] [Google Scholar]
- Crawley JT, Zanardelli S, Chion CK, Lane DA. The central role of thrombin in hemostasis. J Thromb Haemost. 2007;5:95–101. doi: 10.1111/j.1538-7836.2007.02500.x. [DOI] [PubMed] [Google Scholar]
- Danforth CM, Yorke JA. Making forecasts for chaotic physical processes. Phys Rev Lett. 2006;96:144102, 1–4. doi: 10.1103/PhysRevLett.96.144102. [DOI] [PubMed] [Google Scholar]
- Fogelson AL, Tania N. Coagulation under flow: the influence of flow-mediated transport on the initiation and inhibition of coagulation. Pathophysiol Haemost Thromb. 2005;34:91–108. doi: 10.1159/000089930. [DOI] [PubMed] [Google Scholar]
- Hockin MF, Cawthern KM, Kalafatis M, Mann KG. A model describing the inactivation of factor Va by APC: bond cleavage, fragment dissociation, and product inhibition. Biochemistry. 1999;38:6918–6934. doi: 10.1021/bi981966e. [DOI] [PubMed] [Google Scholar]
- Hockin MF, Jones KC, Everse SJ, Mann KG. A model for the stoichiometric regulation of blood coagulation. J Biol Chem. 2002;277:18322–18333. doi: 10.1074/jbc.M201173200. [DOI] [PubMed] [Google Scholar]
- Jones KC, Mann KG. A model for the tissue factor pathway to thrombin. II. A mathematical simulation. J Biol Chem. 1994;269:23367–23373. [PubMed] [Google Scholar]
- Kuharsky AL, Fogelson AL. Surface-mediated control of blood coagulation: the role of binding site densities and platelet deposition. Biophys J. 2001;80:1050–1074. doi: 10.1016/S0006-3495(01)76085-7. [DOI] [PMC free article] [PubMed] [Google Scholar]
- Lewis SD, Shields PP, Shafer JA. Characterization of the kinetic pathway for liberation of fibrinopeptides during assembly of fibrin. J Biol Chem. 1985;260:10192–10199. [PubMed] [Google Scholar]
- Lo K, Denney WS, Diamond SL. Stochastic modeling of blood coagulation initiation. Pathophysiol Haemost Thromb. 2005;34:80–90. doi: 10.1159/000089929. [DOI] [PubMed] [Google Scholar]
- Lu G, Broze GJ, Jr, Krishnaswamy S. Formation of factors IXa and Xa by the extrinsic pathway: differential regulation by tissue factor pathway inhibitor and antithrombin III. J Biol Chem. 2004;279:17241–17249. doi: 10.1074/jbc.M312827200. [DOI] [PubMed] [Google Scholar]
- Luan D, Zai M, Varner JD. Computationally derived points of fragility of a human cascade are consistent with current therapeutic strategies. PLoS Comput Biol. 2007;3:e142. doi: 10.1371/journal.pcbi.0030142. [DOI] [PMC free article] [PubMed] [Google Scholar]
- Naski MC, Shafer JA. A kinetic model for the alpha-thrombin-catalyzed conversion of plasma levels of fibrinogen to fibrin in the presence of antithrombin III. J Biol Chem. 1991;266:13003–13010. [PubMed] [Google Scholar]
- Nesheim ME, Tracy RP, Mann KG. “Clotspeed,” a mathematical simulation of the functional properties of prothrombinase. J Biol Chem. 1984;259:1447–1453. [PubMed] [Google Scholar]
- Orfao SM, Jank G, Mottaghy K. A new mathematical approach to modelling thrombin generation. Int J Artif Organs. 2006;29:703–708. doi: 10.1177/039139880602900710. [DOI] [PubMed] [Google Scholar]
- Orfeo T, Brufatto N, Nesheim ME, Xu H, Butenas S, Mann KG. The factor V activation paradox. J Biol Chem. 2004;279:19580–19591. doi: 10.1074/jbc.M400727200. [DOI] [PubMed] [Google Scholar]
- Orfeo T, Brummel-Ziedins KE, Gissel M, Butenas S, Mann KG. The nature of the stable blood clot procoagulant activities. J Biol Chem. 2008;283:9776–9786. doi: 10.1074/jbc.M707435200. [DOI] [PMC free article] [PubMed] [Google Scholar]
- Orfeo T, Butenas S, Brummel-Ziedins KE, Mann KG. The tissue factor requirement in blood coagulation. J Biol Chem. 2005;280:42887–42896. doi: 10.1074/jbc.M505506200. [DOI] [PMC free article] [PubMed] [Google Scholar]
- Panteleev MA, Ananyeva NM, Ataullakhanov FI, Saenko EL. Mathematical models of blood coagulation and platelet adhesion: clinical applications. Curr Pharm Des. 2007;13:1457–1467. doi: 10.2174/138161207780765936. [DOI] [PubMed] [Google Scholar]
- Panteleev MA, Ovanesov MV, Kireev DA, Shibeko AM, Sinauridze EI, Ananyeva NM, Butylin AA, Saenko EL, Ataullakhanov FI. Spatial propagation and localization of blood coagulation are regulated by intrinsic and protein C pathways, respectively. Biophys J. 2006;90:1489–1500. doi: 10.1529/biophysj.105.069062. [DOI] [PMC free article] [PubMed] [Google Scholar]
- Runyon MK, Kastrup CJ, Johnson-Kerner BL, Ha TG, Ismagilov RF. Effects of shear rate on propagation of blood clotting determined using microfluidics and numerical simulations. J Am Chem Soc. 2008;130:3458–3464. doi: 10.1021/ja076301r. [DOI] [PubMed] [Google Scholar]
- Shampine LF, Reichelt MW. The MATLAB ODE Suite. SAIM J Sci Comput. 2008;18:1–22. [Google Scholar]
- Wagenvoord R, Hemker PW, Hemker HC. The limits of simulation of the clotting system. J Thromb Haemost. 2006;4:1331–1338. doi: 10.1111/j.1538-7836.2006.01967.x. [DOI] [PubMed] [Google Scholar]
- Xu Z, Chen N, Kamocka MM, Rosen ED, Alber M. A multiscale model of thrombus development. J R Soc Interface. 2008;5:705–722. doi: 10.1098/rsif.2007.1202. [DOI] [PMC free article] [PubMed] [Google Scholar]


