

Abstract
In this article, the authors propose to simultaneously test for marginal genetic association and gene-environment interaction to discover single nucleotide polymorphisms that may be involved in gene-environment or gene-treatment interaction. The asymptotic independence of the marginal association estimator and various interaction estimators leads to a simple and flexible way of combining the 2 tests, allowing for exploitation of gene-environment independence in estimating gene-environment interaction. The proposed test differs from the 2-df test proposed by Kraft et al. (Hum Hered. 2007;63(2):111–119) in two respects. First, for the genetic association component, it tests for marginal association, which is often the primary objective in inference, rather than the main effect in a model with gene-environment interaction. Second, the gene-environment testing component can easily exploit putative gene-environment independence using either the case-only estimator or the empirical Bayes estimator, depending on whether the goal is gene-treatment interaction in a randomized trial or gene-environment interaction in an observational study. The use of the proposed joint test is illustrated through simulations and a genetic study (1993–2005) from the Women's Health Initiative.
Keywords: association, empirical Bayes, genetic epidemiology, genetics, gene-environment interaction, two-stage procedure
In recent years, population-based genome-wide association studies with single nucleotide polymorphisms (SNPs) have identified novel susceptibility loci for many complex traits (1). Genetic associations identified so far are generally weak, accounting for only a small fraction of heritability (2). It has been suggested that gene-environment interaction explains part of the “missing heritability” (3). However, few loci that interact with environmental exposures have been identified (4, 5). The shortage of new discoveries may be caused by the generally low statistical power to detect gene-environment interaction and the difficulty of reliably measuring the pertinent environmental attributes. Recognizing the difficulty involved in identifying gene-environment interactions, we are concerned in this article with the discovery of genetic association, while accounting for the potential heterogeneous genetic effects across various levels of the environmental variable under investigation.
Consider a typical case-control genome-wide association study. Let Y denote the binary disease outcome, E denote the environmental variable, and G denote the genetic score coded by the number of minor (SNP) alleles (0, 1, or 2). Let W be a vector of potential confounders to be adjusted for when assessing genetic association (e.g., other clinical predictors and possibly principal components for population substructure). The following two logistic regression models can be considered for genetic association analysis:
| (1) |
and
 |
(2) |
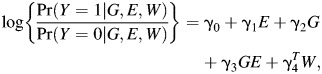
where model 1 can be used to test for the marginal genetic effect, β1 = 0, and model 2 can be used to test the multiplicative gene-environment interaction, γ3 = 0. These are two distinct hypotheses that are generally being tested in a SNP-by-SNP fashion separately. It is well known that despite the case-control retrospective sampling scheme, efficient estimation of the slope parameters in models 1 and 2 is achieved by maximizing the prospective likelihood with a standard logistic regression analysis (6).
While estimation of marginal genetic association has been well established, much recent effort has been devoted to developing efficient and robust statistical methods for detecting gene-environment interaction. Some methods exploit putative gene-environment independence in the estimation (7–11), notably the case-only (CO) estimator (7, 8) and the empirical Bayes (EB) estimator (10), while others attempt to enrich gene-environment interaction by restricting a second-stage analysis to a subset of SNPs that meet independent filtering criteria (12–15). While gene-environment interaction is no doubt of keen interest by itself, another potential use of gene-environment interaction is perhaps to help better identify and localize genetic susceptibility loci. To this end, a joint test of the main genetic effect γ2 and the gene-environment interaction γ3 in model 2, henceforth referred to as the Kraft 2-df test (16), was proposed to achieve good power in gene discovery under a variety of disease penetrance models. Notably, the Kraft 2-df test has been used to successfully discover a gene that interacts with coffee in the risk of Parkinson's disease (5). We provide a detailed description of these methods in the Web Appendix, which is posted on the Journal's website (http://www.aje.oxfordjournals.org/).
In randomized clinical trials, identifying genetic variants that influence treatment response may directly inform “personalized” treatment or prevention. In this case, the difficulty of measuring a key environmental exposure is circumvented and the intention-to-treat effect can be unbiasedly estimated. Our motivational example is genetic studies carried out within the clinical trial component of the Women's Health Initiative. The Women's Health Initiative was a major disease-prevention research program carried out among postmenopausal women which included a randomized controlled clinical trial component and a companion observational study (17). In the clinical trial component, 4 distinct interventions were evaluated: conjugated equine estrogens alone, conjugated equine estrogens in combination with medroxyprogesterone acetate, dietary modification with a low-fat eating pattern, and calcium and vitamin D supplementation. Several case-control genetic association studies have been launched within the Women's Health Initiative clinical trials to study the association of genes with disease risk and gene-treatment interaction. The gene-treatment independence is guaranteed by the randomization, so that the CO estimator or semiparametric estimators exploiting gene-treatment independence can be confidently used (18). However, the potential of a randomized exposure to inform joint testing for genetic association and gene-treatment interaction has yet to be fully elucidated.
In this article, we consider simultaneously testing for marginal genetic association and gene-environment interaction while exploiting potential gene-environment independence, aiming to discover disease-associated loci that may have heterogeneous effects with respect to environmental variables. These 2 hypotheses are scientifically related but statistically independent, as we showed previously (15), leading to a convenient way of combining both tests. The benefit of such simultaneous testing is that genes that interact with environmental attributes of disease risk may also manifest marginal association (MA), unless genetic associations within exposed and unexposed subgroups cancel out exactly in the population-average association. A simultaneous test, therefore, may improve power over testing these 2 hypotheses separately, particularly when the marginal effect is moderate and the gene also has moderate differential effects across various levels of environmental variables. Compared with the Kraft 2-df test (16), our simultaneous test offers simplicity and flexibility with which to incorporate gene-environment independence, whether using the EB estimator in an observational setting or using the CO estimator for gene-treatment interaction in a randomized controlled trial setting.
MATERIALS AND METHODS
We propose a simultaneous test of whether there is a marginal genetic association and whether there is heterogeneity of genetic effects across the environmental variable. The 2 null hypotheses are
where β1 and γ3 are defined as in model 1 and model 2, respectively. The tests for β1 and γ3 are often the main objectives of genetic association studies, when there is a known environmental attribute of the disease risk. Unlike the 2 parameters (γ2, γ3) in the Kraft 2-df test, which can be expressed together in a likelihood, the 2 parameters (β1, γ3) in our test are from two different but related models capturing two aspects of genetic association: the average genetic effect and its potential variation across the environmental variable.
If E is independent of G and the true disease-generating model is model 2, the null hypothesis of the Kraft 2-df test, γ2 = γ3 = 0, will lead to our null hypothesis β1 = γ3 = 0, not surprisingly. Under the alternative hypothesis for model 2, however, β1 is typically a nonlinear function of the parameters in model 2 involving γ2 and γ3, as well as the distribution of E. Nonetheless, the marginal genetic effect β1 is of primary interest in genetic studies, regardless of the functional form of E or whether there is potential measurement error in E, whereas the genetic main effect γ2 is the subgroup genetic effect when E = 0, which depends on correct modeling of E and may be less interpretable when E is continuous. The motivation for our simultaneous test, similarly to the Kraft 2-df test, is to improve the probability of detecting disease-associated loci while accounting for gene-environment interaction.
A benefit of combining H01 and H02 is that the maximum likelihood estimator of β1 is asymptotically independent of various estimators of γ3, including the standard case-control (CC) interaction estimator, the CO estimator (15), and the EB estimator, so that combining 2 tests is easy and implementation is flexible. Henceforth, we refer to γcc as the standard gene-environment interaction when fitting model 2 to CC genetic studies, γco as the CO interaction, and γeb as the EB interaction. The expression of the latter two parameters can be found in the Web Appendix. The first independence result  follows a quite general theorem which states that, for any two nested generalized linear models with a canonical link function, the estimators for the parameters in the smaller model are asymptotically independent of the estimators of the parameters in the larger model (15). This result is new to the statistical literature. It holds when either of the models 1 and 2 is true, or even when both models are misspecified. The second independence result
  is similarly derived by examining the covariance of respective estimating functions for the two estimators. Because the EB estimator is a linear combination of the CO estimator and the standard CC estimator, the marginal effect estimator is also independent of the EB estimator.
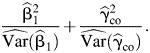
One way to formulate the test statistics for these 3 versions of simultaneous tests is a typical Wald statistic for multiple parameter estimates. Because of the independence, these test statistics can be simplified as the sums of 2 squared z scores. Specifically, in randomized clinical trials where the CO estimator can be used with confidence, the test statistic is
 |
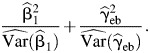
In observational studies, we use the EB estimator, since it is more robust against violation of the gene-environment independence assumption than  and it is more efficient than
  The test statistic is
 |
If we want to be conservative concerning gene-environment independence in observational studies, we can simply use the standard CC estimator in the test statistic, that is,
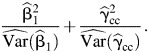 |
All 3 test statistics are distributed as χ2 with 2 df under the two null hypotheses. Equivalently, an alternative method of combining these independent tests is to use Fisher's χ2 statistic for log-transformed P values (19). The latter approach provides flexibility when genetic scores (0, 1, 2) in these analyses are coded by 2 indicators or the testing was carried out by means of likelihood ratio tests.
Similarly to the Kraft 2-df test, we expect that our simultaneous test will maintain good power under diverse disease penetrance models (e.g., marginal effect only or gene-environment interaction only). For SNPs with some marginal effect and some interaction, our test should improve power over testing either the marginal effect or the interaction separately. The latter scenario may be quite common for SNPs with gene-environment interaction. Using a simultaneous test may help researchers better identify such SNPs. Because of exploitation of gene-environment independence, the simultaneous test with the CO estimator is likely to be more powerful than the standard Kraft 2-df test in randomized clinical trials. It is also of interest to compare the simultaneous test with the 2-stage procedures, particularly the one using marginal-effect screening (13). As we discuss in the Web Appendix, the latter procedure may miss those SNPs which have weak marginal effects. The simultaneous test leverages information from both components of genetic association, and all SNPs are interrogated. From the gene-discovery point of view, it circumvents the limitation of 2-stage procedures because of “leaky” filtering, though we acknowledge that the 2-stage procedures are typically designed for gene-environment interaction testing exclusively.
On the other hand, procedures for exploiting gene-environment independence in the Kraft 2-df test are less straightforward. One can extend the Kraft 2-df test to the constrained semiparametric maximum likelihood estimators of both the genetic main effect and the interaction (9), using a Wald test statistic. This can be computationally cumbersome in the context of genome-wide association studies. For clinical trials with multiple treatment arms, see (for example) the Women's Health Initiative breast cancer study in the Results section, where MA can be assessed in all participants while gene-treatment interaction can only be estimated in the respective treatment arms. It is not clear how to use the constrained semiparametric maximum likelihood estimators for a joint test. With our simultaneous test, since no estimation efficiency for the marginal genetic effect can be gained from gene-environment independence, we simply plug in the easily computed CO estimator in the combined test. With additional work, one can also develop an EB version for jointly testing γ2 = γ3 = 0 using the method described by Mukherjee et al. (10) and Chen et al. (20), which provides some robustness toward exploiting gene-environment independence. Our method allows straightforward incorporation of the EB interaction estimator in the joint test.
RESULTS
Simulation
We compare the error rate and the power of our simultaneous test with that of other existing procedures. Since comparing the power of tests with different null hypotheses is not fair, we instead examine the probability of discovering genetic variants that carry disease risk, which would then be further analyzed in a replication study. The first set of simulations is designed to compare 3 versions of simultaneous tests: MA with the CO, EB, or CC interaction compared with the Kraft 2-df test in which there is only 1 genetic variant. For completeness, the separate MA, CO, and EB tests are also included separately in the comparison. We only simulate 1 SNP, since these tests are all single-SNP-based and the comparative performance can be extrapolated to, say, a million SNPs. We simulate a CC sample with 500 cases and 500 controls, from a cohort of 25,000 subjects and disease prevalence of 2%. The binary genetic factor and the binary environmental factor have frequencies of 0.2 and 0.5, respectively. The disease penetrance model is specified by the logistic function (model 2), with γ = −4 and varying values of γ1, γ2, and γ3. Tables 1 and 2 show the empirical type I error and the power for various tests in 1,000 simulations, when gene-environment independence holds (OR(G, E) = 1) or does not hold (OR(G, E) = 1.25), respectively (OR, odds ratio).
Table 1.
Type I Error and Statistical Power of Various Tests of Genetic Association or Gene-Environment Interaction in Simulations Where OR(G, E) = 1
| γ1a | γ2a | γ3a | MA | CC | CO | EB | Kraft 2-df Test | Kraft 2-df-indb | Simultaneous Test |
||
|---|---|---|---|---|---|---|---|---|---|---|---|
| MA + CO | MA + EB | MA + CC | |||||||||
| 0 | 0 | −Log2 | 0.367 | 0.467 | 0.704 | 0.613 | 0.608 | 0.735 | 0.762 | 0.684 | 0.595 |
| −Log1.5 | 0.197 | 0.195 | 0.311 | 0.265 | 0.267 | 0.332 | 0.348 | 0.317 | 0.261 | ||
| 0 | 0.052 | 0.045 | 0.040 | 0.036 | 0.047 | 0.047 | 0.048 | 0.038 | 0.045 | ||
| Log1.5 | 0.271 | 0.257 | 0.436 | 0.338 | 0.362 | 0.524 | 0.509 | 0.441 | 0.374 | ||
| Log2 | 0.750 | 0.629 | 0.905 | 0.794 | 0.882 | 0.973 | 0.969 | 0.941 | 0.895 | ||
| Log1.5 | −Log2 | 0.102 | 0.543 | 0.837 | 0.724 | 0.49 | 0.779 | 0.770 | 0.658 | 0.495 | |
| −Log1.5 | 0.271 | 0.245 | 0.425 | 0.329 | 0.353 | 0.522 | 0.515 | 0.437 | 0.359 | ||
| 0 | 0.752 | 0.051 | 0.043 | 0.032 | 0.648 | 0.652 | 0.646 | 0.643 | 0.651 | ||
| Log1.5 | 0.994 | 0.264 | 0.517 | 0.401 | 0.992 | 0.992 | 0.991 | 0.989 | 0.992 | ||
| Log2 | 1 | 0.645 | 0.940 | 0.832 | 1 | 1 | 1 | 1 | 1 | ||
| Log2 | −Log2 | 0.767 | 0.582 | 0.898 | 0.777 | 0.870 | 0.968 | 0.964 | 0.936 | 0.882 | |
| −Log1.5 | 0.926 | 0.243 | 0.495 | 0.384 | 0.908 | 0.940 | 0.939 | 0.926 | 0.913 | ||
| 0 | 0.995 | 0.062 | 0.045 | 0.041 | 0.991 | 0.991 | 0.991 | 0.991 | 0.991 | ||
| Log1.5 | 1 | 0.279 | 0.551 | 0.409 | 1 | 1 | 1 | 1 | 1 | ||
| Log2 | 1 | 0.670 | 0.944 | 0.851 | 1 | 1 | 1 | 1 | 1 | ||
| Log2 | 0 | −Log2 | 0.680 | 0.501 | 0.732 | 0.654 | 0.765 | 0.899 | 0.916 | 0.883 | 0.814 |
| −Log1.5 | 0.346 | 0.213 | 0.347 | 0.271 | 0.355 | 0.462 | 0.478 | 0.442 | 0.396 | ||
| 0 | 0.047 | 0.049 | 0.052 | 0.040 | 0.049 | 0.047 | 0.048 | 0.042 | 0.045 | ||
| Log1.5 | 0.458 | 0.227 | 0.377 | 0.305 | 0.420 | 0.615 | 0.603 | 0.552 | 0.486 | ||
| Log2 | 0.926 | 0.569 | 0.841 | 0.751 | 0.901 | 0.986 | 0.985 | 0.978 | 0.956 | ||
| Log1.5 | −Log2 | 0.035 | 0.602 | 0.857 | 0.756 | 0.509 | 0.767 | 0.769 | 0.663 | 0.512 | |
| −Log1.5 | 0.174 | 0.241 | 0.452 | 0.351 | 0.316 | 0.471 | 0.46 | 0.375 | 0.282 | ||
| 0 | 0.757 | 0.044 | 0.043 | 0.034 | 0.645 | 0.653 | 0.647 | 0.642 | 0.650 | ||
| Log1.5 | 0.997 | 0.250 | 0.414 | 0.331 | 0.991 | 0.997 | 0.997 | 0.997 | 0.997 | ||
| Log2 | 1 | 0.613 | 0.866 | 0.770 | 1 | 1 | 1 | 1 | 1 | ||
| Log2 | −Log2 | 0.488 | 0.605 | 0.895 | 0.774 | 0.824 | 0.932 | 0.930 | 0.865 | 0.77 | |
| −Log1.5 | 0.841 | 0.266 | 0.515 | 0.387 | 0.875 | 0.888 | 0.884 | 0.857 | 0.843 | ||
| 0 | 0.996 | 0.032 | 0.051 | 0.035 | 0.992 | 0.993 | 0.993 | 0.994 | 0.993 | ||
| Log1.5 | 1 | 0.272 | 0.429 | 0.35 | 1 | 1 | 1 | 1 | 1 | ||
| Log2 | 1 | 0.620 | 0.852 | 0.776 | 1 | 1 | 1 | 1 | 1 | ||
Abbreviations: CC, standard case-control interaction estimator; CO, case-only interaction estimator; EB, empirical Bayes estimator; MA, marginal association; OR, odds ratio.
a Parameters in logistic regression model 2 without additional confounder W.
b Kraft 2-df test exploiting gene-environment independence.
Table 2.
Type I Error and Statistical Power of Various Tests of Genetic Association or Gene-Environment Interaction in Simulations Where OR(G, E) = 1.25
| γ1a | γ2a | γ3a | MA | CC | CO | EB | Kraft 2-df Test | Kraft 2-df-indb | Simultaneous Test |
||
|---|---|---|---|---|---|---|---|---|---|---|---|
| MA + CO | MA + EB | MA + CC | |||||||||
| 0 | 0 | −Log2 | 0.315 | 0.457 | 0.920 | 0.669 | 0.585 | 0.908 | 0.915 | 0.731 | 0.560 |
| −Log1.5 | 0.152 | 0.216 | 0.671 | 0.402 | 0.247 | 0.631 | 0.644 | 0.407 | 0.232 | ||
| 0 | 0.049 | 0.044 | 0.163 | 0.070 | 0.052 | 0.125 | 0.129 | 0.067 | 0.051 | ||
| Log1.5 | 0.239 | 0.250 | 0.109 | 0.141 | 0.349 | 0.242 | 0.236 | 0.276 | 0.342 | ||
| Log2 | 0.684 | 0.611 | 0.570 | 0.576 | 0.854 | 0.843 | 0.833 | 0.851 | 0.859 | ||
| Log1.5 | −Log2 | 0.139 | 0.577 | 0.969 | 0.756 | 0.522 | 0.949 | 0.949 | 0.723 | 0.541 | |
| −Log1.5 | 0.302 | 0.242 | 0.828 | 0.463 | 0.395 | 0.825 | 0.823 | 0.551 | 0.413 | ||
| 0 | 0.749 | 0.051 | 0.215 | 0.092 | 0.663 | 0.751 | 0.743 | 0.682 | 0.663 | ||
| Log1.5 | 0.989 | 0.263 | 0.129 | 0.151 | 0.987 | 0.982 | 0.982 | 0.982 | 0.986 | ||
| Log2 | 1 | 0.640 | 0.628 | 0.620 | 1 | 1 | 1 | 1 | 1 | ||
| Log2 | −Log2 | 0.828 | 0.625 | 0.987 | 0.773 | 0.898 | 0.997 | 0.995 | 0.950 | 0.917 | |
| −Log1.5 | 0.942 | 0.265 | 0.884 | 0.497 | 0.919 | 0.990 | 0.988 | 0.953 | 0.926 | ||
| 0 | 0.999 | 0.064 | 0.226 | 0.089 | 0.998 | 0.996 | 0.996 | 0.998 | 0.998 | ||
| Log1.5 | 1 | 0.277 | 0.122 | 0.158 | 1 | 1 | 1 | 1 | 1 | ||
| Log2 | 1 | 0.644 | 0.621 | 0.611 | 1 | 1 | 1 | 1 | 1 | ||
| Log2 | 0 | −Log2 | 0.688 | 0.559 | 0.944 | 0.742 | 0.735 | 0.981 | 0.986 | 0.900 | 0.835 |
| −Log1.5 | 0.366 | 0.239 | 0.718 | 0.407 | 0.341 | 0.767 | 0.780 | 0.569 | 0.437 | ||
| 0 | 0.063 | 0.059 | 0.164 | 0.076 | 0.060 | 0.129 | 0.137 | 0.087 | 0.072 | ||
| Log1.5 | 0.299 | 0.233 | 0.083 | 0.127 | 0.373 | 0.271 | 0.264 | 0.300 | 0.368 | ||
| Log2 | 0.814 | 0.542 | 0.438 | 0.467 | 0.87 | 0.891 | 0.881 | 0.897 | 0.897 | ||
| Log1.5 | −Log2 | 0.051 | 0.582 | 0.982 | 0.750 | 0.503 | 0.951 | 0.952 | 0.68 | 0.489 | |
| −Log1.5 | 0.118 | 0.280 | 0.813 | 0.475 | 0.352 | 0.763 | 0.760 | 0.447 | 0.282 | ||
| 0 | 0.647 | 0.041 | 0.217 | 0.071 | 0.632 | 0.646 | 0.645 | 0.559 | 0.535 | ||
| Log1.5 | 0.992 | 0.233 | 0.085 | 0.140 | 0.989 | 0.981 | 0.981 | 0.985 | 0.987 | ||
| Log2 | 1 | 0.600 | 0.486 | 0.532 | 1 | 1 | 1 | 1 | 1 | ||
| Log2 | −Log2 | 0.437 | 0.630 | 0.985 | 0.790 | 0.826 | 0.986 | 0.986 | 0.847 | 0.738 | |
| −Log1.5 | 0.804 | 0.280 | 0.862 | 0.499 | 0.874 | 0.960 | 0.959 | 0.856 | 0.792 | ||
| 0 | 0.993 | 0.047 | 0.249 | 0.084 | 0.987 | 0.988 | 0.987 | 0.980 | 0.981 | ||
| Log1.5 | 1 | 0.243 | 0.096 | 0.149 | 1 | 1 | 1 | 1 | 1 | ||
| Log2 | 1 | 0.615 | 0.489 | 0.539 | 1 | 1 | 1 | 1 | 1 | ||
Abbreviations: CC, standard case-control interaction estimator; CO, case-only interaction estimator; EB, empirical Bayes estimator; MA, marginal association; OR, odds ratio.
a Parameters in logistic regression model 2 without additional confounder W.
b Kraft 2-df test exploiting gene-environment independence.
In Table 1, where gene-environment independence holds, the type I errors for all tests evidently maintain the nominal level. Under all parameter combinations, the power of our simultaneous test of MA and the CO interaction (MA + CO) is either the best procedure considered or close to the best of all procedures considered. The simultaneous test, particularly with CO or EB, is more powerful than the standard Kraft 2-df test. In some settings, the power is increased by 20%–30%. The power gain appears to mainly derive from the use of the CO estimator in the joint test, since there is little difference when we compare the MA + CC test with the Kraft 2-df test. When compared with testing for interaction alone, using either the CO test or the EB test, the simultaneous test MA + CO or MA + EB almost always yields better power, except in situations where there is a strong qualitative interaction such that the marginal effect is small. Notably, both versions of the joint test outperform the test for interaction alone even when there is no genetic main effect—an observation previously reported (16). Similarly, the simultaneous test MA + CO or MA + EB is almost always superior to the test for MA alone, except in situations where there is no interaction. The EB test is outperformed by the CO test, as gene and environment are independent in this set of simulations. Similarly, among 3 simultaneous tests, the performance of MA + EB is intermediate to that of MA + CO and MA + CC, as expected.
We also implemented the Kraft 2-df test exploiting gene-environment independence using the constrained maximum likelihood method (9). Interestingly, this test yields a virtually interchangeable power performance compared with our simultaneous test MA + CO, even though these two joint tests have different null hypotheses. The advantage of our test is that computation is easier because it does not involve a covariance matrix.
In Table 2, we simulate moderate gene-environment dependence, OR(G, E) = 1.25, as it could arise in an observational study. In reality, this odds ratio is fairly large, as we rarely observe gene-environment correlation of this size. The CO estimator, the simultaneous test MA + CO, and the Kraft 2-df test exploiting independence fail badly to preserve the type I error, where the EB estimator yields a slightly inflated type I error. Similar to the results in Table 1, the simultaneous test MA + EB seems to maintain good power in all simulation settings. The advantage of MA + EB over the standard Kraft 2-df test is less pronounced when compared with the results in Table 1, since the CC interaction estimator would dominate in the EB estimator.
We further evaluate the performance of the simultaneous test in the setting with high-dimensional genotypes. The purpose of this set of simulations is 3-fold. First, we intend to investigate the validity of the simultaneous test, particularly MA + EB, in situations where a small proportion of genotypes may be correlated with environment. Second, we want to explore the comparison between the simultaneous test and the 2-stage procedures, particularly the 2-stage procedure using marginal-effect screening, since they are two ways of using information in MA. We recognize that it is not entirely fair to compare the 2-stage procedures with the simultaneous test in power performance in general, since the former is for testing exclusively for interaction while the latter is for both marginal effect and interaction. We thus restrict attention to the scenario in which there is no genetic main effect (γ2 = 0) and no environmental main effect (γ1 = 0)—that is, the genetic effect exists only in the exposed subjects, so that MA (β1) is fully derived from the subgroup effect γ3.
We simulate a CC sample from a study population with 40,000 subjects and 5% disease prevalence. A dichotomous environmental factor is generated with frequency 0.5. We generate 100,000 independent binary genetic factors, one of which has elevated disease risk in the logistic model. The frequency of the risk allele is 0.2, with OR(G, E) = 0.8, OR(G, E) = 1, and OR(G, E) = 1.2. The other (null) genetic factors have frequencies generated from a uniform distribution in (0.1, 0.3). The log gene-environment odds ratios for the null genetic factors are from a mixture of 0 and a normal distribution: pindδ0 + (1 − pind)N(0, SD = log1.5/2), where δ0 is a point mass at 0 (SD, standard deviation). We vary pind from 0.95 to 1, with 1 pertinent to a randomized clinical trial and 0.95 suggesting an observational genome-wide association study in which the majority of SNPs in the study are probably independent of the environmental exposure. We assume that the main environmental effect (γ1) is 0 and the main genetic effect (γ2) is 0. The size of the interaction (γ3) ranges from 0 to log 2. We sample all cases and an identical number of controls from the study population. The average number of cases is 2,000.
We apply the simultaneous test to all genetic factors, either MA plus the CO interaction or MA plus the EB interaction, depending on the simulated OR(G, E). We evaluate its family-wise error rate (FWER) among null markers and compare the power to three 2-stage procedures: the modified 2-stage procedure using the EB estimator after screening by MA (13), which is denoted by MA → EB, the Murcray procedure (12), and the hybrid procedure (14). The proportion of genetic factors that pass the filtering is set to 0.001, a commonly used threshold in the literature (12–14).
Table 3 shows the empirical FWER and the expected number of false-positive findings for various procedures under a range of the probability of gene-environment independence in 1,000 simulations. The simultaneous test of MA and the CO interaction (MA + CO) fails to preserve FWER whenever there is some gene-environment dependence. On the other hand, the simultaneous test of MA and the EB estimator (MA + EB) seems to preserve FWER when the proportion of gene-environment dependence is less than 0.01. This is consistent with the behavior of the EB estimator reported in genome-wide association studies (21). Interestingly, the 2-stage procedure using MA → EB maintains the control of FWER even when the proportion of gene-environment dependence is 0.05, possibly because the marginal-effect filter helps to remove false positives. All other procedures maintain the control of FWER as expected.
Table 3.
Family-Wise Error Rate for Various Methods of Detecting Gene-Environment Interaction Under a Range of Probabilities of Gene-Environment Independence
| paind | Simultaneous Test |
2-Stage Test |
||||||||||||
|---|---|---|---|---|---|---|---|---|---|---|---|---|---|---|
| MA + CO |
MA + EB |
MA + CC |
MA → EB |
Murcrayb |
Hybridc |
Kraft 2-df Test |
||||||||
| FWER | ENFP | FWER | ENFP | FWER | ENFP | FWER | ENFP | FWER | ENFP | FWER | ENFP | FWER | ENFP | |
| 0.9500 | 1.000 | 49.70 | 0.136 | 0.147 | 0.031 | 0.033 | 0.060 | 0.061 | 0.062 | 0.064 | 0.057 | 0.059 | 0.028 | 0.030 |
| 0.9900 | 1.000 | 9.917 | 0.044 | 0.047 | 0.034 | 0.034 | 0.032 | 0.032 | 0.046 | 0.048 | 0.040 | 0.043 | 0.027 | 0.027 |
| 0.9950 | 0.992 | 5.073 | 0.031 | 0.031 | 0.039 | 0.040 | 0.024 | 0.025 | 0.043 | 0.044 | 0.041 | 0.042 | 0.038 | 0.039 |
| 0.9975 | 0.914 | 2.429 | 0.028 | 0.028 | 0.046 | 0.047 | 0.029 | 0.029 | 0.053 | 0.055 | 0.045 | 0.048 | 0.042 | 0.043 |
| 0.9995 | 0.397 | 0.520 | 0.026 | 0.027 | 0.037 | 0.037 | 0.028 | 0.028 | 0.045 | 0.048 | 0.034 | 0.037 | 0.036 | 0.036 |
| 1.0000 | 0.036 | 0.037 | 0.024 | 0.024 | 0.036 | 0.037 | 0.024 | 0.024 | 0.044 | 0.045 | 0.048 | 0.049 | 0.032 | 0.032 |
Abbreviations: CC, standard case-control interaction estimator; CO, case-only interaction estimator; EB, empirical Bayes estimator; ENFP, expected number of false-positives; FWER, family-wise error rate; MA, marginal association; OR, odds ratio; SNP, single nucleotide polymorphism.
a pind, proportion of SNPs with SNP-environment independence.
b Murcray, the 2-stage procedure using gene-environment correlation in the combined sample as a filter (12).
c Hybrid, the 2-stage procedure splitting filtering by MA and gene-environment correlation (14).
Figure 1 shows power performance for the procedures under a variety of parameter settings. Panels A–C show power for a model without genetic main effect γ2 = 0 and with OR(G, E) = 0.8, 1, and 1.2, respectively. We add the joint test of MA and the CO estimator only when OR(G, E) = 1 in Figure 1B, because this is the scenario in which the randomized clinical trials and the CO estimator can be confidently used. In this setting, the simultaneous test using MA + CO performs consistently on top of all other procedures, followed by the modified Kooperberg procedure with MA → CO. This shows the superior power of incorporating the CO estimator in the simultaneous test when gene-environment independence does hold. Figure 1A shows the scenario in which the negative gene-environment correlation cancels out with the positive gene-environment correlation in cases induced by gene-environment interaction. In this case, the Murcray procedure using gene-environment correlation in the combined CC sample has no power. The simultaneous test using MA + CC performs the best, closely followed by the Kraft 2-df test. The simultaneous test using MA + EB is outperformed by MA + CC because, for negatively dependent gene and environment, the CO test is not as powerful as the standard CC test. In Figure 1C, the gene-environment correlation induced in cases by gene-environment interaction adds to the gene-environment correlation so that MA + EB has superior power over all other procedures.
Figure 1.
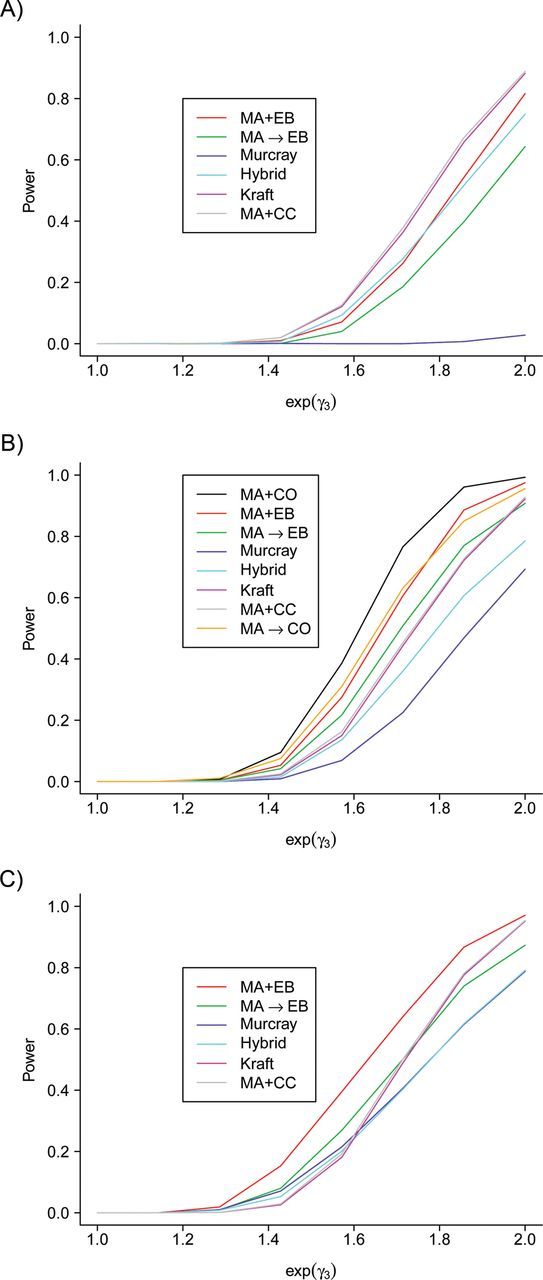
Comparison of statistical power for detecting single nucleotide polymorphism (SNP)-environment interaction by means of the simultaneous test, the Kraft 2-df test, and the 2-stage procedures. One thousand simulated data sets were generated with 10,000 SNPs and 2,000 cases and 2,000 controls. Panels A, B, and C show power for a model with genetic main effect γ2 = 0 and environmental main effect γ1 = 0 and with OR(G, E) = 0.8, OR(G, E) = 1, and OR(G, E) = 1.2, respectively (OR, odds ratio). MA + EB, the simultaneous test for marginal association (MA) and the empirical Bayes (EB) interaction; MA → EB, the 2-stage test with MA screening followed by the EB interaction testing; Murcray, the 2-stage test with gene-environment correlation screening (12); Hybrid, the 2-stage test using both MA and gene-environment correlation in screening (14); Kraft, the Kraft 2-df test; MA + CC, the simultaneous test for MA and the standard case-control (CC) interaction; MA + CO, the simultaneous test for MA and the case-only (CO) interaction; MA → CO, the 2-stage test with MA screening followed by CO interaction testing.
In all 3 panels of Figure 1, the simultaneous test always yields more power than the corresponding 2-stage test, suggesting that in this setting combining information in a joint test is perhaps better than splitting information into screening and testing, though again the 2-stage procedures are focused solely on testing for gene-environment interaction. We also observe that across Figure 1 and Tables 1 and 2, the performance of the simultaneous test using MA + CC is very close to that of the Kraft 2-df test, presumably because they can be considered two ways of using the same genetic information.
Data application
To discover the genetic variants that may influence breast cancer risk, perhaps jointly with the clinical trial interventions (19, 21–25), Women's Health Initiative investigators studied 4,988 SNPs among 2,242 invasive breast cancer cases and 1:1 matched controls, sampled across all 4 clinical trials (1993–2005). SNPs were selected on the basis of prior suggestive evidence of association with breast cancer. The design and detailed analysis of this genetic study have been published previously (26–28). We showcase the analytical approach taken to discover loci interacting with the randomized treatments, the simultaneous test of MA and the CO gene-treatment interaction we proposed, that lead to suggestive evidence of gene-treatment interaction in 2 genomic regions.
Since the data are from 4 randomized clinical trials conducted in the Women's Health Initiative, a 5-component test statistic is constructed to test MA and the CO interaction with each of 4 interventions. Since the 4 interventions are randomized according to a partial factorial design, the marginal genetic effect is asymptotically independent of the 4 CO interactions, and the CO tests for conjugated equine estrogens alone and conjugated equine estrogens in combination with medroxyprogesterone acetate are independent, since they are based on nonoverlapping sets of women. A “sandwich” variance estimator was used to account for correlations among other CO tests that were conducted in overlapping sets of women. Under the joint null hypothesis, this statistic is distributed as a χ2 distribution with 5 df. The false discovery rate was computed based on the ranking of nominal P values (29), assuming the joint null of no marginal effect and no interaction. Details of the statistical analysis have been published elsewhere (28).
Table 4 shows the significance from testing of MA, SNP-treatment CO interactions, and the simultaneous test for the top 15 SNPs ranked by the simultaneous test. The top 1–6 SNPs are all located in the region of the fibroblast growth factor receptor 2 gene (FGFR2), which has been previously reported to have a significant marginal effect on breast cancer and suggestive evidence of SNP-treatment interaction (26, 27). Clearly, marginal genetic association in FGFR2 dominates in the significance of the simultaneous test. Eight out of 9 SNPs ranked 7–15 in significance of the simultaneous test are from a linkage disequilibrium region in the mitochondrial ribosomal protein S30 gene (MRPS30) on chromosome 5p12. They all have increased significance of the simultaneous test compared with either the significance of MA or the significance of interactions. None of the SNP-treatment interactions are significant after correction for multiple testing; however, adding SNP-treatment interaction in a joint test seems to elevate the evidence of genetic association with breast cancer. In particular, the joint test for rs7705343 yields a false discovery rate of 0.0419, with suggestive evidence of interaction with 3 of the randomized treatments. Although none of the MRPS30 SNPs reach FWER significance, the result that these SNPs show suggestive evidence of marginal effect and interaction with one or multiple treatments makes this region a potentially interesting candidate for a replication study.
Table 4.
Significance Levels for Tests of a Marginal Effect, Interaction, or Both on the Odds of Breast Cancer for the Top 15 Single Nucleotide Polymorphisms Ranked by the Simultaneous Test, Women's Health Initiative Clinical Trials, 1993–2005
| Reference SNP | Gene | P for MA |
P for SNP-Treatment Interaction |
Simultaneous Test |
|||||
|---|---|---|---|---|---|---|---|---|---|
| E-Alone | E + P | DMQa | CaD | P Value | FDR | Rank | |||
| 1219648 | FGFR2 | 3.90 × 10⁻¹⁰ | 0.413 | 0.661 | 0.040 | 0.547 | 6.45 × 10⁻⁹ | 3.21 × 10⁻⁵ | 1 |
| 2981579 | FGFR2 | 2.78 × 10⁻⁹ | 0.284 | 0.084 | 0.058 | 0.313 | 7.76 × 10⁻⁹ | 1.94 × 10⁻⁵ | 2 |
| 3750817 | FGFR2 | 9.02 × 10⁻⁸ | 0.046 | 0.033 | 0.005 | 0.544 | 5.61 × 10⁻⁸ | 9.32 × 10⁻⁵ | 3 |
| 11200014 | FGFR2 | 3.40 × 10⁻⁹ | 0.425 | 0.380 | 0.122 | 0.682 | 1.08 × 10⁻⁷ | 0.00014 | 4 |
| 2420946 | FGFR2 | 1.49 × 10⁻⁸ | 0.160 | 0.662 | 0.049 | 0.235 | 1.56 × 10⁻⁷ | 0.00016 | 5 |
| 2981582 | FGFR2 | 9.99 × 10⁻⁸ | 0.045 | 0.369 | 0.049 | 0.422 | 5.25 × 10⁻⁷ | 0.00044 | 6 |
| 7705343 | MRPS30 | 0.00036 | 0.043 | 0.863 | 0.042 | 0.046 | 5.88 × 10⁻⁵ | 0.0419 | 7 |
| 13159598 | MRPS30 | 0.00043 | 0.056 | 0.920 | 0.057 | 0.048 | 0.000136 | 0.0846 | 8 |
| 11746980 | MRPS30 | 0.00051 | 0.064 | 0.790 | 0.043 | 0.095 | 0.000240 | 0.133 | 9 |
| 9790879 | MRPS30 | 0.00096 | 0.117 | 0.762 | 0.042 | 0.047 | 0.000244 | 0.122 | 10 |
| 2330572 | MRPS30 | 0.00129 | 0.042 | 0.880 | 0.043 | 0.106 | 0.000294 | 0.133 | 11 |
| 7555040 | Unknown | 0.00248 | 0.825 | 0.769 | 0.359 | 0.0005 | 0.000336 | 0.140 | 12 |
| 4415084 | MRPS30 | 0.00044 | 0.242 | 0.944 | 0.127 | 0.146 | 0.000400 | 0.153 | 13 |
| 994793 | MRPS30 | 0.00184 | 0.084 | 0.798 | 0.041 | 0.080 | 0.000417 | 0.148 | 14 |
| 2218080 | MRPS30 | 0.00274 | 0.273 | 0.933 | 0.025 | 0.069 | 0.000446 | 0.148 | 15 |
Abbreviations: CaD, calcium and vitamin D supplementation; DMQ, dietary modification upper quartile; E-Alone, conjugated equine estrogens alone; E + P, conjugated equine estrogens in combination with medroxyprogesterone acetate; FDR, false discovery rate; FGFR2, fibroblast growth factor receptor 2; MA, marginal association; MRPS30, mitochondrial ribosomal protein S30; SNP, single nucleotide polymorphism.
a Subcohort with the upper quartile of baseline percentage of energy derived from fat in the dietary modification trial.
DISCUSSION
We propose a new way to combine the test of marginal genetic effect and the test of gene-environment interaction, utilizing the independence between the two tests. The average effect of 1 primary variable of interest on a phenotype and the potential heterogeneity of this effect over another modifying variable are statistically independent but scientifically related hypotheses, as we discuss in this paper. Our simultaneous test allows assessing both aspects of the association in a flexible and powerful way. It can be applied to more general settings beyond gene discovery—for example, the test of association of a phenotype with an environmental exposure potentially interacting with other environmental exposures.
The proposed testing strategy is particularly useful in genetic association studies within randomized clinical trials, where gene-treatment interaction is of interest, because the CO interaction can be used with confidence and ease. In observational genetic studies, the simultaneous test uses the EB estimator of gene-environment interaction; it maintains FWER if gene-environment independence holds for a majority of SNPs (>99%) and generally outperforms the standard Kraft 2-df test. The power gain of the simultaneous test relative to the Kraft 2-df test comes mostly from use of the CO estimator or the EB estimator. When compared with the Kraft test also exploiting the independence, the advantage of our simultaneous test is its simplicity—the sum of 2 squared z scores or log P values and the ease of incorporating the EB estimator in a joint test.
ACKNOWLEDGMENTS
Author affiliations: Public Health Science Division, Fred Hutchinson Cancer Research Center, Seattle, Washington (James Y. Dai, Benjamin A. Logsdon, Ying Huang, Li Hsu, Alexander P. Reiner, Ross L. Prentice, Charles Kooperberg); Vaccine and Infectious Disease Division, Fred Hutchinson Cancer Research Center, Seattle, Washington (James Y. Dai, Ying Huang); and Department of Epidemiology, School of Public Health, University of Washington, Seattle, Washington (Alexander P. Reiner).
This work was supported by the National Institutes of Health (grants U01 HG005152, P01 CA53996, R01 HG006164, and R01 AG14358), the National Heart, Lung, and Blood Institute (contract HHSN268200764314C), and the National Cancer Institute (grant P30CA015704). The Women's Health Initiative was funded by the National Heart, Lung, and Blood Institute through contracts N01WH22110, 24152, 32100-2, 32105-6, 32108-9, 32111-13, 32115, 32118-32119, 32122, 42107-26, 42129-32, and 44221.
Conflict of interest: none declared.
REFERENCES
- 1.Hindorff LA, MacArthur J, Wise A, et al. A Catalog of Published Genome-Wide Association Studies. Bethesda, MD: Office of Population Genomics, National Human Genome Research Institute, National Institutes of Health; 2011. (www.genome.gov/gwastudies. ). (Accessed July 30, 2011) [Google Scholar]
- 2.Kraft P, Hunter DJ. Genetic risk prediction—are we there yet? N Engl J Med. 2009;360(17):1701–1703. doi: 10.1056/NEJMp0810107. [DOI] [PubMed] [Google Scholar]
- 3.Manolio TA. Cohort studies and the genetics of complex disease. Nat Genet. 2009;41(1):5–6. doi: 10.1038/ng0109-5. [DOI] [PubMed] [Google Scholar]
- 4.Rothman N, Garcia-Closas M, Chatterjee N, et al. A multi-stage genome-wide association study of bladder cancer identifies multiple susceptibility loci. Nat Genet. 2010;42(11):978–984. doi: 10.1038/ng.687. [DOI] [PMC free article] [PubMed] [Google Scholar]
- 5.Hamza TH, Chen H, Hill-Burns EM, et al. Genome-wide gene-environment study identifies glutamate receptor gene GRIN2A as a Parkinson's disease modifier gene via interaction with coffee. PLoS Genet. 2011;7(8) doi: 10.1371/journal.pgen.1002237. e1002237. (doi:10.1371/journal.pgen.1002237) [DOI] [PMC free article] [PubMed] [Google Scholar]
- 6.Prentice RL, Pyke R. Logistic disease incidence models and case-control studies. Biometrika. 1979;66(3):403–411. [Google Scholar]
- 7.Piegorsch WW, Weinberg CR, Taylor JA. Non-hierarchical logistic models and case-only designs for assessing susceptibility in population-based case-control studies. Stat Med. 1994;13(2):153–162. doi: 10.1002/sim.4780130206. [DOI] [PubMed] [Google Scholar]
- 8.Umbach DM, Weinberg CR. Designing and analysing case-control studies to exploit independence of genotype and exposure. Stat Med. 1997;16(15):1731–1743. doi: 10.1002/(sici)1097-0258(19970815)16:15<1731::aid-sim595>3.0.co;2-s. [DOI] [PubMed] [Google Scholar]
- 9.Chatterjee N, Carroll RJ. Semiparametric maximum likelihood estimation exploiting gene-environment independence in case-control studies. Biometrika. 2005;92(2):399–418. [Google Scholar]
- 10.Mukherjee B, Chatterjee N. Exploiting gene-environment independence for analysis of case-control studies: an empirical Bayes-type shrinkage estimator to trade-off between bias and efficiency. Biometrics. 2008;64(3):685–694. doi: 10.1111/j.1541-0420.2007.00953.x. [DOI] [PubMed] [Google Scholar]
- 11.Li D, Conti DV. Detecting gene-environment interactions using a combined case-only and case-control approach. Am J Epidemiol. 2009;169(4):497–504. doi: 10.1093/aje/kwn339. [DOI] [PMC free article] [PubMed] [Google Scholar]
- 12.Murcray CE, Lewinger JP, Gauderman WJ. Gene-environment interaction in genome-wide association studies. Am J Epidemiol. 2009;169(2):219–226. doi: 10.1093/aje/kwn353. [DOI] [PMC free article] [PubMed] [Google Scholar]
- 13.Kooperberg C, LeBlanc M. Increasing the power of identifying gene × gene interactions in genome-wide association studies. Genet Epidemiol. 2008;32(3):255–263. doi: 10.1002/gepi.20300. [DOI] [PMC free article] [PubMed] [Google Scholar]
- 14.Murcray CE, Lewinger JP, Conti DV, et al. Sample size requirements to detect gene-environment interactions in genome-wide association studies. Genet Epidemiol. 2011;35(3):201–210. doi: 10.1002/gepi.20569. [DOI] [PMC free article] [PubMed] [Google Scholar]
- 15.Dai JY, Kooperberg C, LeBlanc M, et al. Two-stage testing procedures with independent filtering for genome-wide gene-environment interaction. Biometrika. doi: 10.1093/biomet/ass044. In press. [DOI] [PMC free article] [PubMed] [Google Scholar]
- 16.Kraft P, Yen YC, Stram DO, et al. Exploiting gene-environment interaction to detect genetic associations. Hum Hered. 2007;63(2):111–119. doi: 10.1159/000099183. [DOI] [PubMed] [Google Scholar]
- 17.The Women's Health Initiative Study Group. Design of the Women's Health Initiative clinical trial and observational study. Control Clin Trials. 1998;19(1):61–109. doi: 10.1016/s0197-2456(97)00078-0. [DOI] [PubMed] [Google Scholar]
- 18.Dai JY, LeBlanc M, Kooperberg C. Semiparametric estimation exploiting covariate independence in two-phase randomized trials. Biometrics. 2009;65(1):178–187. doi: 10.1111/j.1541-0420.2008.01046.x. [DOI] [PMC free article] [PubMed] [Google Scholar]
- 19.Fisher RA. Statistical Methods for Research Workers. Edinburgh, United Kingdom: Oliver and Boyd; 1932. [Google Scholar]
- 20.Chen YH, Chatterjee N, Carroll RJ. Shrinkage estimators for robust and efficient inference in haplotype-based case-control studies. J Am Stat Assoc. 2009;104(485):220–233. doi: 10.1198/jasa.2009.0104. [DOI] [PMC free article] [PubMed] [Google Scholar]
- 21.Mukherjee B, Ahn J, Gruber SB, et al. Testing gene-environment interaction in large-scale case-control association studies: possible choices and comparisons. Am J Epidemiol. 2012;175(3):177–190. doi: 10.1093/aje/kwr367. [DOI] [PMC free article] [PubMed] [Google Scholar]
- 22.Rossouw JE, Anderson GL, Prentice RL, et al. Risks and benefits of estrogen plus progestin in healthy postmenopausal women: principal results from the Women's Health Initiative randomized controlled trial. JAMA. 2002;288(3):321–333. doi: 10.1001/jama.288.3.321. [DOI] [PubMed] [Google Scholar]
- 23.Chlebowski RT, Hendrix SL, Langer RD, et al. Influence of estrogen plus progestin on breast cancer and mammography in healthy postmenopausal women: the Women's Health Initiative randomized trial. JAMA. 2003;289(24):3243–3253. doi: 10.1001/jama.289.24.3243. [DOI] [PubMed] [Google Scholar]
- 24.Anderson GL, Limacher M, Assaf AR, et al. Effects of conjugated equine estrogen in postmenopausal women with hysterectomy: the Women's Health Initiative randomized controlled trial. JAMA. 2004;291(14):1701–1712. doi: 10.1001/jama.291.14.1701. [DOI] [PubMed] [Google Scholar]
- 25.Stefanick ML, Anderson GL, Margolis KL, et al. Effects of conjugated equine estrogens on breast cancer and mammography screening in postmenopausal women with hysterectomy. JAMA. 2006;295(14):1647–1657. doi: 10.1001/jama.295.14.1647. [DOI] [PubMed] [Google Scholar]
- 26.Prentice RL, Huang Y, Hinds DA, et al. Variation in the FGFR2 gene and the effects of postmenopausal hormone therapy on invasive breast cancer. Cancer Epidemiol Biomarkers Prev. 2009;18(11):3079–3085. doi: 10.1158/1055-9965.EPI-09-0611. [DOI] [PMC free article] [PubMed] [Google Scholar]
- 27.Prentice RL, Huang Y, Hinds DA, et al. Variation in the FGFR2 gene and the effect of a low-fat dietary pattern on invasive breast cancer. Cancer Epidemiol Biomarkers Prev. 2010;19(1):74–79. doi: 10.1158/1055-9965.EPI-09-0663. [DOI] [PMC free article] [PubMed] [Google Scholar]
- 28.Huang Y, Ballinger DG, Dai JY, et al. Genetic variants in the MRPS30 region and postmenopausal breast cancer risk. Genome Med. 2011;3(6):42. doi: 10.1186/gm258. 10.1186/gm318. [DOI] [PMC free article] [PubMed] [Google Scholar]
- 29.Benjamini Y, Hochberg Y. Controlling the false discovery rate: a practical and powerful approach to multiple testing. J R Stat Soc Ser B. 1995;57(1):289–300. [Google Scholar]