Abstract
Models of self-organization have proved useful in revealing what processes may underlie characteristics of swarms. In this study, we review model-based explanations for aspects of the shape and internal structure of groups of fish and of birds travelling undisturbed (without predator threat). Our models attribute specific collective traits to locomotory properties. Fish slow down to avoid collisions and swim at a constant depth, whereas birds fly at low variability of speed and lose altitude during turning. In both the models of fish and birds, the ‘bearing angle’ to the nearest neighbour emerges as a side-effect of the ‘blind angle’ behind individuals and when group size becomes larger, temporary subgroups may increase the complexity of group shape and internal structure. We discuss evidence for model-based predictions and provide a list of new predictions to be tested empirically.
Keywords: self-organization, shape of a group, flock of birds and school of fish, internal structure, locomotion, collective motion
1. Introduction
Models of self-organized systems have more and more proved to be helpful in explaining the behaviour of groups of animals; we refer to insects [1,2], fish [3,4], birds [5], primates [6,7] and humans [8]. Most importantly, these models develop an integrative picture of the connection between traits at the level of the individual and of the group. For instance, in a model of collective movement, the increase in density in a swarm results in a phase transition from an unaligned swarm to an aligned school. A similar phenomenon is found in swarms of locusts [9,10].
In the present review, we show how these models have contributed to our understanding of the shape and the internal structure of travelling groups of fish and of birds. We confine ourselves to the situation in which predators are absent. The effect of predators on the shape of groups is enormous and deserves a separate review. We show the kinds of insights and predictions we may gain through models with a high potential for self-organization. Here, starting from local interactions, it is shown how patterns at a higher level develop by self-organization. We test some of the model-based predictions against empirical evidence and list others to be tested empirically in future. We limit ourselves to models of self-organization that are based on biologically inspired rules regarding movement behaviour. Explanations generated in this way are usually new, and have not been thought of without the help of these models. With this method, we show that group shape, internal structure or both are strongly influenced by a number of traits: (i) the specifics of locomotion (swimming or flying), (ii) the locality of interaction, (iii) the heterogeneity of the environment and (iv) the field of perception. Besides, we treat a model that represents not only schooling, but also its hydrodynamics and is used at present for studying energetic advantages of schooling.
We discuss models of moving schools and flocks that are individual-based and spatially explicit. In these models, individuals are moving, while they are attracted to others, align with them and avoid collisions [11–15]. There is a variety of models of fish schools that may differ in details. For the present survey, it is important whether individuals adjust their speed or not [11,15], and the number of neighbours to which they adjust their velocity [5,14–17]. Models dealing with birds [18,19] do not usually differ substantially from models of fish [13,20] apart from one exception, the model StarDisplay. In it, the behavioural rules of coordination (attraction, alignment and avoidance) are extended with a number of characteristics of birds [5,15]: modelled individuals fly instead of swim. They follow simplified (fixed-wing) aerodynamics, i.e. they experience lift, drag and gravity [21]. In order to fly along a curve, individuals avoid slipping by rolling into the direction of the turn. They thus reach a certain angle to the horizontal plane, the so-called banking angle, such as real birds do [22]. Flocks in our model StarDisplay are sometimes made to remain above a sleeping site such as starlings at dawn above their sleeping site in Rome [23,24]. Computer models of energy saving in schools of fish must include the hydrodynamics of swimming by fish [25].
We examine the shape of schools and flocks with measures similar to those used in empirical studies.
1.1. The basic models in two dimensions and in three dimensions
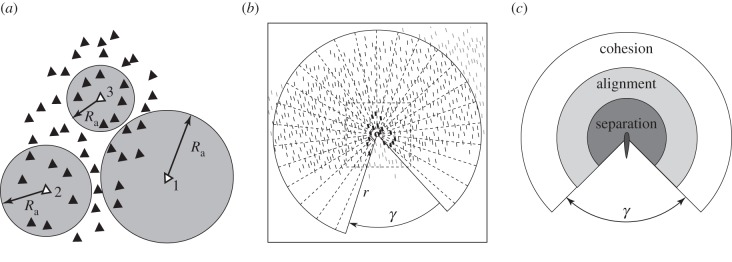
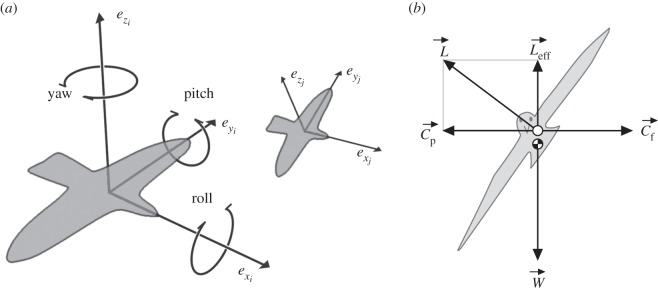
Individuals in these models of fish schools and bird flocks have a position in two-dimensional space or in three-dimensional space. They move at a certain speed. Speed is either adjustable, slowing down to avoid collisions and speeding up to move towards others [15], or stochastically variable around a certain average value [11,14]. The new velocity of an individual depends on its interaction partners, also referred to as influential neighbours (figure 1). Influential neighbours have been chosen in several ways, e.g. neighbours are chosen depending on their proximity to the actor [11], their proximity plus a fixed number, also called topological range [11,23], or their visibility to the actor [16]. The position and heading of these influential neighbours determine the new velocity of each individual. Apart from random noise, the new velocity depends on the weighted sum of being attracted to influential neighbours, aligning with them and avoiding them. Even in those fish models in which the location is given in three dimensions, the direction of movement is still mostly in the horizontal, because the individuals almost exclusively perform yaw (figure 2), because in fish models other movements (pitch and roll) are largely prevented [13,15,26]. In the bird model StarDisplay, however, individuals move in all directions. The individual's flying behaviour is represented by fixed-wing aerodynamics based on thrust, drag, lift and gravity. The individuals in the model are parametrized to empirical data of starlings, with regard to their body weight, speed, lift–drag coefficient [27], roll rate [5] and number of interaction partners [23].
Figure 1.
Influential neighbours. (a) Adjustable interaction range Ra for individuals 1, 2 and 3. The adjustable range is shorter if the crowding is denser (around individual 3); individuals in the figure always have seven interaction neighbours. (b) Schools with occluded perception [16]. Individuals in dark black are those neighbours with whom there is interaction. Individuals in dark are located in interaction range. Individuals in light grey are outside the field of view. γ indicates the blind angle. (c) Behavioural areas of avoidance (separation), alignment and attraction (cohesion) with a dead angle at the back, γ.
Figure 2.
Flying by birds. (a) Local coordinate system. The local coordinate systems of two birds, i and j, with different orientations in space and at different distances to the viewer. ex is the bird's forward direction; ey its sideways direction; and ez its upward direction. It can change these by rotating around these three principal axes (roll, pitch and yaw). (b) Loss of effective lift during turning. L, W denote lift, weight, respectively. Leff denotes effective lift; Cp denotes centripetal force; Cf denotes centrifugal force.
In these models, the ‘physical environment’ is usually homogeneous. In fish models, it may however include a tank that consists of a wall that is avoided [28]. Our model of schooling and hydrodynamics includes a representation of hydrodynamics that is generated by the collisions among (30 million) particles representing bits of water [25,29]. In the bird model, StarDisplay, the environment comprises an area where individuals prefer to fly [5]. It has a specific altitude and has a circular shape like the sleeping site of starlings above Rome in winter, where flocks of starlings daily show complex manoeuvres at dawn during half an hour [24].
2. Results
2.1. Fish schools: shape and density distribution
The main function of schooling and flocking is considered to be a reduction in the risk of predation [30]. Therefore, it has been suggested that the optimal shape of a school of fish should be spherical, because this combines the smallest surface for any volume and so the school would run the smallest risk of being discovered by a predator [31–36]. In reality, however, school shape is hardly ever spherical [37], but usually oblong [31,38–43]. Note that here shape is considered as being seen from above in two dimensions. The oblong shape is believed to protect against predation by ambush predators, because it reduces the size of the frontal area, where these predators are supposed to attack [44]. The stability of the shape of fish schools is remarkably greater than that of bird flocks. The shape of flocks of birds varies both in a single flock and between different flocks [45].
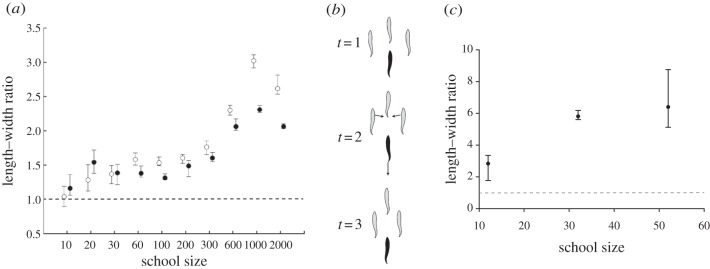
What causes the shape of schools of fish to be oblong has been investigated with the help of individual-based models of self-organized schooling. In these models, individuals have a tendency to move and to follow rules of attraction to others, alignment with them and avoidance of collisions [14,15,28,46]. In these models, the emergence of the oblong shape is robust (see the electronic supplementary material, movie S1): it is found for most school sizes, unless schools are very large [15,28,46], for schools of high and low cruise speed (figure 3a) [46], for schools that are free-swimming and travelling in a tank [28] and for schools with mixtures of different percentages of large and small individuals [46] even if these individuals of different body sizes are attracted to others of similar size [46].
Figure 3.
Shape and its causation in fish schools. (a) Shape (length/width) of the school in the movement direction in relation to cruise speed and number of members of the school (median and interquartile) [15]. Filled circles denote fast speed; open circles denote slow speed. (b) An example of emergence of oblong shape by avoidance of collisions through slowing down (for explanation, see text). (c) Empirical data of length/width (median and interquartile) of schools of 10–60 mullets in the wide passage of a ring-shaped tank [28]. Grey dashed line indicates shape with length/width = 1 (above this value shape is oblong).
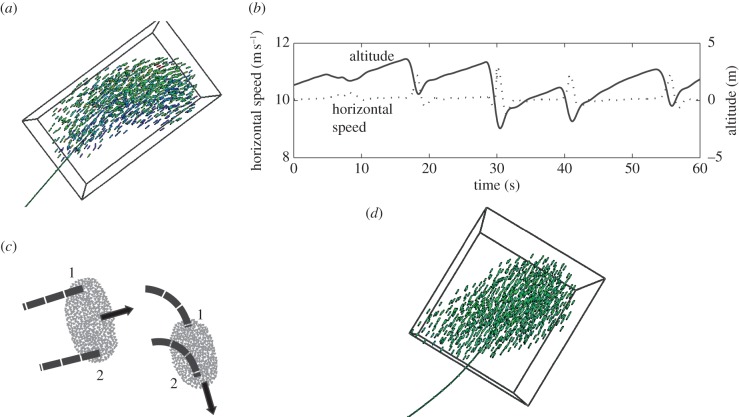
The oblong shape emerges in the model because, during travelling, individuals must sometimes slow down to avoid collisions. They slow down (rather than speed up) because they perceive more easily someone too close in front of them than behind them, represented by their so-called blind angle backwards (figure 1c). By slowing down to avoid collision, an individual (here in black, figure 3b) [28] leaves a gap between its former neighbours and subsequently these former neighbours move inwards closer together (time 2 in figure 3b). Thus, the school becomes oblong and lengthens until no further avoidance is needed. At this point, a temporary equilibrium is reached (time 3, figure 3b). Even when turning, the shape of a school remains oblong in the model (figure 4a). This is due to the fact that individuals adjust their velocity according to the proximity of others. When moving in the inside of an angle, they come so close together that they slow down automatically, whereas on the other hand when they move in the periphery they move further apart, so that they have to speed up. In this way, the shape of the school is preserved.
Figure 4.
Variability of speed and shape during turning. (a) Snapshot of model of fish school while slowing down in inner corner (blue) and speeding up in outer corner (green till fastest individuals indicated in red). (b) Loss of altitude while turning approximately each 10 s during a period of 60 s in model of birds, StarDisplay [5,47]. (c) Turning of flock by 90° at almost fixed speed in model StarDisplay [47]. Flock shape changes relative to the movement direction (from wide to oblong), individuals 1 and 2 follow paths of the same length and their location changes in the flock. (d) Snapshot of school during turning in fish model with extremely low variability of speed. The school is no longer oblong, but approximately as long as wide.
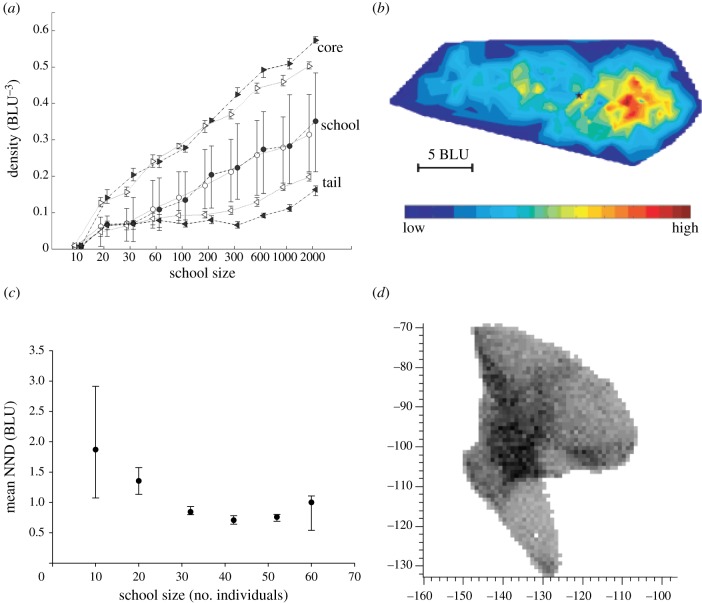
In the model, decelerating also affects the internal structure of the school in such a way that the density becomes highest at the front. This happens because slowing down builds up and lengthens the tail of the school, which is automatically less dense than the front (figure 5a,b).
Figure 5.
Density and size of schools of fish. (a) Density (number of individuals per volume) in schools of different sizes in model of fish schools (median and interquartile) [15]. Open symbols indicate slow schools, and filled symbols refer to fast schools. Core has highest density indicated in red, tail comprises 10% individuals at the very back. Lowest density in dark blue. (b) Density in different parts of the school in infinite space [15]. (c) Average nearest-neighbour distance (NND) (median and interquartile) in empirical data of schools of 10–60 mullets in the narrow passage of the ring-shaped tank [28]. (d) Shape and internal density of school of 10 000 individuals with occluded perception [16]. Grey scale indicates local density and ranges from 0 to 20 individuals m−2.
Support for our model-based theory of the causation of the oblong shape comes from three sources, namely simulation experiments, existing empirical data and empirical tests of our model-based predictions [28]. In the models, larger schools tend to be relatively more oblong and denser. This holds in models in two dimensions and three dimensions both when schools move in infinite space (figure 3a) and in a tank (figure 3c) [14,28,46]. Large schools are more oblong in these models owing to a shorter distance to the nearest neighbours, because this forces individuals to avoid collisions more often (figure 3a,b). The greater density of larger schools in turn is a consequence of the greater attraction among the larger number of individuals, especially of the peripheral individuals inwards, which can be seen as a ‘surface pressure’.
In our model, faster schools prove to be less oblong (figure 3a) [15].This is due to greater inertia of the individuals, which makes them wiggle less. Consequently, the path of the school is straighter (figure 6a–c) and school members are more aligned (figure 6d), as has been shown in other models also [15,48,49]. Therefore, individuals have to avoid others less often and fall back less frequently. By the same processes, via the higher frequency of avoidance [15], a larger tail builds up when schools are larger in our model and when the speed is slower (figure 5a), causing the highest density to be more frontal (figure 5b). If the speed is slow, the inertia is lower. This leads to weaker alignment and a more tortuous trajectory of the centre of gravity of the school (figure 6). Consequently, the densest kernel in the front of the school becomes less dense and the tail is denser than if speed is higher (figure 5a).
Figure 6.
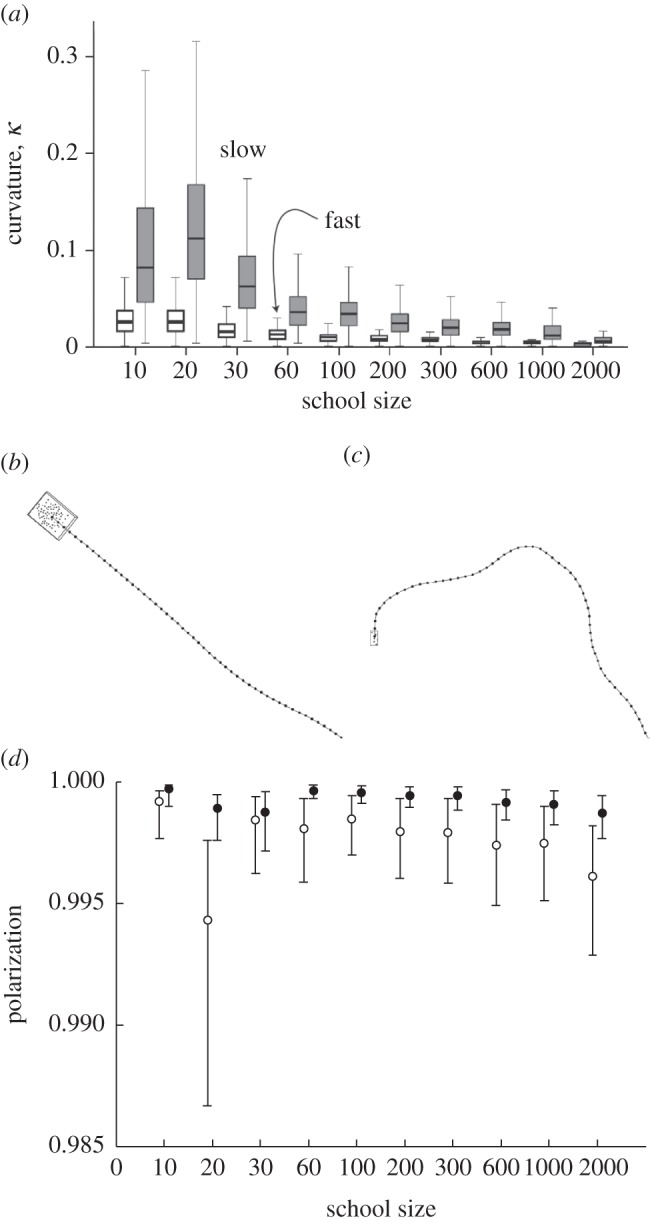
Effects of different cruise speed on curvature of trajectory and polarization of group. (a) Path curvature κ proportional to 1/radius of turning (median and interquartile). (b) Almost straight path of fast individual. (c) Curved path of slow individual. (d) Polarization (median and interquartile) of schools of different size and cruise speed [15]. Open circles, slow speed; closed circles, fast speed.
In line with our models, existing empirical data show the following patterns: density is highest at the front [44], larger schools of many species of fish are denser [28,41,50–54], larger schools of saithe (Pollachius virens) are more oblong [41] and slower schools of saithe and cod are more oblong than faster ones [41]. Besides, our experimental setup with schools of 10–60 mullets confirms that larger schools are both denser and more oblong (figures 3c and 5c) [28]. Further, the crucial observation in the model that fish in a school slow down to avoid collisions and speed up to keep up with others is confirmed in empirical data of golden shiners and mosquitofish [55,56].
In large schools of very many individuals, shape is not oblong and internal structure is complex. For instance, the shape of schools of tens of thousands of anchovies, herring, sprat or saithe comprises pseudopodia and inwards bends, and their internal structure shows kernels of high density and vacuoles of low density. This complexity is supposed to result from partially independent movements of micro-groups or sub-schools [57,58]. In line with this, in a model of schools of tens of thousands of fish, a complex shape with pseudopodia and a heterogeneous internal structure with vacuoles emerges (figure 5d). This happens when individuals interact more locally (i.e. with a lower percentage of the school members) than is usual in these models [16]. For instance, in the model by Kunz & Hemelrijk [16], locality of interactions arises from the limited perception range of individuals (figure 1c): they perceive only those who are not hidden behind neighbours closer by [16]. Note that this is a more natural representation of influential neighbours than that in the usual approach in which either all individuals in a metric range are included [11–13], even if this range is shortened during crowding [15], or a fixed number of nearest neighbours, i.e. topological range, is concerned [5,11,47].
2.2. Bird flocks: shape and distribution of density
The shape of flocks of birds is only rarely oblong: it differs between flocks and, in one and the same flock, it varies over time [45]. For instance, when a flock of rock doves or starlings is turning, the empirical data of the three-dimensional positions of its members show that density temporally increases and decreases, and the orientation of the flock changes relative to the direction of movement [59,60]. Besides, it has been observed in pewits, dunlins and starlings that individuals swap positions [23,45,60,61]. The same is found in our model, StarDisplay (see the electronic supplementary material, movie S2) [47]. In this model, the variability of shape, density and individual positions is a consequence of the constraints of the flying behaviour and of the locality of interaction.
Constraints of flying behaviour contain the rolling behaviour during turning and the low variability of the speed. First, during turning, individuals of the model have to roll into the turn to generate sufficient centripetal force for turning and for avoiding slipping out of the turn. Consequently, in the model, individuals lose effective lift (figure 2b). This results in a loss of altitude (figure 4b). Therefore, during such turns, the shape of the flock is variable also in the vertical direction. Similarly, also real birds lose altitude during turning, e.g. rock doves and steppe eagles [59,62]. Second, owing to (energetic) constraints of flying, individuals hardly slow down [63]. Therefore, during a turn, all individuals of a small flock follow a path of equal length and curvature (figure 4c). As a consequence, they change direction relative to the shape of the flock and therefore the shape of the flock changes in relation to the direction of movement. For instance, when the flock shape in the movement direction is oblong and all flock members turn 90° to the right (figure 4c), after the turn it will be wide in the movement direction. This turn is accompanied by swapping of locations between individuals: for instance, individuals located at the front before turning are located at the right side after turning [47]. Furthermore, the low variability of speed causes the distance to the nearest neighbours to be similar in the front half and the back half of the flock, as in large flocks of starlings [60]. Similarly, in the fish model, if we make individuals swim at almost fixed speed, individuals swap positions during turns, school shape changes relative to the direction of movement and the density is similar at the back and front (figure 4d) [47].
As to the effect of locality of interaction on variability of flock shape, we consider three causes. First, heterogeneity of environment: in StarDisplay, the environment consists of a ‘preferred space’ above the sleeping site and the space outside it. This preference causes temporary compression of large flocks, when some individuals have moved outside the preferred space, whereas others still fly in it. Consequently, individuals of a single flock may turn at different times in order to return to the preferred space. If the frontal individuals already have turned, but those in the rear still move outwards, the frontal individuals will approach those at the rear; thus, the flock compresses. Indeed, such a temporal increase in density during turning has been recorded in real flocks also [59].
Second, large flock size: even when flying approximately in a straight line in a homogeneous environment, larger flocks generate larger sub-flocks that move more independently and this will increase variability of flock shape [47]. In the model of starling flocks, StarDisplay, this arises because the velocity of individuals has been shown to be correlated to that of others close by. The correlation length (which reflects the temporary size of the sub-flock) appears to increase linearly with size of a flock with a slope of 0.44 (figure 7a) [47]. A similar correlation is found in empirical data of flocks of starlings [64], but the slope is steeper in the model than in empirical data (0.44 in the model versus 0.35 empirically). This is probably a consequence of the lower ‘disturbance’ in the model owing to its lack of factors such as wind and predators. When modelled flocks are larger, ‘sub-flocks’ appear to become also more diverse in their movement direction. This is apparent because the polarization in the whole group decreases with group size, whereas local polarization, as measured among nearest neighbours, remains constant independent of group size (figure 7b) [47].
Figure 7.
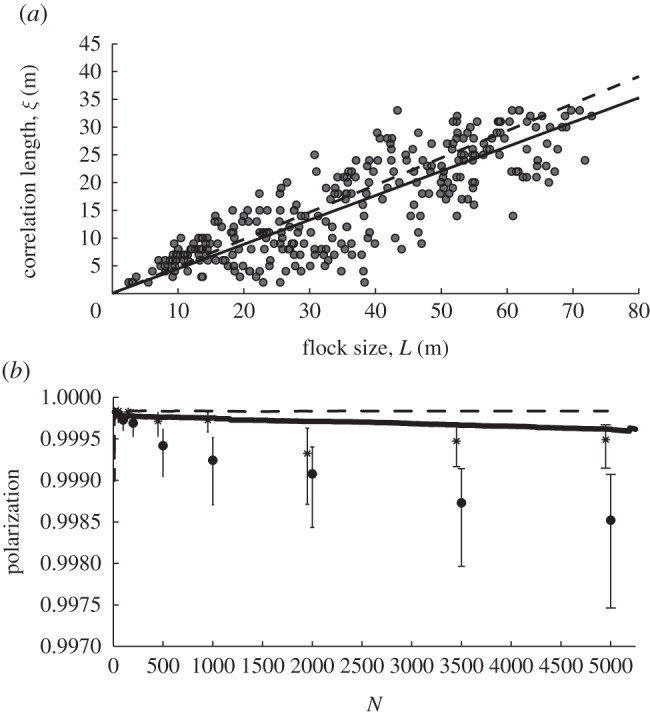
Deviation from the average of heading and velocity among individuals in the flock [47]. (a) Scale-free correlation between correlation length of deviation of velocity from that of the centre of gravity versus length of the flock (flock length is measured by the largest distance (metre) between two individuals in the flock) for 6.5 interaction partners where slope is 0.44 (solid line and dots) and for 50 interaction neighbours where slope is 0.48 (dashed line). (b) Decrease in polarization with flock size and with fewer interaction neighbours. Polarization (global and local) versus number of individuals in the flock for low number of interaction partners of 6.5 individuals (solid line, global; and black dots, local) and high number, 50 (dashed line and stars). N denotes number of flock members. Values and error bars indicate median and interquartile.
Third, a low number of interaction partners: when interactions are more local, subgroups move more independently and therefore the flock shape will become more variable. This arises because the lower the number of interaction partners is, the smaller is the size of the sub-flocks and the weaker is the slope of the correlation between flock size and size of sub-flocks, as can be seen by comparing the regression line for 6.5 interaction neighbours (solid line in figure 7a) and 50 interaction neighbours (dashed line in figure 7a) [47]. Besides, with a high number of interaction partners, flocks are denser and the shape is more static and closer to a ball shape [47].
The composition of these sub-flocks changes with time in the model (see the electronic supplementary material, movie S3). When interactions are more local (i.e. when the flock size is larger, the number of interaction partners is lower, or both), such fluctuations of velocity are slower and larger [65]. This holds even when the distance to the nearest neighbour is kept the same for the different numbers of interaction partners.
2.3. The angle to the nearest neighbour, the ‘bearing angle’
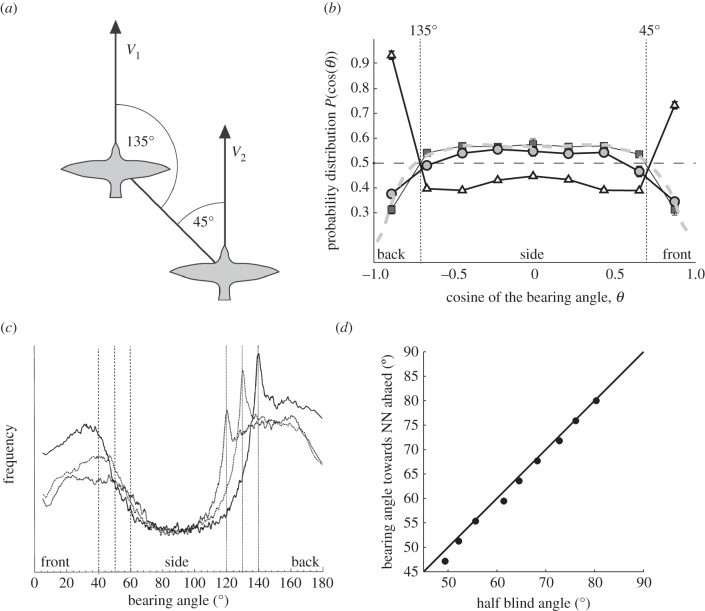
The distribution in the group of the angle between the movement direction of an individual and the direction to its closest neighbour has been studied in schools of fish and in flocks of birds. This angle is called the ‘bearing angle’ (figure 8a) [36,66], but the ‘bearing angle’ is also used to refer to the most frequent angle to the closest neighbour in the whole group (figure 8b,c). This angle was considered to be adapted to two functions in a travelling group, namely to optimal vision through the school to detect a potential predator [67] or monitor each other [41], and to the optimal angle to exploit the wake from others [41,68]. As to the hypothesis of optimal vision through the swarm, no specific bearing angle has been suggested. With regard to gaining energy from the wake of others, flocking birds were assumed to save energy by flying in V-formation, which indeed has been confirmed in empirical data [69]. Note that flying in the usual, less-ordered flock (cluster-flock) appeared costly in energy [70]. For schools of fish, a specific rigid formation, the so-called diamond-like structure, was predicted to reflect maximal energy saving [66]. Empirical data on bearing angles however showed that in schools of several species of fish the predicted rigid formation was not found [39,41,54,71]. Nevertheless, a number of facts indicate hydrodynamic benefits: for instance, individuals were shown to use less oxygen when in a school than when alone [67,72]; they beat their tail or fins slower at the rear of schools than elsewhere [73–76]. Also, they have been shown to exploit the wake behind a pillar [77,78]. In order to understand how fish save energy by moving in a school rather than alone, empirical studies should be supplemented with computer simulations, because it is empirically very difficult to measure forces of lift and drag particularly in a school and to measure what happens to the interacting wakes of several fish. Such a model should represent both the schooling of the individuals and the hydrodynamics. Recently, a particle-based simulation of schooling, using the so-called multiple particle collision dynamics (MPCD) method or stochastic rotation dynamics (SRD) method, has been applied: in it, hydrodynamics emerges from the interaction of 30 million particles among themselves and with the undulating fish [25,29]. In this simulation, the undulation of fish induces the same wake as in real fish, i.e. the reverse von Kàrmàn street (figure 9) [25]. At present, we study in it the advantages of swimming in schools with different rigid spatial configurations, such as a diamond configuration [66] and others.
Figure 8.
Bearing angles. (a) Bearing angles θ or direction towards the nearest neighbour from the perspective of individual V1 and of individual V2. Bearing angle of V1 points 135° forwards (or 45° backwards), of V2 it points 45° forwards. (b) Distribution of directions of nearest neighbour (i.e. ‘bearing angles’) in StarDisplay [5,47]. Circles: average angular distribution of empirical data of flocks of starlings [60]. Rectangles: average angular distribution of modelled flocks of same size as empirical data without a blind angle for separation. Triangles: average angular distribution of modelled flocks of individuals with a blind angle of 90° at the back (or 45° from the midline). Grey dashed curve: averaged nearest neighbour distribution of 100 randomly chosen flocks in the model. Dashed line: expected value for a random isotropic system, where the probability to find any bearing angle is the same for all angles Prandom(cos(θ)) = ½. Standard error bars are smaller than the symbols. (c) Distribution of highest frequency of bearing angles in model of fish schools (indicated by vertical lines) [15] for different sizes of the full blind angle, namely of 120°, 130° and 140°. (d) The relationship between blind angle (halved) and bearing angle towards nearest neighbour (NN) ahead (vertical lines in (c)) in the model of fish schools. For blind angle, see figure 2a.
Figure 9.
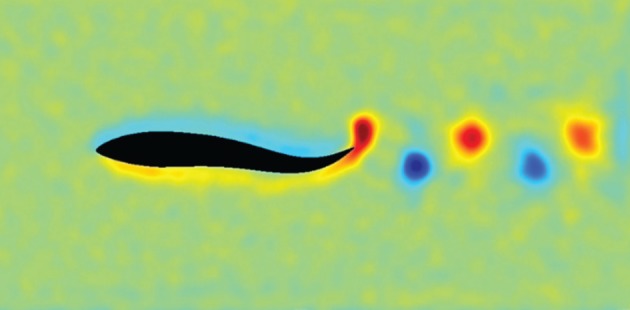
Wake behind a swimming mullet in MPCD or SRD model [25].
So far, it is thus unexplained what causes the specific bearing angles and their great variability observed in schools of fish and cluster-flocks of birds [79]. In cluster-flocks of birds, the bearing angle was found at 90° in starlings [60] and at 45° in dunlins [80]. In fish, the bearing angle was at 90° in cod, in herring at 45° [41,68,81], but in pollock and bluefin tunas, it was sometimes at 90° and sometimes at 45° [41,68].
Our models of self-organized grouping of fish and birds show that bearing angles similar to empirical ones emerge from the avoidance interactions among nearby neighbours, but only if groups are dense. If the group is dense, the bearing angle emerges as a side-effect of the blind angle (figure 1c), because individuals may be approached closer in their blind angle than in their field of view (triangles in figure 8b and maxima in 8c). Consequently, the bearing angle scales linearly, positively with the blind angle (figure 8d). For instance, when the blind angle is 90°, or 45° from the midline, the bearing angle is 45° from the individual behind to that ahead of it, and when it is 60° from the midline, the bearing angle is 60° to the closest individual ahead (figure 8d). The same holds for the bearing angles to the closest neighbours backwards (figure 8a). If groups are less dense, individuals may be at such a distance from their closest neighbour that they perceive them (due to their head movements) also when closest neighbours are behind them. This we can represent by vision without a blind angle. Because in both models, of fish and of birds, it is easier to avoid others sidewards than to slow down, closest individuals end up on the side in this case (squares and circles, figure 8b). Following this reasoning, we may attribute the bearing angle of 45° (135°) in herrings to the obligate schooling [41] and in dunlins to the dense flocking [80], that of 90° in cod to facultative schooling [41] and in starlings to the extremely sparse flocks [23,60]. Further, we may attribute the occurrence of both angles (45° (135°) and 90°) in groups of pollock and bluefin tunas to their different densities. Note that in models of fish as well as of birds, the bearing angle is found to be independent of the number of group members (see electronic supplementary material, figure S1).
3. Discussion
In this study on collective motion of fish and birds, we have surveyed model-based explanations for the causation of group shape, group density and distribution of the bearing angle.
Model-based explanations have highlighted the importance of properties of locomotory behaviour and sensory perception. For instance, owing to swimming at a constant depth and slowing down to avoid collisions, the shape of schools is oblong. The larger vertical movements of flocks of birds due to their rolling during turning cause a shape that is variable in the vertical direction. Speed is more constant in our models of birds than of fish due to the constraints imposed by flying. This leads to more variation in the orientation of shape relative to its movement direction during turning in flocks of birds than in schools of fish. In the case where flocks move straight forward, the orientation of their shape depends on the initial orientation. Low variability of speed also leads to a more homogeneous distribution of density in the group than variable speed does, which explains the difference in density distribution between fish schools and bird flocks. Interactions that are more local (in the case of a lower number of interaction partners, a larger group, or both) result in a more complex shape and structure of groups of both fish and birds.
Sensory constraints represented by the limitation of the field of perception as a result of the blind angle determine the bearing angle in dense groups, in our models of both fish and birds. At present, we are studying in our models of hydrodynamics and schooling also the possible hydrodynamic advantages of schooling [25].
These model-based explanations are process-oriented, i.e. based on interactions among individuals and between individuals with their environment. For their invention, simulation experiments have been essential. They do not refute other explanations. In reality, shape and internal structure are likely to be influenced also by other factors, such as in fish by hypoxia, water temperature and depth [82,83] and in birds by air density and wind [84]. Such trade-offs are not discussed here because they have not yet been studied in models of self-organization.
Explanations generated by these models can be falsified empirically because they are based on several patterns that can be verified in empirical data.
Testable predictions concern, for instance, the following.
- — If variability of speed is high:
- • shape is less oblong, and polarization is stronger in groups that are faster and
- • density is more frontal in groups that are larger, and in groups that are slower.
— Greater variability of speed is associated with the following traits: the shape of the group is more oblong and more stable during turning, and the highest density is more frontal.
— When density is sufficiently high, the blind angle is positively correlated with the bearing angle. Empirically we may imagine that in different species of fish with the same eye morphology, the blind angle is smaller when fish undulate than when they are pectoral swimmers and decreases with the amplitude of the head movement. Similarly for birds, the size of the blind angle may depend not only on that of the visual field [85], but also on the frequency of head movement [63,86].
— Bearing angles are similar in groups of different numbers of group members.
Because individuals in these models of swarming are merely a sketch of what real animals are, these models need extensions in future. For instance, they may be extended with variation in behaviour among individuals. Such variation may influence the internal structure of the group, as shown for models of primates [87]. Here, variation in dominance (tendency to win a fight) results in an internal structure with centrality of dominants [88]. Besides, variation in velocity in models of traffic of pedestrians and cars leads to combustion [89,90]. Individuals in these models may be extended with other motivations beyond movement and coordination, such as spawning behaviour [91] and predator avoidance [20,92–94]. These additional motivations have been shown to be of great influence on internal structure and group shape.
Rules of our models have been biologically inspired, but are a strong simplification. For instance, in our flocking model [5,47], flying is represented by fixed-wing aerodynamics and vision by a vision cone [15,26]. It will be interesting to represent in future these aspects in more detail.
Already in its present form, this modelling procedure leads to an integrative approach to collective behaviour. It shows that patterns at the level of the group that resemble empirical data emerge by self-organization from local, behavioural interactions among individuals. Herewith, it increases our understanding of empirical data, and it is a good starting point for further empirical studies.
Acknowledgements
We are grateful for the grants that have been supporting this research, a grant from Pfeifer's laboratory in Zurich for the PhD of Hanspeter Kunz, Hemelrijk's start-up grant of her Rosalind Franklin Fellowship for the PhD of Daan Reid, her Pilot grant from NWO, her grant in the European project of the seventh framework, StarFlag for the work by Hanno Hildenbrandt. We thank the self-organization group for regular discussions and Eize Stamhuis, Johan Padding and many master students for their cooperation.
References
- 1.Dussutour A., Fourcassié V., Helbing D., Deneubourg J. L. 2004. Optimal traffic organization in ants under crowded conditions. Nature 428, 70–73 10.1038/nature02345 (doi:10.1038/nature02345) [DOI] [PubMed] [Google Scholar]
- 2.Jeanson R., Kukuk P. F., Fewell J. H. 2005. Emergence of division of labour in halictine bees: contributions of social interactions and behavioural variance. Anim. Behav. 70, 1183–1193 10.1016/j.anbehav.2005.03.004 (doi:10.1016/j.anbehav.2005.03.004) [DOI] [Google Scholar]
- 3.Couzin I. D., Krause J., Franks N. R., Levin S. A. 2005. Effective leadership and decision-making in animal groups on the move. Nature 433, 513–516 10.1038/nature03236 (doi:10.1038/nature03236) [DOI] [PubMed] [Google Scholar]
- 4.Ward A. J. W., Sumpter D. J. T., Couzin I. D., Hart P. J. B., Krause J. 2008. Quorum decision-making facilitates information transfer in fish schools. Proc. Natl Acad. Sci. USA 105, 6948–6953 10.1073/pnas.0710344105 (doi:10.1073/pnas.0710344105) [DOI] [PMC free article] [PubMed] [Google Scholar]
- 5.Hildenbrandt H., Carere C., Hemelrijk C. K. 2010. Self-organized aerial displays of thousands of starlings: a model. Behav. Ecol. 21, 1349–1359 10.1093/beheco/arq149 (doi:10.1093/beheco/arq149) [DOI] [Google Scholar]
- 6.Puga-Gonzalez I., Hildenbrandt H., Hemelrijk C. K. 2009. Emergent patterns of social affiliation in primates, a model. PLoS Comput. Biol. 5, e1000630. 10.1371/journal.pcbi.1000630 (doi:10.1371/journal.pcbi.1000630) [DOI] [PMC free article] [PubMed] [Google Scholar]
- 7.Hemelrijk C. K., Puga-Gonzalez I. 2012. An individual-oriented model on the emergence of support in fights, its reciprocation and exchange. PLoS ONE 7, e37271. 10.1371/journal.pone.0037271 (doi:10.1371/journal.pone.0037271) [DOI] [PMC free article] [PubMed] [Google Scholar]
- 8.Moussaid M., Niriaska P., Garnier S., Helbing D., Theraulaz G. 2010. The walking behaviour of pedestrian social groups and its impact on crowd dynamics. PLoS ONE 5, e10047. 10.1371/journal.pone.0010047 (doi:10.1371/journal.pone.0010047) [DOI] [PMC free article] [PubMed] [Google Scholar]
- 9.Vicsek T., Czirók A., Ben-Jacob E., Cohen I., Shochet O. 1995. Novel type of phase transition in a system of self-driven particles. Phys. Rev. Lett. 75, 1226–1229 10.1103/PhysRevLett.75.1226 (doi:10.1103/PhysRevLett.75.1226) [DOI] [PubMed] [Google Scholar]
- 10.Buhl J., Sumpter D. J. T., Couzin I. D., Hale J. J., Despland E., Miller E. R., Simpson S. J. 2006. From disorder to order in marching locusts. Science 312, 1402–1406 10.1126/science.1125142 (doi:10.1126/science.1125142) [DOI] [PubMed] [Google Scholar]
- 11.Huth A., Wissel C. 1992. The simulation of the movement of fish schools. J. Theor. Biol. 156, 365–385 10.1016/S0022-5193(05)80681-2 (doi:10.1016/S0022-5193(05)80681-2) [DOI] [Google Scholar]
- 12.Reuter H., Breckling B. 1994. Selforganization of fish schools: an object-oriented model. Ecol. Model. 75, 147–159 10.1016/0304-3800(94)90014-0 (doi:10.1016/0304-3800(94)90014-0) [DOI] [Google Scholar]
- 13.Couzin I. D., Krause J., James R., Ruxton G. D., Franks N. R. 2002. Collective memory and spatial sorting in animal groups. J. Theor. Biol. 218, 1–11 10.1006/jtbi.2002.3065 (doi:10.1006/jtbi.2002.3065) [DOI] [PubMed] [Google Scholar]
- 14.Kunz H., Hemelrijk C. K. 2003. Artificial fish schools: collective effects of school size, body size, and body form. Artif. Life 9, 237–253 10.1162/106454603322392451 (doi:10.1162/106454603322392451) [DOI] [PubMed] [Google Scholar]
- 15.Hemelrijk C. K., Hildenbrandt H. 2008. Self-organized shape and frontal density of fish schools. Ethology 114, 245–254 10.1111/j.1439-0310.2007.01459.x (doi:10.1111/j.1439-0310.2007.01459.x) [DOI] [Google Scholar]
- 16.Kunz H., Hemelrijk C. K. 2012. Simulations of the social organization of large schools of fish whose perception is obstructed. Appl. Anim. Behav. Sci. 138, 142–151 10.1016/j.applanim.2012.02.002 (doi:10.1016/j.applanim.2012.02.002) [DOI] [Google Scholar]
- 17.Viscido S. V., Parrish J. K., Grunbaum D. 2005. The effect of population size and number of influential neighbors on the emergent properties of fish schools. Ecol. Model. 183, 347–363 10.1016/j.ecolmodel.2004.08.019 (doi:10.1016/j.ecolmodel.2004.08.019) [DOI] [Google Scholar]
- 18.Lee S. H., Pak H. K., Chon T. S. 2005. Dynamics of prey flock escaping behavior in response to predator's attack. J. Theor. Biol. 240, 250–259 10.1016/j.jtbi.2005.09.009 (doi:10.1016/j.jtbi.2005.09.009) [DOI] [PubMed] [Google Scholar]
- 19.Craig W. R. 1987. Flocks, herds and schools: a distributed behavioral model. New York, NY: ACM [Google Scholar]
- 20.Inada Y., Kawachi K. 2002. Order and flexibility in the motion of fish schools. J. Theor. Biol. 214, 371–387 10.1006/jtbi.2001.2449 (doi:10.1006/jtbi.2001.2449) [DOI] [PubMed] [Google Scholar]
- 21.Norberg U. M. 1990. Vertebrate flight: mechanics, physiology, morphology, ecology and evolution. New York, NY: Springer [Google Scholar]
- 22.Videler J. J. 2005. Avian flight. Oxford, UK: Oxford University Press [Google Scholar]
- 23.Ballerini M., et al. 2008. Interaction ruling animal collective behaviour depends on topological rather than metric distance: evidence from a field study. Proc. Natl Acad. Sci. USA 105, 1232–1237 10.1073/pnas.0711437105 (doi:10.1073/pnas.0711437105) [DOI] [PMC free article] [PubMed] [Google Scholar]
- 24.Carere C., Montanino S., Moreschini F., Zoratto F., Chiarotti F., Santucci D., Alleva E. 2009. Aerial flocking patterns of wintering starlings, Sturnus vulgaris, under different predation risk. Anim. Behav. 77, 101–107 10.1016/j.anbehav.2008.08.034 (doi:10.1016/j.anbehav.2008.08.034) [DOI] [Google Scholar]
- 25.Reid D. A. P., Hildenbrandt H., Padding J. T., Hemelrijk C. K. 2012. Fluid dynamics of moving fish in a two-dimensional multiparticle collision dynamics model. Phys. Rev. E 85, 021901. 10.1103/PhysRevE.85.021901 (doi:10.1103/PhysRevE.85.021901) [DOI] [PubMed] [Google Scholar]
- 26.Huth A., Wissel C. 1994. The simulation of fish schools in comparison with experimental data. Ecol. Model. 75/76, 135–145 10.1016/0304-3800(94)90013-2 (doi:10.1016/0304-3800(94)90013-2) [DOI] [Google Scholar]
- 27.Ward S., Mueller U., Rayner J. M. V., Jackson D. M., Nachtigall W., Speakman J. R. 2004. Metabolic power of European starlings Sturnus vulgaris during flight in a wind tunnel, estimated from heat transfer modelling, doubly labelled water and mask respirometry. J. Exp. Biol. 207, 4291–4298 10.1242/jeb.01281 (doi:10.1242/jeb.01281) [DOI] [PubMed] [Google Scholar]
- 28.Hemelrijk C. K., Hildenbrandt H., Reinders J., Stamhuis E. J. 2010. Emergence of oblong school shape: models and empirical data of fish. J. Theor. Biol. 116, 1099–1112 10.1111/j.1439-0310.2010.01818.x (doi:10.1111/j.1439-0310.2010.01818.x) [DOI] [Google Scholar]
- 29.Reid D. A. P., Hildenbrandt H., Padding J. T., Hemelrijk C. K. 2009. Flow around fishlike shapes studied using multiparticle collision dynamics. Phys. Rev. E 79, 046313. 10.1103/PhysRevE.79.046313 (doi:10.1103/PhysRevE.79.046313) [DOI] [PubMed] [Google Scholar]
- 30.Krause J., Ruxton G. D. 2002. Living in groups. New York, NY: Oxford University Press [Google Scholar]
- 31.Breder C. M. 1959. Studies on social groupings in fish. Bull. Am. Mus. Nat. Hist. 117, 397–481 [Google Scholar]
- 32.Cushing D. H., Harden-Jones F. R. 1968. Why do fish school? Nature 218, 918–920 10.1038/218918b0 (doi:10.1038/218918b0) [DOI] [PubMed] [Google Scholar]
- 33.Hamilton W. D. 1971. Geometry for the selfish herd. J. Theor. Biol. 31, 295–311 10.1016/0022-5193(71)90189-5 (doi:10.1016/0022-5193(71)90189-5) [DOI] [PubMed] [Google Scholar]
- 34.Vine I. 1971. Risk of visual detection and pursuit by a predator and the selective advantage of flocking behaviour. J. Theor. Biol. 30, 405–422 10.1016/0022-5193(71)90061-0 (doi:10.1016/0022-5193(71)90061-0) [DOI] [PubMed] [Google Scholar]
- 35.Radakov D. V. 1973. Schooling in the ecology of fish. New York, NY: John Wiley and Sons [Google Scholar]
- 36.Breder C. M. 1976. Fish schools as operational structures. Fish. Bull. 74, 471–502 [Google Scholar]
- 37.Brierley A. S., Cox M. J. 2010. Shapes of krill swarms and fish schools emerge as aggregation members avoid predators and access oxygen. Curr. Biol. 20, 1758–1762 10.1016/j.cub.2010.08.041 (doi:10.1016/j.cub.2010.08.041) [DOI] [PubMed] [Google Scholar]
- 38.Cullen J. M., Shaw E., Baldwin H. A. 1965. Methods for measuring the three-dimensional structure of fish schools. Anim. Behav. 13, 534–543 10.1016/0003-3472(65)90117-X (doi:10.1016/0003-3472(65)90117-X) [DOI] [PubMed] [Google Scholar]
- 39.Pitcher T. J. 1973. The three-dimensional structure of schools in minnow, Phoxinus phoxinus (L). Anim. Behav. 21, 673–686 10.1016/S0003-3472(73)80091-0 (doi:10.1016/S0003-3472(73)80091-0) [DOI] [Google Scholar]
- 40.Pitcher T. J., Partridge B. L. 1979. Fish school density and volume. Mar. Biol. 54, 383–394 10.1007/BF00395444 (doi:10.1007/BF00395444) [DOI] [Google Scholar]
- 41.Partridge B. L., Pitcher T., Cullen J. M., Wilson J. 1980. The three-dimensional structure of fish schools. Behav. Ecol. Sociobiol. 6, 277–288 10.1007/BF00292770 (doi:10.1007/BF00292770) [DOI] [Google Scholar]
- 42.Pitcher T. J. 1980. Some ecological consequences of fish school volumes. Freshw. Biol. 10, 539–544 10.1111/j.1365-2427.1980.tb01229.x (doi:10.1111/j.1365-2427.1980.tb01229.x) [DOI] [Google Scholar]
- 43.Pitcher T. J. 1986. Functions of shoaling behaviour in teleosts. In The behaviour of teleost fishes (ed. Pitcher T. J.), pp. 294–337 London, UK: Croom Helm [Google Scholar]
- 44.Bumann D., Krause J., Rubenstein D. 1997. Mortality risk of spatial positions in animal groups: the danger of being in the front. Behaviour 134, 1063–1076 10.1163/156853997X00403 (doi:10.1163/156853997X00403) [DOI] [Google Scholar]
- 45.Davis M. J. 1980. The coordinated aerobatics of dunlin flocks. Anim. Behav. 28, 668–673 10.1016/S0003-3472(80)80127-8 (doi:10.1016/S0003-3472(80)80127-8) [DOI] [Google Scholar]
- 46.Hemelrijk C. K., Kunz H. 2005. Density distribution and size sorting in fish schools: an individual-based model. Behav. Ecol. 16, 178–187 10.1093/beheco/arh149 (doi:10.1093/beheco/arh149) [DOI] [Google Scholar]
- 47.Hemelrijk C. K., Hildenbrandt H. 2011. Some causes of the variable shape of flocks of birds. PLoS ONE 6, e22479. 10.1371/journal.pone.0022479 (doi:10.1371/journal.pone.0022479) [DOI] [PMC free article] [PubMed] [Google Scholar]
- 48.Inagaki T., Sakamoto W., Kuroki T. 1976. Studies on the schooling behaviour on fish II: mathematical modelling of schooling form depending on the intensity of mutual force between individuals. Bull. Jpn. Soc. Sci. Fish. 42, 265–270 10.2331/suisan.42.265 (doi:10.2331/suisan.42.265) [DOI] [Google Scholar]
- 49.Viscido S. V., Parrish J. K., Grunbaum D. 2004. Individual behavior and emergent properties of fish schools: a comparison of observation and theory. Mar. Ecol. Prog. Ser. 273, 239–249 10.3354/meps273239 (doi:10.3354/meps273239) [DOI] [Google Scholar]
- 50.Breder C. M. 1954. Equations descriptive of fish schools and other animal aggregations. Ecology 35, 361–370 10.2307/1930099 (doi:10.2307/1930099) [DOI] [Google Scholar]
- 51.Keenleyside M. H. A. 1955. Some aspects of schooling behaviour in fish. Behaviour 8, 183–248 10.1163/156853955X00229 (doi:10.1163/156853955X00229) [DOI] [Google Scholar]
- 52.Nursall J. R. 1973. Some behavioral interactions of spottail shiners (Notropis hudsonius), yellow perch (Perca flavescens), and northern pike (Esox-Lucius). J. Fish. Res. Board Can. 30, 1161–1178 10.1139/f73-187 (doi:10.1139/f73-187) [DOI] [Google Scholar]
- 53.Bauer H. R., Omark D. R., Strayer F. F., Freedman D. 1980. Chimpanzee society and social dominance in evolutionary perspective. Dominance relations: ethological perspectives of human conflict, pp. 97–119 New York, NY: Garland [Google Scholar]
- 54.Partridge B. L. 1980. Effect of school size on the structure and dynamics of minnow schools. Anim. Behav. 28, 68–77 10.1016/S0003-3472(80)80009-1 (doi:10.1016/S0003-3472(80)80009-1) [DOI] [Google Scholar]
- 55.Katz Y., Tunstrom K., Ioannou C. C., Huepe C., Couzin I. D. 2011. Inferring the structure and dynamics of interactions in schooling fish. Proc. Natl Acad. Sci. USA 108, 18 720–18 725 10.1073/pnas.1107583108 (doi:10.1073/pnas.1107583108) [DOI] [PMC free article] [PubMed] [Google Scholar]
- 56.Herbert-Read J. E., Perna A., Mann R. P., Schearf T. M., Sumpter D. J. T., Ward A. J. W. 2011. Inferring the rules of interaction of shoaling fish. Proc. Natl Acad. Sci. USA 108, 18 726–18 731 10.1073/pnas.1109355108 (doi:10.1073/pnas.1109355108). [DOI] [PMC free article] [PubMed] [Google Scholar]
- 57.Misund O. A. 1993. Dynamics of moving masses: variability in packing density, shape, and size among herring, sprat, and saithe schools. ICES J. Mar. Sci. 50, 145–160 10.1006/jmsc.1993.1016 (doi:10.1006/jmsc.1993.1016) [DOI] [Google Scholar]
- 58.Gerlotto F., Jones E., Bez N., Reid D. G. 2010. When good neighbours become good friends: observing small scale structures in fish aggregations using multibeam sonar. Aquat. Living Resour. 23, 143–151 10.1051/alr/2010017 (doi:10.1051/alr/2010017) [DOI] [Google Scholar]
- 59.Pomeroy H., Heppner F. 1992. Structure of turning in airborne rock dove (Columba livia) flocks. Auk 109, 256–267 [Google Scholar]
- 60.Ballerini M., et al. 2008. Empirical investigation of starling flocks: a benchmark study in collective animal behaviour. Anim. Behav. 76, 201–215 10.1016/j.anbehav.2008.02.004 (doi:10.1016/j.anbehav.2008.02.004) [DOI] [Google Scholar]
- 61.Selous E. 1931. Thought transference (or what?) in birds. London, UK: Constable and Company Ltd [Google Scholar]
- 62.Gillies J. A., Bacic M., Yuan F. G., Thomas A. L. R., Taylor G. K. 2008. Modeling and identification of steppe eagle (Aquila nipalensis) dynamics. In Proc. AIAA Modeling and Simulation Technologies Conf., paper AIAA-2008-7096. [Google Scholar]
- 63.Martin G. R. 2011. Understanding bird collisions with man-made objects: a sensory ecology approach. Ibis 153, 239–254 10.1111/j.1474-919X.2011.01117.x (doi:10.1111/j.1474-919X.2011.01117.x) [DOI] [Google Scholar]
- 64.Cavagna A., Cimarelli A., Giardina I., Parisi G., Santagati R., Stefanini F., Viale M. 2010. Scale-free correlations in starling flocks. Proc. Natl Acad. Sci. USA 107, 11 865–11 870 10.1073/pnas.1005766107 (doi:10.1073/pnas.1005766107) [DOI] [PMC free article] [PubMed] [Google Scholar]
- 65.Hemelrijk C. K., Hildenbrandt H. Submitted. Connectivity and dynamics in flocks of birds.
- 66.Weihs D. 1973. Hydromechanics of fish schooling. Nature 241, 290–291 10.1038/241290a0 (doi:10.1038/241290a0) [DOI] [Google Scholar]
- 67.Abrahams M. V., Colgan P. W. 1985. Risk of predation, hydrodynamic efficiency and their influence on school structure. Environ. Biol. Fishes 13, 195–202 10.1007/BF00000931 (doi:10.1007/BF00000931) [DOI] [Google Scholar]
- 68.Partridge B. L., Johansson J., Kalish J. 1983. The structure of schools of giant bluefin tuna in Cape Cod Bay. Environ. Biol. Fishes 9, 253–262 10.1007/BF00692374 (doi:10.1007/BF00692374) [DOI] [Google Scholar]
- 69.Weimerskirch H., Martin J., Clerquin Y., Alexandre P., Jiraskova S. 2001. Energy saving in flight formation: pelicans flying in a ‘V’ can glide for extended periods using the other birds’ air streams. Nature 413, 697–698 10.1038/35099670 (doi:10.1038/35099670) [DOI] [PubMed] [Google Scholar]
- 70.Usherwood J. R., Stavrou M., Lowe J. C., Roskilly K., Wilson A. M. 2011. Flying in a flock comes at a cost in pigeons. Nature 474, 494–497 10.1038/nature10164 (doi:10.1038/nature10164) [DOI] [PMC free article] [PubMed] [Google Scholar]
- 71.van Olst J. C., Hunter J. R. 1970. Some aspects of the organization of fish schools. J. Fish. Res. Board Can. 27, 1225–1238 10.1139/f70-145 (doi:10.1139/f70-145) [DOI] [Google Scholar]
- 72.Herskin J., Steffensen J. F. 1998. Energy savings in sea bass swimming in a school: measurements of tail beat frequency and oxygen consumption at different swimming speeds. J. Fish Biol. 53, 366–376 10.1111/j.1095-8649.1998.tb00986.x (doi:10.1111/j.1095-8649.1998.tb00986.x) [DOI] [Google Scholar]
- 73.Zuev G. V., Belyaev V. V. 1970. An experimental study with reference to horse mackerel, Trachurus mediterraneus ponticus. J. Ichtyol. 10, 545–549 [Google Scholar]
- 74.Svendsen J. C., Skov J., Bildsoe M., Steffensen J. F. 2003. Intra-school positional preference and reduced tail beat frequency in trailing positions in schooling roach under experimental conditions. J. Fish Biol. 62, 834–846 10.1046/j.1095-8649.2003.00068.x (doi:10.1046/j.1095-8649.2003.00068.x) [DOI] [Google Scholar]
- 75.Killen S. S., Marras S., Steffensen J. F., McKenzie D. J. 2012. Aerobic capacity influences the spatial position of individuals within fish schools. Proc. R. Soc. B 279, 357–364 10.1098/rspb.2011.1006 (doi:10.1098/rspb.2011.1006) [DOI] [PMC free article] [PubMed] [Google Scholar]
- 76.Johansen J. L., Vaknin R., Steffensen J. F., Domenici P. 2010. Kinematics and energetic benefits of schooling in the labriform fish, striped surfperch Embiotoca lateralis. Mar. Ecol. Prog. Ser. 420, 221–229 10.3354/meps08885 (doi:10.3354/meps08885) [DOI] [Google Scholar]
- 77.Liao J. C., Beal D. N., Lauder G. V., Triantafyllou M. S. 2003. Fish exploiting vortices decrease muscle activity. Science 302, 1566–1569 10.1126/science.1088295 (doi:10.1126/science.1088295) [DOI] [PubMed] [Google Scholar]
- 78.Beal D. N., Hover F. S., Triantafyllou M. S., Liao J. C., Lauder G. V. 2006. Passive propulsion in vortex wakes. J. Fluid Mech. 549, 385–402 10.1017/S0022112005007925 (doi:10.1017/S0022112005007925) [DOI] [Google Scholar]
- 79.Heppner F. 1974. Avian flight formation. Bird Binding 45, 160–169 10.2307/4512025 (doi:10.2307/4512025) [DOI] [Google Scholar]
- 80.Major P. F., Dill L. M. 1978. The three-dimensional structure of airborne bird flocks. Behav. Ecol. Sociobiol. 4, 111–122 10.1007/BF00354974 (doi:10.1007/BF00354974) [DOI] [Google Scholar]
- 81.Partridge B. L. 1982. The structure and function of fish schools. Sci. Am. 246, 114–123 10.1038/scientificamerican0682-114 (doi:10.1038/scientificamerican0682-114) [DOI] [PubMed] [Google Scholar]
- 82.Domenici P., Lefrancois C., Shingles A. 2007. Hypoxia and the antipredator behaviours of fishes. Phil. Trans. R. Soc. B 362, 2105–2121 10.1098/rstb.2007.2103 (doi:10.1098/rstb.2007.2103) [DOI] [PMC free article] [PubMed] [Google Scholar]
- 83.Fish F. E. 2012. Swimming strategies for energy economy. In Fish swimming: an etho-ecological perspective (eds Domenici P., Kapoor B. G.), pp. 90–120 Enfield, NH: Science Publishers [Google Scholar]
- 84.Pennycuick C. J. 2008. Modelling the flying bird, 1st edn Amsterdam, The Netherlands: Academic Press [Google Scholar]
- 85.Martin G. R., Katzir G. 1999. Visual fields in short-toed eagles, Circaetus gallicus (Accipitridae), and the function of binocularity in birds. Brain Behav. Evol. 53, 55–66 10.1159/000006582 (doi:10.1159/000006582) [DOI] [PubMed] [Google Scholar]
- 86.Land M. F. 1999. The roles of head movements in the search and capture strategy of a tern (Aves, Laridae). J. Comp. Physiol. 184, 265–272 10.1007/s003590050324 (doi:10.1007/s003590050324) [DOI] [Google Scholar]
- 87.Hemelrijk C. K., Wantia J. 2005. Individual variation by self-organisation: a model. Neurosci. Biobehav. Rev. 29, 125–136 10.1016/j.neubiorev.2004.07.003 (doi:10.1016/j.neubiorev.2004.07.003) [DOI] [PubMed] [Google Scholar]
- 88.Hemelrijk C. K. 1999. An individual-oriented model on the emergence of despotic and egalitarian societies. Proc. R. Soc. Lond. B 266, 361–369 10.1098/rspb.1999.0646 (doi:10.1098/rspb.1999.0646) [DOI] [Google Scholar]
- 89.Moussaid M., et al. 2012. Traffic instabilities in self-organized pedstrian crowds. PLoS Comput. Biol. 8, e1002442. 10.1371/journal.pcbi.1002442 (doi:10.1371/journal.pcbi.1002442) [DOI] [PMC free article] [PubMed] [Google Scholar]
- 90.Helbing D., Huberman B. A. 1998. Coherent moving states in highway traffic. Nature 396, 738–740 10.1038/25499 (doi:10.1038/25499) [DOI] [Google Scholar]
- 91.Vabø R., Skaret G. 2008. Emerging school structures and collective dynamics in spawning herring: a simulation study. Ecol. Model. 214, 125–140 10.1016/j.ecolmodel.2008.01.026 (doi:10.1016/j.ecolmodel.2008.01.026) [DOI] [Google Scholar]
- 92.Zheng M., Kashimori Y., Hoshino O., Fujita K., Kambara T. 2005. Behavior pattern (innate action) of individuals in fish schools generating efficient collective evasion from predation. J. Theor. Biol. 235, 153–167 10.1016/j.jtbi.2004.12.025 (doi:10.1016/j.jtbi.2004.12.025) [DOI] [PubMed] [Google Scholar]
- 93.Lee S. H. 2006. Predator's attack-induced phase-like transition in prey flock. Phys. Lett. A 357, 270–274 10.1016/j.physleta.2006.04.065 (doi:10.1016/j.physleta.2006.04.065) [DOI] [Google Scholar]
- 94.Vabø R., Nøttestad L. 1997. An individual based model of fish school reactions: predicting antipredator behaviour as observed in nature. Fish. Oceanogr. 6, 155–171 10.1046/j.1365-2419.1997.00037.x (doi:10.1046/j.1365-2419.1997.00037.x) [DOI] [Google Scholar]


