Abstract
Models of self-propelled particles (SPPs) are an indispensable tool to investigate collective animal behaviour. Originally, SPP models were proposed with metric interactions, where each individual coordinates with neighbours within a fixed metric radius. However, recent experiments on bird flocks indicate that interactions are topological: each individual interacts with a fixed number of neighbours, irrespective of their distance. It has been argued that topological interactions are more robust than metric ones against external perturbations, a significant evolutionary advantage for systems under constant predatory pressure. Here, we test this hypothesis by comparing the stability of metric versus topological SPP models in three dimensions. We show that topological models are more stable than metric ones. We also show that a significantly better stability is achieved when neighbours are selected according to a spatially balanced topological rule, namely when interacting neighbours are evenly distributed in angle around the focal individual. Finally, we find that the minimal number of interacting neighbours needed to achieve fully stable cohesion in a spatially balanced model is compatible with the value observed in field experiments on starling flocks.
1. Introduction
One of the prominent features of collective animal behaviour is the way animal groups manage to stay together in spite of predatory attacks and environmental perturbations [1]. During aerial display of starlings, for example, flocks fly for almost an hour above the roost, in the presence of falcons and seagulls exerting continuous disturbances. In this respect, flocks exhibit a very efficient response, with a large degree of coordination and very robust cohesion. Flocks are an emblematic case of self-organized collective behaviour, where global patterns emerge from local interaction between individuals [2,3]. In this respect, a crucial question is: what kind of interactions are able to grant the group the robustness to perturbations that we observe?
Experimental results on flocks of starlings (Sturnus vulgaris) [4,5] gave some insight into the nature of the interaction between birds. In the study of Ballerini et al. [4], it was discovered that interactions are topological, each individual coordinating with a fixed number (approx. 7) of closest neighbours, irrespective of their distances. This result contrasted to what assumed by most models of self-organized collective motion, where metric interactions were used [6–12].
In the study of Ballerini et al. [4], it was argued that topological interactions grant more robust cohesion than metric ones, and are therefore more effective from an anti-predatory point of view. In the present work, we test this hypothesis. To this end, we resort to numerical models of self-propelled particles (SPPs) [9] which have been extensively used in the last 20 years to study the emergence of order in polarized systems. Most of the past literature on flocking models was devoted either to characterize the onset of ordering [9,13–18], or to describe the features of the ordered phase [6–8,10,19–23]. Less attention was given to response and robustness to external perturbations, and to understand what determines at a microscopic level specific traits of the global behaviour. Besides, the greatest part of numerical analysis has been performed in two dimensions, dealing either with small finite groups or with fluids of SPPs.
However, to really understand what happens in real aggregations, we need to consider three-dimensional models and look at large finite groups of individuals. A few very recent works [24–28] implemented topological rules both in two- and three-dimensional models, but did not consider the question we want to address in this paper: what are the features of the microscopic interactions that grant robust cohesion to the group?
In the following, we focus on this issue. We consider a class of numerical models of SPPs in three-dimensions with different kinds of interactions, both metric and topological. We compare robustness of cohesions of the group under the effect of the noise and of external perturbations. Our analysis suggests that topological interactions perform better than metric ones, and that to achieve maximal stability, the topological interactions must be spatially balanced, distributing interacting neighbours evenly around each individual.
2. Summary of experimental results
The first empirically based results on the nature of the inter-individual interactions in flocks of birds were obtained in the last couple of years thanks to novel experimental and algorithmic techniques [29,30]. Stereoscopic experiments were performed in the field on flocks of starlings during aerial display above the roost. Three-dimensional positions and velocities of individual birds were reconstructed for flocks of up to a few thousands of individuals.
2.1. Topological interaction
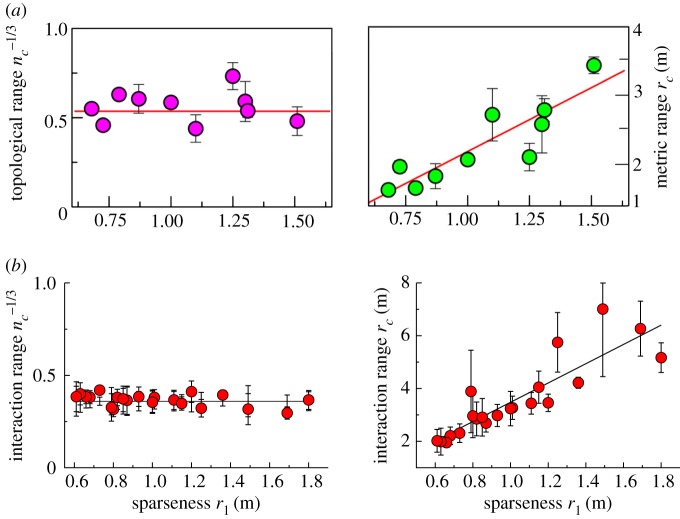
A first statistical analysis focused on positions, quantifying how individuals in a flock are mutually positioned in space [4]. It was discovered that the distribution of neighbours of a given bird is strongly anisotropic, closest neighbours being located significantly more on the sides than along the direction of motion. Using the degree of this anisotropy as a proxy of the interaction between individuals, it was discovered that interactions have a topological nature (figure 1): when considering flocks of different densities, the number of interacting neighbours does not display any dependence on the density. On the contrary, their metric distance depends strongly on the density; more precisely, the metric radius of interaction increases linearly with the mean nearest neighbour distance (called ‘sparseness’ in previous works; figure 1). This behaviour indicates that birds in a flock always interact with the same number of neighbours, independently of their distances. Further analysis of individual velocities using methods of statistical inference based on the maximum entropy approach [5], fully confirmed this conclusion (same figure). An estimate of the topological interaction range based on 22 flocking events [4,31] indicates that each bird interacts approximately with the 7±1.5 closest neighbours.
Figure 1.
Topological nature of the interaction. Topological range of interaction (left) and metric range of interaction (right) versus sparseness for several flocking events. (a) The topological (metric) interaction range was computed as the order of the neighbours (distance) above which the angular distribution of neighbours becomes isotropic (from Ballerini et al. [4]). (b) Topological and metric interaction ranges were computed starting from the empirical correlation functions of the velocity fluctuations and using the maximum entropy approach to infer interaction parameters from such correlations (from Bialek et al. [5]). (Online version in colour.)
Despite the fact that interactions are local, flocks are able to achieve strong coherence on a large scale. Correlations both in orientations and in speed are scale-free [32], implying that the range of influence of each individual is much larger than the interaction range, and it extends over the whole flock. In other terms, even if each bird only interacts with the seven closest neighbours, its change of behaviour can influence even the furthest individuals. The mechanism through which this information propagation occurs, from interaction link to interaction link through the whole network, has been elucidated in Bialek et al. [5]. Here, it was shown that mutual local alignment interactions between neighbours are sufficient to produce the velocity correlations that have been measured in natural flocks.
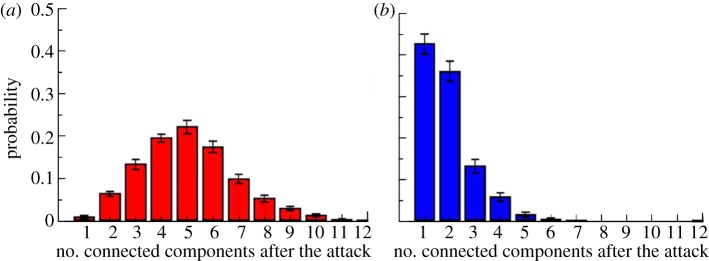
Local interactions with few neighbours are economic, and at the same time grant coherence at large scale. But why are interactions topological? What is the benefit of coordinating with the same number of individuals independently of their distance? And why is the number of interacting neighbours close to seven? First of all, we may note that estimating metric distances may be too costly for birds, especially during real time interaction. On the other hand, even topological interaction involves measuring distances, as the first nc neighbours are ranked in distance. Some discussion of these issues was provided in Ballerini et al. [4], where it was shown that topological interactions appear to be more robust than metric interactions in terms of cohesion of the group. Using some simple two-dimensional models of collective motion, two flocks, one with metric and the other with topological interactions, were prepared with the same initial conditions and then exposed to a predatory attack (modelled as a repulsive central force; see Ballerini et al. [4]). The topological flock exhibited a much stronger cohesion, giving rise to a lower number of subgroups and stragglers after the attack (figure 2).
Figure 2.
Cohesion in a two-dimensional numerical model: (a) metric versus (b) topological interactions. A numerical model of SPPs in two dimensions either with topological or with metric interactions was simulated to check for stability against perturbations. The histogram displays the probability that an initially cohesive and polarized flock fragments into a certain number of connected components (CCs) after a predatory attach (from Ballerini et al. [4]). (Online version in colour.)
These results suggest that topological interactions enhance robustness in cohesion, a crucial feature in the anti-predatory response of animal aggregations. To investigate this point further, however, a more systematic analysis is required. The numerical simulations described in Ballerini et al. [4] were performed in two dimensions and with a given set of parameters (in particular the number of interacting neighbours and the noise strength). Morever, the model used in the study of Ballerini et al. [4] did not have an attraction term in the equation, so that cohesion was somewhat difficult to assess. Natural flocks live in three dimensions, where cohesion is much more difficult to maintain owing to the larger number of degrees of freedom. Even if one expects topological interactions to outperform metric ones also in three dimensions, it is not a priori evident how strong in general this advantage in terms of robustness is. Moreover, it is not clear what is the role of the number of interacting neighbours and whether robust cohesive groups can be produced even with very small numbers of interacting neighbours. The remaining part of this paper is dedicated to investigate these questions. We will generalize the numerical analysis performed in Ballerini et al. [4] to a three-dimensional model with attraction, and systematically check for robustness in cohesion in both metric and topological models of self-organized collective motion.
2.2. Pair radial correlation function
Given the non-trivial mutual arrangements of individuals, with a strong anisotropy in the angular distribution of neighbours, one might wonder whether mutual distances also obey some specific non-trivial distributions. There are many example of birds that fly in formation, with regular distances between neighbours. This is not the case for starlings. In this respect, in contrast, flocks are rather structureless systems, with individuals continuously exchanging positions [33] and with a distribution of mutual distances lacking any structure. A good quantitative observable to pinpoint this behaviour is the so-called radial pair correlation function g(r), defined as the density of particles at distance r from a focal particle. More precisely, this function is defined in the following way,
 |
2.1 |
where δ(x) is Dirac's delta function. From the practical point of view, in order to compute the numerator in g(r), one counts how many pairs of points exist with mutual distance rij between r and r + dr, where dr is an arbitrary binning interval (see [34] for the details of the definition, and in particular for the crucial point of how to deal with the border).
The radial correlation function g(r) is a very useful tool for distinguishing different phases of matter, be it standard physical matter or active matter. In a crystal, g(r) has very sharp and pronounced peaks; in the liquid phase, g(r) has many smoother, but well-defined peaks, corresponding to the shells around each particle. On the other hand, in a gas the g(r) is rather structureless, only showing a drop at small r corresponding to the hard core of the particles that cannot get too close to each other.
The form of g(r) in real flocks of starlings is shown in figure 3 [34]. We clearly see that there is not much structure, very much like what one finds in a gas. This lack of structure may seem a rather unexciting result, but in fact it is important. As we shall see, we will use g(r) to fix the parameters of our simulations. This experimental constraint is not an easy one to match: it is very easy to get the radial correlation function wrong. Indeed, a possible way to enforce cohesion in a system of interacting particles is to introduce strong attraction between them. However, this leads to strong structures with crystalline or liquid-like g(r). This is not what real flocks do. Therefore, it seems that a ‘boring’ radial correlation function is a very non-trivial biological requirement that models have to match. Our aim in the present work was to investigate those features in the interaction that enhance cohesion and at the same time produce flocks with as featureless a radial correlation function as the natural ones.
Figure 3.
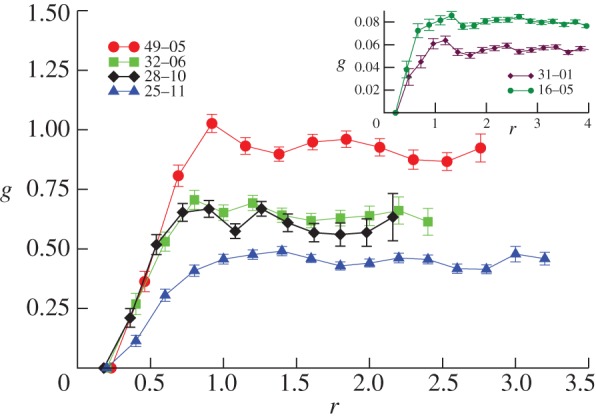
Radial correlation function in starling flocks. The only clear structure is the drop of probability at short r, owing to the fact that birds have a physical size, and so that they do not want to get too close to each other. In other words, there is a sort of hard-core repulsion. Reproduced from Cavagna et al. [34]. (Online version in colour.)
3. Numerical models of self-organized collective behaviour
Many models of collective motion have been investigated in the last 10 years, by biologists [6–8,10,19,], physicists [9,11,13,14,16–18,20,22,] and control theorists [35,36]. Here, we focus on a class of such models, known as SPP models [9,22,24]. The first and most renowned among them is the Vicsek model [9], where point particles with constant speed move based on mutual alignment with neighbours and subject to noise. If we characterize each particle by its position xi and velocity vi, then the dynamical equations of motion read as
 |
3.1 |
Here  is the normalization function
  ,
,  is the (constant) speed of the particles and
  is a random vector delta correlated in particle index and time and uniformly distributed in the unit spherical surface [37]. The parameter η tunes the amount of noise the particles are subject to. Finally, S(i) indicates the ensemble of the Ni interacting neighbours of particle i. In the original Vicsek model, S(i) is chosen following a metric rule: particle i interacts with all particles closer than a given metric interaction range rc.
Despite its minimal architecture, the Vicsek model exhibits non-trivial collective properties and gives rise, for low enough noise, to a polarized flow of moving particles. Still, when the volume available to the flockers increases (at fixed number of particles), even very small fluctuations can lead to flock dispersion and an initially ordered group soon dissolves in open space. In other terms, the Vicsek model is not able to produce finite polarized and cohesive aggregations of particles.
To overcome this problem, Grégoire et al. [22] introduced an extension of the Vicsek model, where an attraction–repulsion term is added to fix the density of the aggregation. The velocity updating is modified as
 |
3.2 |
where the parameters α and β tune the mutual relevance of alignment and attraction/repulsion, and the attraction–repulsion force is given by
 |
3.3 |
Here,  corresponds to the hard-core distance, re to the ideal equilibrium distance between particles, rc is the maximum interaction range and ra defines the distance beyond which
  becomes constant. The set of interacting neighbours S(i) is now defined as the set of Voronoi neighbours of bird i that are found within the range rc from bird i. In the study of Grégoire et al. [22], the authors fixed v0 = 0.05,
  ,
,  ,
,  (we will use the same values for these parameters throughout this paper).
A systematic analysis of the collective behaviour generated by equation (3.2) in two dimensions, together with a phase diagram, can be found in Grégoire et al. [22]. Contrary to the original Vicsek model, this model produces, for appropriate values of the parameters α, β and η, cohesive groups also in open space (i.e. in the zero density limit). It therefore seems a good candidate to investigate stability and robustness in group cohesion. There are however a few issues to be further considered. We note that, according to the previous definition, model (3.2) has a mixed metric–topological character. Indeed, when the maximum interaction radius rc is big enough with respect to the average distance between particles, the ensemble of interacting neighbours coincides with the first Voronoi shell, which is defined independently of mutual distances, i.e. topologically. When rc decreases, however, actual distances start to be relevant and interactions become truly metric. Besides, even when rc is large, the number of interacting neighbours is uniquely determined by the Voronoi tessellation (approx. 15 in three dimensions) and cannot be tuned.1 Since we want to investigate the link between microscopic interactions, and number and positions of interacting neighbours and degree of cohesion, we would like a model where we can switch in a neat way from metric to topological interactions and we can tune the number of interacting neighbours. Besides, keeping in mind natural flocks, we want to focus on particles moving in three dimensions, rather than in two dimensions.
For all these reasons, we have generalized the model of equation (3.2). We have considered this model in three dimensions and have introduced three variants, where the ensemble of interacting neighbours S(i) is chosen with a different set of rules.
— Metric interactions: in this case, as in the original Vicsek model, the set S(i) consists of all the neighbours of bird i that are found within a given metric range rc around i.
— Simple topological interactions: here the set S(i) consists of the first nc nearest neighbours of bird i, irrespective of their distances. The attraction–repulsion force has the same form as in equation (3.3), but we set
in equation (3.3) so that the force is applied to all—topologically selected—neighbours in S(i).
— Topological interactions with angular resolution: here interacting neighbours are chosen irrespective of their distances, but one requires that a minimal angular resolution μ exists between distinct neighbours in S(i). Given the bird i, when two (or more) of his neighbours fall within the same solid angle of width μ, only one of them is included in S(i) (figure 4). Note that fixing μ also fixes the average number of interacting neighbours
: small values of nc correspond to large values of μ and vice versa. However, compared with the simple topological case, neighbours are now chosen in a balanced way. For example, if μ is very large (of order
), typically only two neighbours are included in S(i). However, owing to the angular constraint, they are bound to be in opposite sides with respect to bird i, while for simple topological interactions they can be arbitrarily close in angle.
Figure 4.
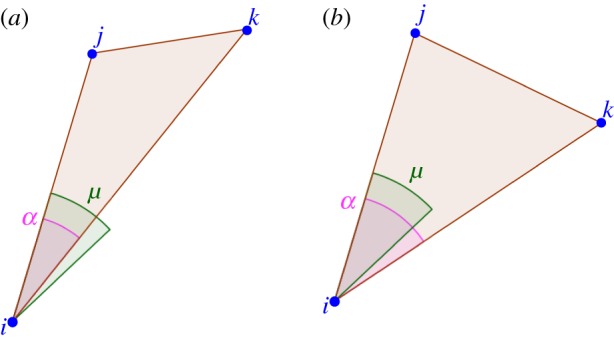
Topological model with angular resolution. The ensemble S(i) is defined in the following way. Let j and k be the first and second nearest neighbours of particle i( ,
,  ,
,  ). If we call μ a threshold parameter and α the angle
  , then i interacts only with j if
  (a), while it interacts with j
and
k if
  (b). This rule is iteratively applied to all the pairs of neighbours of i, choosing the nearest one every time that the angle between the particles is smaller than the threshold. The value of μ also fixes the average number of interacting neighbours
  . One can show that approximately
  . (Online version in colour.)
In the following, we will study numerically these three variants of the model and investigate their resilience to noise and perturbations. All numerical simulations were performed on a graphics processing unit using Compute Unified Device Architecture.
4. Results
Our primary objective is to study the stability, or resilience, of a flock against (i) noise and (ii) external perturbations, and to compare the three models introduced in the previous section according to such stability analysis. In order to make a comparison, though, we need to fix the parameters α, β and η. Moreover, we need to fix the parameter defining the interaction range, namely rc (metric), nc (topological) and μ (balanced). How can these parameters be fixed?
When comparing the resilience of different models to noise, η, we must of course use the same value of η in all three models, otherwise the comparison would be unfair. In this case, thus, we must use the same value also for all parameters other than noise. Concerning the range, this means fixing rc and μ such that the effective number of interacting neighbours, nc, is the same in all three models. This ‘equal parameters’ comparison is a neutral (and natural) path that we certainly must investigate.
However, using equal parameters is not the right thing to do when we test the stability against external perturbations. The three models are different, and therefore parameters with the same values may imply different biological observables. Hence, the second criterion we will adopt will be to use for each model a different set of parameters (a sort of optimal set) that ensures a realistic value of polarization and cohesion, and as realistic as possible a radial correlation function, g(r). Once this calibration to the biological observables is done, we will proceed with the comparison of the models' performance against external perturbation.
4.1. Stability against noise
Let us start by studying stability against noise in the equal parameters approach. We select the parameters in such a way to have an initially cohesive and moving flock (see figure 5 for the parameters' values). To assess stability, we let the system evolve following equation (3.2) and check the degree of cohesion after a given, large, number of simulation steps. Of course, how large this time T is rather arbitrary. However, given that we are adopting an equal parameters comparative approach, the important point is that this time be the same for all three models.
Figure 5.
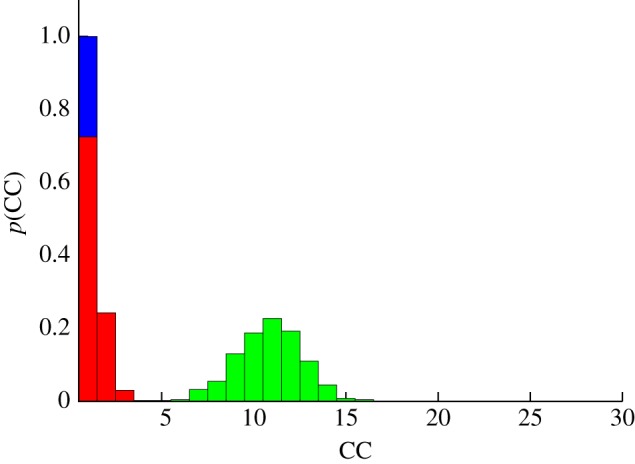
Stability against noise. Probability that a flock splits into M CCs after 5000 iterations, for the three variants of the model (metric, green bars; simple topological, red bars; and topological balanced, blue bars). An initially cohesive flock is left to evolve unperturbed according to equation (3.2). Owing to the presence of noise, the flock can spontaneously split giving rise to multiple sub-groups. nc = 22 for the simple topological model; rc = 0.72 (corresponding to  ) for the metric model; and μ = 0.411 (corresponding to
  ) for the topological balanced model. N = 512, α = 35, β = 5, η = 1. The other parameters are set as in Grégoire et al. [22] (v0 = 0.05,
  , re = 0.5, ra = 0.8). 400 distinct simulation runs are performed for each histogram. (Online version in colour.)
As a measure of cohesion, we use the number of CCs into which the initially cohesive flock spontaneously splits after time T. A CC is defined as a coherent group of particles that is found within a threshold of equal distance one from the other. A large number of CC implies low stability, and vice versa. Each experiment is repeated 400 times and averages are performed over all these runs.
Results are summarized in figure 5, where the histogram of the number of CC is displayed. As we can see from this figure, both topological models are more stable than the metric one, giving rise to a smaller number of sub-groups. However, we note that the simple topological model, despite performing better than the metric one, exhibits limited stability in terms of cohesion. Indeed, the mere presence of noise is by itself sufficient to break an initially cohesive group into independent components in the long run. On the contrary, the balanced topological model appears more robust, keeping cohesion and not breaking the group even after a very long time.
4.2. Stability against external perturbation
One possible objection at this point is that comparing the models at the same value of the parameters penalizes some models too much with respect to others. For example, it is well known that metric models can produce cohesive unperturbed flocks [10]. Hence, the result of figure 5, where the metric model loses cohesion with no external perturbation, may seem odd, or may be due to an unreasonable choice of the parameters.
It seems fairer to fix the parameters independently in each model in such a way to obtain the optimal performance and the most realistic phenomenology for that particular model, and to make the comparison of the three models only after such optimization. More specifically, we tune parameters in such a way to have the same (strong) polarization and cohesion in all models, and to match as better as possible other biological features, such as the radial correlation function. This is an ‘equal observables’ comparison.
We proceed as follows. First, for each model, we fix α and η (actually, their ratio) in such a way to have large polarization,  , which is a reasonable biological value (polarization is very large in real flocks, see Cavagna et al. [32]). Secondly, we fix the interaction range (nc in the topological case, rc in the metric case, and μ in the balanced case) such that cohesion is strong, that is the average number of (unperturbed) CCs is approximately 1. Once polarization and cohesion are granted, we finally try to optimize the last parameter, namely the attraction strength β, in such a way to have a biologically plausible radial correlation function, g(r), characterized by a clear drop at the small r hard-core, a weak bump in correspondence of the first shell of nearest neighbours and no other structure for larger r. When all parameters have been fixed in such a way to have biologically consistent observables, we can make a fair comparison of the stability under external perturbation.
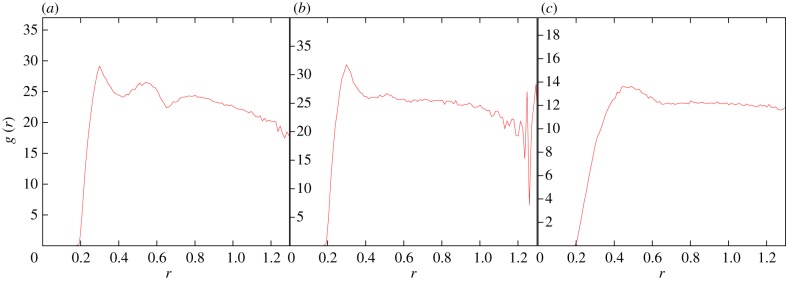
In figure 6, we report the radial correlation function g(r) in all three models, for those parameters that make this function as close as possible to the biological ones, figure 3. Even though the no model is too far from a biologically plausible g(r), we also see that in the metric case, the radial correlation function is not fully satisfying, as we cannot avoid getting excessive structure, in the form of a regular modulations, beyond the first shell of neighbours. Although this difference is not enormous, it is interesting to note that we were unable to eliminate such excessive structure and make the metric g(r) as biologically plausible as the topologically balanced one. If we try to do that by moving one of the parameters, we significantly decrease either cohesion or polarization, or both (we recall that Φ = 0.99 and  in all three models, for the parameters in figure 6).
Figure 6.
Radial correlation function g(r) for the three models at equal observables. For all three models, observables are polarization, Φ = 0.99; number of connected components,  . Parameters are the following. (a) Metric model: α = 35, β = 0.5, η = 0.25, rc = 0.65 (implying
  ). (b) Purely topological model: α = 35, β = 0.25, η = 0.25, nc = 20. (c) Topologically balanced model: α = 35, β = 0.06, η = 0.125, μ = 0.7 (implying
  ). (Online version in colour.)
Now that we have calibrated the models on the real biological observables, we can make a meaningful comparison of their resilience to an external perturbation. We perturb the flock by placing an obstacle along its initial direction of motion. As before, we take as a cohesion indicator the number of CCs in which the originally cohesive flock splits after encountering the obstacle. The results are presented in figure 7. We find that the stability of the topologically balanced model against external perturbation is significantly larger than the purely topological and metric model. The latter has quite a poor stability, compared with the two topological models. We remark that now we can no longer tune the parameters to enhance the stability of the models, as all parameters have been fixed by imposing the constraint on polarization, unperturbed cohesion and radial correlation function.
Figure 7.
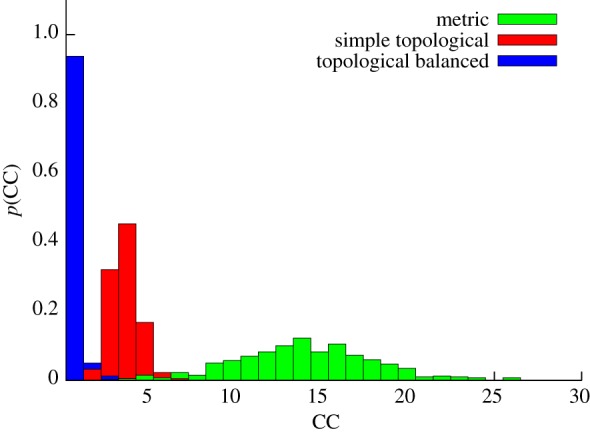
Stability against external perturbation. Probability that a flock splits into M CCs after a perturbation. An obstacle is placed in the direction of motion of the flock (in axis with its centre of mass) approximately at a distance of twice the flock radius. The obstacle is modelled as a sphere of radius 2. When a bird's distance from the obstacle is smaller than the sphere radius, it takes the opposite direction with respect to the obstacle, regardless of its neighbours. For all three models observables are polarization, Φ = 0.99; number of connected components,  Parameters are the following. Metric model: α = 35, β = 0.5, η = 0.25, rc = 0.65 (implying
  ). Purely topological model: α = 35, β = 0.25, η = 0.25, nc = 20. Topologically balanced model: α = 35, β = 0.06, η = 0.125, μ = 0.7 (implying
  ). (Online version in colour.)
We finally note that the values of the parameters at this optimal—‘equal observables’—point have some interest per se. In particular, let us make a comparison between the parameters of the metric and the topologically balanced case. In order to achieve unperturbed cohesion and high polarization, we need a number of interacting neighbours in the metric case that is twice as much than in the balanced case (nc = 21.2 versus nc = 8.8), and an attraction parameter which is larger by a factor 10 (β = 0.5 versus β = 0.06). Unsurprisingly, then, the metric g(r) is more structured than the topologically balanced one. This seems a key feature of topological interaction: it grants a good (unperturbed) cohesion even with a low strength attraction force, thus yielding a positionally structureless flock, similar to the real biological case. The second key advantage, as we have seen, is quite a good stability under external perturbation.
4.3. Geometric instabilities in the metric and purely topological model
The lower resilience of the metric and of the purely topological model described above are due to the presence of geometric instabilities. Such instabilities are different in nature in the two models, but both make the flock susceptible of fragmentation, although to a different quantitative degree, as we have seen. We can qualitatively understand the origin of these instabilities by looking at the sketch in figure 8. In the metric case (figure 8a), fluctuations caused by the noise term or by external perturbations may push one particle (or a few of them) beyond the metric range rc from its neighbours, making it lose interaction with the rest of the group; in this way, disconnected components may be created. We also note that in the metric case, the ‘evaporation’ of individual particles from the border is one of the main paths to losing stability, giving rise to the kind of histogram we have seen in figures 5 and 7.
Figure 8.

Instabilities in the metric and topological model. (a) In the metric model, if a flock is split into two groups whose distance is larger than the interaction range rc (red circle), then cohesion is definitively lost. (b) The simple topological model is stable against fluctuations in mutual distances; however, if the ncth nearest neighbour of each individual is in its own group (nc = 5 in the figure), then there cannot be interaction between the two groups, and cohesion is again lost. (c) The balanced topological model does not have this instability, because all particles (e.g. A and B in the figure) must have neighbours on the two sides. (Online version in colour.)
In the simple topological case, the evaporation of one single particle cannot occur, since each particle interacts by definition with its first nc neighbours, independently of their distance. However, what may happen in this case (figure 8b) is that a fluctuation instantaneously separates a sub-group of at least nc + 1 individuals from the rest of the flock: these individuals will interact among themselves but not with others, so that again the aggregation may split. Therefore, even though the simple topological model is not susceptible to the creation of isolated individuals, it may still lead to fragmentation of the flock into subgroups of size larger than nc. Such group separation is more rare a phenomenon than the single particle evaporation, though; for this reason, the topological stability is higher that the metric one.
It was exactly to solve this shortcoming of the purely topological interaction that we introduced a topological model with spatially balanced angular resolution (figure 8c). In such models, sub-groups are not allowed, owing to the angular threshold in the interactions that forces each particle to select interacting neighbours with evenly distributed angles. The simple topological rule, in contrast, does not take into account the spatial distribution of neighbours: if all the first nc neighbours of a given individual are on the same side, that individual will ignore completely individuals on the other side. In this way, as we have seen, sub-groups of size nc become stable and independent whenever they form owing to noise or external perturbations. All this is avoided in the spatially balanced model.
Note, finally, that when using the Voronoi rule to select neighbours [14,22,24], one is effectively running a topologically balanced interaction. The reason for this is that in the Voronoi construction, the ranking in distance of the neighbours is overruled by the topological requirement to have cells all around the focal point. Therefore, Voronoi neighbours are naturally distributed evenly in space around each point. As we discussed earlier, though, here we do not use a Voronoi rule because we want to be able to tune the number of interacting neighbours nc, while in Voronoi this number is fixed.
4.4. Filaments in the topologically balanced model
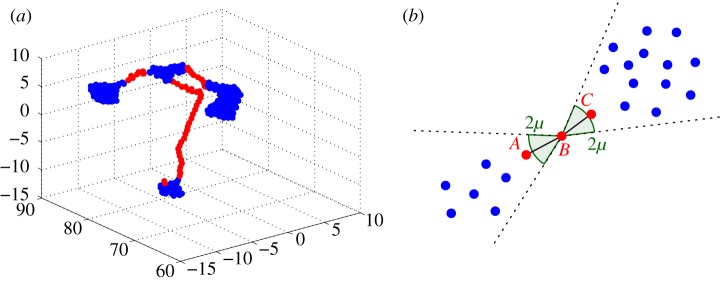
Even the balanced topological model exhibits, for low values of nc, a geometric instability, although of a weaker nature than the other models. Such instability consists of the formation of linear structures of particles (filaments) connecting sub-flocks moving in different directions. An example of such structures is shown in figure 9, where we present a snapshot from a simulation with a large value of μ (i.e. a small number of interacting neighbours). We note that filaments were also observed in the study of Grégoire & Chaté [14]. A possible mechanism for the formation of these filaments is displayed in the same figure. Even if the flock is, strictly speaking, connected, the sub-groups separated by the filaments have different polarizations and do not move coherently. It is therefore necessary to give a definition of stability that takes into account the formation of these structures. What is (if any) the minimal value of interacting neighbours nc such that filaments do not form and there is a unique, fully three-dimensional, coherently moving flock?
Figure 9.
(a) Snapshot of a simulation with high μ (low nc). Filaments of particles (in red) are formed that connect sub-flocks (in blue) with distinct polarization. (b) Filament formation mechanism. Particle B only interacts with A and C and satisfies the angular constraint. If μ is large enough, the blue particles on the two sides of B do not interact with it, because they belong to the same angular sectors of A and C and are therefore excluded by the angular resolution criterion. If a fluctuation brings A collinear to B, the same conditions holds also for A and the filament will increase its length. (Online version in colour.)
The minimum value of nc for which full stability (no filaments) is attained surely will depend on the value of the parameters. When the noise is low, cohesion can be achieved with a smaller number of interacting neighbours. Increasing the strength of the attraction force has the same effect. When exploring the parameter space, we must proceed as in the previous sections, namely enforce the constraint that simulated flocks must reproduce the same behaviour as that observed in natural groups (polarization and radial correlation function), so that not all combinations of parameters are equally sensible. Too strong an attraction term, or too low a noise, lead to crystalline flocks [14], where individuals occupy fixed mutual positions, while an important feature of real flocks is that individuals diffuse one with respect to the other [33] and that, as we have seen, the radial correlation function g(r) is definitely non-crystalline.
To investigate the minimal number of interacting neighbours, we calculate the fraction of particles belonging to filaments as a function of nc, for different values of the parameters and for two different sizes (figure 10).
Figure 10.
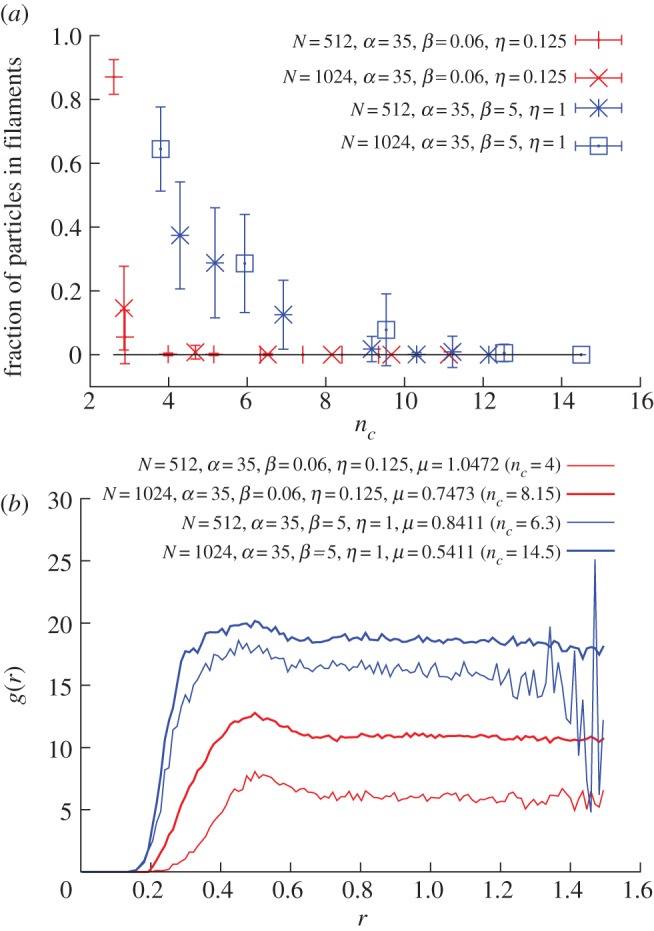
Topological balanced model. (a) Fraction of particles belonging to a filament after 15 000 iterations for different parameters and flock sizes (each point is an average over 50 simulation runs). To determine filaments and three-dimensional subgroups, we used the α-shape algorithm [30,38]. (b) The pair distribution function g(r) for the same data, approximatively reproducing what was found for real flocks in Cavagna et al. [34]. (Online version in colour.)
At the value of nc where this fraction is zero, the flock becomes fully cohesive and no linear structures arise, and so this is the minimal nc we are looking for. We varied the parameters and the size in such a way to have the maximal spread in the minimal nc. From figure 10a, we can see that cohesive and stable flocks can be obtained with a number of interacting neighbours between 5 and 10, not far from the value of nc estimated from experimental data [4]. As a consistency check, we calculated the radial correlation function at these values of the parameters: we see from figure 10b that we get a g(r) very similar to the biological one.
5. Discussion
Empirical data on large, natural flocks of starlings in the field revealed that interactions between birds in a flock are topological, each individual interacting with a fixed number of neighbours, independently of their metric distances. It is also possible that other animals performing collective motion, such as some fish species, and even pedestrians [39], use a topological interaction. We can therefore ask what are the advantages, in terms of collective behaviour, of a topological interaction. The idea put forward in Ballerini et al. [4] is that topological interaction grants a more robust cohesion of the group. In this paper, we have tested this hypothesis by comparing metric and topological interactions in a three-dimensional model of self-organized collective behaviour.
Our analysis confirms that topological interactions perform better than metric ones. The problem with metric interaction is that individuals can easily drop out of the interaction range, hence losing contact with the rest of the group. However, even the purely topological model is unstable with respect to fragmentation into sub-groups of size nc. The only way to respond to such instabilities, for both metric and purely topological models, is to increase the number of interacting neighbours, which may lead to flocks that are cohesive but with too strong a structure compared with the real ones. The radial correlation function, which has been measured in real flocks, is the main tool we used to check particles' positional structure within the flock.
On the other hand, we found that using a topological rule that is balanced in space, where neighbours are selected topologically, but at the same time they are evenly distributed in angle, it is possible to achieve robust cohesion also with a small number of interacting neighbours, still preserving a realistic structure for the flock, namely a realistic g(r). When we fix parameters independently in each model in such a way that all three models have realistic polarization and structure, and high unperturbed cohesion, it turns out that the topologically balanced mode has the highest stability against external perturbation.
When interacting neighbours are selected by using Voronoi tessellation (as done in Grégoire et al. [14] and Chaté et al. [15]), one is enforcing a topological rule that is automatically balanced in space. Indeed, in the Voronoi case, the angular resolution between neighbours is determined by the Delaunay triangulation, whose net effect in terms of spatial balancing of the neighbours is not dissimilar from what we have done here. The number of Voronoi neighbours in three dimensions is  . Hence, according to our results here, the Voronoi rule must produce full cohesive flocks (figure 10), which is indeed what has been found in numerical simulations [14,27]. We checked explicitly that selecting Voronoi neighbours is equivalent to choosing an angular threshold μ such that
  .
.
In order to produce cohesive groups in open space, models need an attraction term in the equation of motion [6,8,10,11,22]. Clearly, the stronger this force, the more robust the cohesion is. However, there is a downside to this: when attraction becomes too strong, the pair correlation function g(r) becomes too structured, developing several peaks, similar to a normal liquid, or, worse, to a crystal, whereas it has been shown that flocks have a nearly structureless, almost gas-like, g(r). Hence, attraction cannot be increased indefinitely to grant better cohesion. Our results show that if neighbours are chosen according to a topologically balanced rule, cohesion can be enhanced without the need of an overly strong attraction force, which introduces spurious structure in the flock, and with a number of interacting neighbours,  , consistent with previous experimental estimates.
Understanding under what conditions a finite aggregation of interacting individuals retains a polarized cohesive structure is a fundamental issue both for biological groups and for artificial systems. In this work, we focused on one aspect of the problem, namely cohesion, and investigated how selection of neighbours determines robustness and stability of cohesion against noise and perturbations. Another issue concerns polarization: one can ask whether some specific values of nc might grant optimal robustness to global ordering of the group. Work in this direction indicates that this is indeed the case (G. Young, L. Scardovi, A. Cavagna, I. Giardina & N. Leonard 2012, unpublished data).
Acknowledgements
This work was supported in part by grants IIT–Seed Artswarm, ERC–StG n.257126 and AFOSR–Z80910.
Footnotes
In fact, when using Voronoi cells, one could introduce an ‘interaction rate’, in which each particle interacts with a Voronoi neighbour with a certain probability. One could then use this probability as a tuning parameter, in place of the number of interacting neighbours nc.
References
- 1.Krause J., Ruxton G. D. 2002. Living in groups. Oxford, UK: Oxford University Press. [Google Scholar]
- 2.Camazine S., Deneubourg J.-L., Franks N. R., Sneyd J., Theraulaz G., Bonabeau E. 2003. Self-organization in biological systems. Princeton, NJ: Princeton University Press. [Google Scholar]
- 3.Couzin I. D., Krause J. 2003. Self-organization and collective behavior in vertebrates. Adv. Study Behav. 32, 1–75. 10.1016/S0065-3454(03)01001-5 ( 10.1016/S0065-3454(03)01001-5) [DOI] [Google Scholar]
- 4.Ballerini M., et al. 2008. Interaction ruling animal collective behavior depends on topological rather than metric distance: evidence from a field study. Proc. Natl Acad. Sci. USA 105, 1232–1237. 10.1073/pnas.0711437105 ( 10.1073/pnas.0711437105) [DOI] [PMC free article] [PubMed] [Google Scholar]
- 5.Bialek W., Cavagna A., Giardina I., Mora T., Silvestri E., Viale M., Walczak A. M. 2012. Statistical mechanics for natural flocks of birds. Proc. Natl Acad. Sci. USA 109, 4786–4791. 10.1073/pnas.1118633109 ( 10.1073/pnas.1118633109) [DOI] [PMC free article] [PubMed] [Google Scholar]
- 6.Aoki I. 1982. A simulation study on the schooling mechanism in fish. Bull. Jpn. Soc. Sci. Fish 48, 1081–1088. 10.2331/suisan.48.1081 ( 10.2331/suisan.48.1081) [DOI] [Google Scholar]
- 7.Reynolds C. W. 1987. Flocks, herds and schools: a distributed behavioral model. SIGGRAPH Comput. Graph. 21, 25–34. 10.1145/37402.37406 ( 10.1145/37402.37406) [DOI] [Google Scholar]
- 8.Huth A., Wissel C. 1992. The simulation of the movement of fish schools. J. Theor. Biol. 156, 365–385. 10.1016/S0022-5193(05)80681-2 ( 10.1016/S0022-5193(05)80681-2) [DOI] [Google Scholar]
- 9.Vicsek T., Czirók A., Ben-Jacob E., Cohen I., Shochet O. 1995. Novel type of phase transition in a system of self-driven particles. Phys. Rev. Lett. 75, 1226–1229. 10.1103/PhysRevLett.75.1226 ( 10.1103/PhysRevLett.75.1226) [DOI] [PubMed] [Google Scholar]
- 10.Couzin I. D., Krause J., James R., Ruxton G. D., Franks N. R. 2002. Collective memory and spatial sorting in animal groups. J. Theor. Biol. 218, 1–11. 10.1006/jtbi.2002.3065 ( 10.1006/jtbi.2002.3065) [DOI] [PubMed] [Google Scholar]
- 11.D'Orsogna M. R., Chuang Y. L., Bertozzi A. L., Chayes L. S. 2006. Self-propelled particles with soft-core interactions: patterns, stability, and collapse. Phys. Rev. Lett. 96, 104302. 10.1103/PhysRevLett.96.104302 ( 10.1103/PhysRevLett.96.104302) [DOI] [PubMed] [Google Scholar]
- 12.Giardina I. 2008. Collective behavior in animal groups: theoretical models and empirical studies. HFSP J. 2, 205–219. 10.2976/1.2961038 ( 10.2976/1.2961038) [DOI] [PMC free article] [PubMed] [Google Scholar]
- 13.Czirók A., Stanley H. E., Vicsek T. 1997. Spontaneously ordered motion of self-propelled particles. J. Phys. A: Math. Gen. 30, 1375. 10.1088/0305-4470/30/5/009 ( 10.1088/0305-4470/30/5/009) [DOI] [Google Scholar]
- 14.Grégoire G., Chaté H. 2004. Onset of collective and cohesive motion. Phys. Rev. Lett. 92, 025702. 10.1103/PhysRevLett.92.025702 ( 10.1103/PhysRevLett.92.025702) [DOI] [PubMed] [Google Scholar]
- 15.Chaté H., Ginelli F., Grégoire G., Peruani F., Raynaud F. 2008. Modeling collective motion: variations on the Vicsek model. Eur. Phys. J. B 64, 451–456 ( 10.1140/epjb/e2008-00275-9) [DOI] [Google Scholar]
- 16.Huepe C., Aldana M. 2004. Intermittency and clustering in a system of self-driven particles. Phys. Rev. Lett. 92, 168701. 10.1103/PhysRevLett.92.168701 ( 10.1103/PhysRevLett.92.168701) [DOI] [PubMed] [Google Scholar]
- 17.Aldana M., Dossetti V., Huepe C., Kenkre V. M., Larralde H. 2007. Phase transitions in systems of self-propelled agents and related network models. Phys. Rev. Lett. 98, 095702. 10.1103/PhysRevLett.98.095702 ( 10.1103/PhysRevLett.98.095702) [DOI] [PubMed] [Google Scholar]
- 18.Gönci B., Nagy M., Vicsek T. 2008. Phase transition in the scalar noise model of collective motion in three dimensions. Eur. Phys. J. Special Topics 157, 53–59. 10.1140/epjst/e2008-00630-2 ( 10.1140/epjst/e2008-00630-2) [DOI] [Google Scholar]
- 19.Warburton K., Lazarus J. 1991. Tendency-distance models of social cohesion in animal groups. J. Theor. Biol. 150, 473–488. 10.1016/S0022-5193(05)80441-2 ( 10.1016/S0022-5193(05)80441-2) [DOI] [PubMed] [Google Scholar]
- 20.Toner J., Tu Y. 1995. Long-range order in a two-dimensional dynamical XY model: how birds fly together. Phys. Rev. Lett. 75, 4326–4329. 10.1103/PhysRevLett.75.4326 ( 10.1103/PhysRevLett.75.4326) [DOI] [PubMed] [Google Scholar]
- 21.Toner J., Tu Y. 1998. Flocks, herds, and schools: a quantitative theory of flocking. Phys. Rev. E 58, 4828–4858. 10.1103/PhysRevE.58.4828 ( 10.1103/PhysRevE.58.4828) [DOI] [Google Scholar]
- 22.Grégoire G., Chaté H., Tu Y. 2003. Moving and staying together without a leader. Physica D 181, 157–170. 10.1016/S0167-2789(03)00102-7 ( 10.1016/S0167-2789(03)00102-7) [DOI] [Google Scholar]
- 23.Gautrais J., Jost C., Soria M., Campo A., Motsch S., Fournier R., Blanco S., Theraulaz G. 2009. Analyzing fish movement as a persistent turning walker. J. Math. Biol. 58, 429–445. 10.1007/s00285-008-0198-7 ( 10.1007/s00285-008-0198-7) [DOI] [PubMed] [Google Scholar]
- 24.Ginelli F., Chaté H. 2010. Relevance of metric-free interactions in flocking phenomena. Phys. Rev. Lett. 105, 168103. 10.1103/PhysRevLett.105.168103 ( 10.1103/PhysRevLett.105.168103) [DOI] [PubMed] [Google Scholar]
- 25.Hildenbrandt H., Carere C., Hemelrijk C. 2010. Self-organized aerial displays of thousands of starlings: a model. Behav. Ecol. 21, 1349–1359. 10.1093/beheco/arq149 ( 10.1093/beheco/arq149) [DOI] [Google Scholar]
- 26.Charlotte K., Hemelrijk H. H. 2011. Some causes of the variable shape of flocks of birds. PLoS ONE 6, e22479. 10.1371/journal.pone.0022479 ( 10.1371/journal.pone.0022479) [DOI] [PMC free article] [PubMed] [Google Scholar]
- 27.Raynaud F. 2009. Modèles de comportements collectifs tri-dimensionnels. PhD thesis, Universitè Denis Diderot, Paris. [Google Scholar]
- 28.Bode N. W. F., Franks D. W., Wood A. J. 2010. Limited interactions in flocks: relating model simulations to empirical data. J. R. Soc. Interface 55, 301–304. 10.1098/rsif.2010.0397 ( 10.1098/rsif.2010.0397) [DOI] [PMC free article] [PubMed] [Google Scholar]
- 29.Cavagna A., Giardina I., Orlandi A., Parisi G., Procaccini A., Viale M., Zdravkovic V. 2008. The starflag handbook on collective animal behaviour. I. Empirical methods. Anim. Behav. 76, 217–236. 10.1016/j.anbehav.2008.02.002 ( 10.1016/j.anbehav.2008.02.002) [DOI] [Google Scholar]
- 30.Cavagna A., Giardina I., Orlandi A., Parisi G., Procaccini A. 2008. The starflag handbook on collective animal behaviour. II. three-dimensional analysis. Anim. Behav. 76, 237–248. 10.1016/j.anbehav.2008.02.003 ( 10.1016/j.anbehav.2008.02.003) [DOI] [Google Scholar]
- 31.Cavagna A., Cimarelli A., Giardina I., Parisi G., Santagati R., Stefanini F., Tavarone R. 2010. From empirical data to inter-individual interactions: unveiling the rules of collective animal behavior. Math Models Methods Appl Sci 20, 1491–1510. 10.1142/S0218202510004660 ( 10.1142/S0218202510004660) [DOI] [Google Scholar]
- 32.Cavagna A., Cimarelli A., Giardina I., Parisi G., Santagati R., Stefanini F., Viale M. 2010. Scale-free correlations in starling flocks. Proc. Natl Acad. Sci. USA 107, 11 865–11 870. 10.1073/pnas.1005766107 ( 10.1073/pnas.1005766107) [DOI] [PMC free article] [PubMed] [Google Scholar]
- 33.Cavagna A, Duarte Queiros S. M., Giardina I., Stefanini F., Viale M. 2012. [DOI] [PMC free article] [PubMed] [Google Scholar]
- 34.Cavagna A., Cimarelli A., Giardina I., Orlandi A., Parisi G., Procaccini A., Santagati R., Stefanini F. 2008. New statistical tools for analyzing the structure of animal groups. Math. Biosc. 214, 32–37. 10.1016/j.mbs.2008.05.006 ( 10.1016/j.mbs.2008.05.006) [DOI] [PubMed] [Google Scholar]
- 35.Jadbabaie A., Lin J., Morse A. S. 2003. Coordination of groups of mobile autonomous agents using nearest neighbor rules. IEEE Trans. Automatic Control 48, 988–1001. 10.1109/TAC.2003.812781 ( 10.1109/TAC.2003.812781) [DOI] [Google Scholar]
- 36.Tanner H. G., Jadbabaie A., Pappas G. J. 2007. Flocking in fixed and switching networks. IEEE Trans. Automatic Control 52, 863–868. 10.1109/TAC.2007.895948 ( 10.1109/TAC.2007.895948) [DOI] [Google Scholar]
- 37.Vicsek T., Vicsek M., Czirók A. 1999. Collective motion of organisms in three dimensions. Physica A 264, 299–304. 10.1016/j.bbr.2011.03.031 ( 10.1016/j.bbr.2011.03.031) [DOI] [Google Scholar]
- 38.Edelsbrunner H., MÃcke E. P. 1994. Three-dimensional alpha shapes. ACM Trans. Graph. 13, 43–72. 10.1145/174462.156635 ( 10.1145/174462.156635) [DOI] [Google Scholar]
- 39.Moussaïd M., Helbing D., Theraulaz G. 2011. How simple rules determine pedestrian behavior and crowd disasters. Proc. Natl Acad. Sci. USA 108, 6884–6888. 10.1073/pnas.1016507108 ( 10.1073/pnas.1016507108) [DOI] [PMC free article] [PubMed] [Google Scholar]


