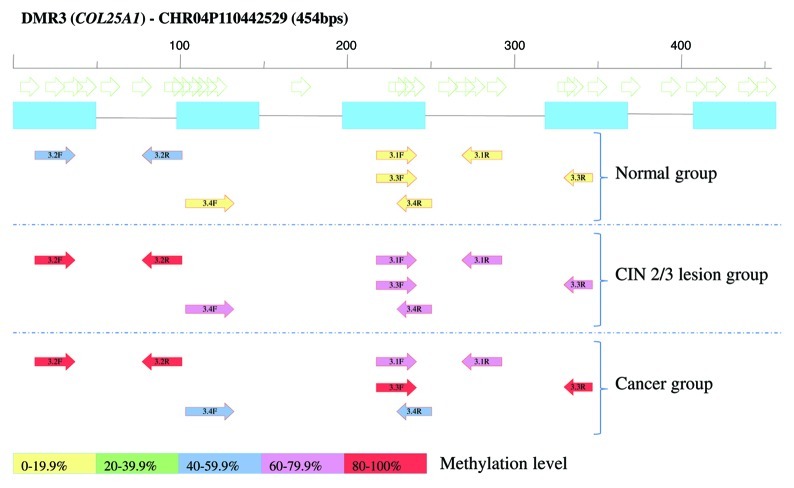
Figure 3. Schematic figure of MSP design of the selected hypermethylated DMR3 (COL25A1). Methylation frequency in all samples used for MSP validation is included. Open arrows are representing CpG dinucleotides, blue boxes are probes on Nimblegen array. Colored arrows show the observed methylation frequency of designed primers.

An official website of the United States government
Here's how you know
Official websites use .gov
A
.gov website belongs to an official
government organization in the United States.
Secure .gov websites use HTTPS
A lock (
) or https:// means you've safely
connected to the .gov website. Share sensitive
information only on official, secure websites.
