

Abstract
The purpose of the present study was to determine the tissue and plasma levels of microRNA (miR)-155 and miR-31 in 67 patients with invasive intraductal breast cancer and their correlation with the clinicopathological characteristics. Using a quantitative real-time-PCR (qRT-PCR) assay, it was demonstrated that the plasma levels of miR-155 and miR-31 in patients were 6- and 5-fold higher than those in healthy individuals, respectively (P<0.05). In cancerous tissues, miR-155 expression levels were 5-fold higher compared with those in non-cancerous tissues (P<0.05), whereas no difference was observed with miR-31 expression (P>0.05). The expression levels of miR-155, but not miR-31, were inversely correlated with estrogen receptor (ER) and progesterone receptor (PR) expression (ER, r=−0.353, P=0.003; PR, r=−0.357, P=0.003). The tissue and plasma levels of miR-155 and miR-31 were not correlated with epidermal growth factor receptor-2 (HER-2) expression levels. Furthermore, high levels of plasma miR-155 and miR-31 were identified in the tumors of TNM stage II, lymph node metastasis 0–3 and tumor sizes of 2–5 cm in patients who were aged over 52 years. miR-155 was mainly expressed in patients with a pathology score of 3 for ER or PR expression; miR-31 expression was higher in patients with a pathology score of 2. These results suggest that miR-155 and miR-31 are differentially expressed in breast cancer patients. Their correlation with the clinicopathological characteristics may aid the diagnosis and treatment of invasive intraductal breast cancer.
Keywords: mir-155, mir-31, real-time PCR, breast cancer, estrogen receptor, progesterone receptor
Introduction
Breast cancer is the most frequently diagnosed cancer and is the leading cause of cancer-related mortality in females (1). Generally, the incidence and mortality of breast cancer is subject to international variations, which are largely attributed to the differences in reproductive and hormonal factors and the availability of early detection services (1,2). Currently, one of the major obstacles of breast cancer management is the lack of sensitive and specific biomarkers that facilitate the early detection and allow the monitoring of cancer progression and treatment response (3,4). Currently, only two markers are well-established and routinely used in the evaluation of breast cancer: the estrogen receptor (ER), which predicts the response to endocrine therapy, and the epidermal growth factor receptor-2 (HER-2/neu), which predicts the response to Trastuzumab (5). However, the variant expression and the low sensitivities of the detection of ER and HER-2/neu restrict their use as prognostic predictors. Great efforts have been made to find new putative markers in the management of breast cancer.
MicroRNAs (miRNAs) are small, single-stranded, non-coding RNAs of 19–24 nucleotides in length (6) with highly conserved sequences in the context of their natural evolvement. miRNAs simultaneously regulate the expression of multiple genes at the post-transcriptional level. miRNAs inhibit mRNA translation and promote degradation via the base pairing of semi-complementary sequences within the 3′-untranslated region (3-UTR) of target mRNAs (6,7). Over previous years, miRNAs have been demonstrated to be involved in the regulation of a wide spectrum of biological processes, including cellular proliferation, apoptosis, development, differentiation and metabolism (8,9). A variety of miRNAs have been identified with altered expression in various types of human cancer (9,10). Bioinformatic analysis has indicated that each miRNA is capable of controlling a number of target genes, underscoring the potential effect of miRNAs on almost every genetic pathway (7,10). An ‘miRNA signature’ reflecting the common characteristics of miRNA dysregulation in human tumors has emerged from miRNA microarray analyses of more than 1,000 types of primary tumors. miRNA profiling has shown that almost every type of cancer exhibits a significantly different miRNA profile than its normal counterpart tissue, suggesting the importance of dysregulated miRNAs in human tumors (6).
In breast cancer, dysregulated miRNA may have the potential to be used as a prognostic tool (11,12). Among a wide spectrum of miRNAs, miR-155 is markedly overexpressed in breast cancer tissues and is one of the most potent miRNA suppressors of apoptosis in breast cancer cells (13). miR-155 may decrease the expression of tumor protein p53-induced nuclear protein 1 (TP53INP1) and thus attenuate TP53INP1-induced cell cycle arrest and apoptosis (14). miR-155 also contributes to oncogenicity in several other types of cancer (15,16).
miR-31 has been identified as an inhibitor of multiple steps of the invasion-metastasis cascade in breast cancer (17,18). More than 200 mRNAs are predicted to be regulated by miR-31. Gene ontology has revealed that these targets include a disproportionately large number of genes encoding proteins involved in motility-related processes, including cell adhesion, cytoskeletal remodeling and cell polarity (18,19). It has been previously reported that miR-31 plasma levels may be used as a diagnostic marker for oral squamous cell carcinoma (20). However, the significance of miR-31 as a prognostic predictor for breast cancer has not yet been evaluated. The correlation between miR-31 and any other clinicopathological parameters of breast cancer remains obscure.
A noteworthy property of miRNA is its evident stability (9,21,22). miRNA is well-preserved in tissue samples, even several years after formalin-fixation and paraffin embedment and is efficiently extracted from and quantified in such specimens. Cancer-specific miRNAs in the circulation are an emerging and exciting field in cancer research (23). Their unique stability and resilience make it possible for miRNAs to be present in the circulation of cancer patients, therefore circulating miRNAs have been explored as novel biomarkers for various types of adult cancer (24). If this strategy holds true for breast cancer, it would bring us closer to the development of novel, sensitive and noninvasive biomarkers for this common disease.
The current study determined the expression of miR-155 and miR-31 in breast cancer tissues and their matched adjacent normal tissues from 67 patients with stage I–III breast cancer. The plasma levels of miR-135 and miR-31 in these patients, compared with those in 70 age- and gender-matched healthy adults as controls, were analyzed. This study further sought to investigate whether the tissue expression and plasma levels of miR-135 and miR-31 correlated with the clinicopathological characteristics of these breast cancer patients.
Materials and methods
Patients and tissue samples
Anonymous cancerous and paired noncancerous tissues from patients with pathologically confirmed breast cancer were acquired from the Tissue Bank at the Cancer Hospital of Zhengzhou University (Zhengzhou, China). These patients attended the Cancer Hospital betweem September 2009 and September 2010. The following inclusion criteria were employed: i) the patient had received no radiotherapy or chemotherapy prior to surgery; ii) the patient had pathological stage I–III breast cancer according to the American Joint Committee on Cancer (AJCC) system. All samples were obtained from patients who had undergone radical resections and samples from normal mammary gland tissue were harvested at a distance of ≥5 cm from the incisional margin as controls. All samples were well-preserved in liquid nitrogen until total RNA of the samples was extracted. In addition, blood samples were collected from all 67 patients prior to surgery. A total of 70 healthy adults served as controls for plasma analysis. Whole blood (5 ml) was collected from each subject in an anticoagulant EDTA tube and then centrifuged at 3000 rpm at 4°C for 5 min. Following centrifugation, the supernatant was harvested and stored at −80°C until required. Acquisition of the tissue specimens was approved by the local Institutional Review Board and all subjects provided written informed consent for donating the blood samples.
Total RNA extraction and quantitative real-time-PCR (qRT-PCR) analysis
Total cellular or plasma RNA, including miRNA, was isolated from tissues or plasma samples using the Recover All™ Total Nucleic Acid Isolation kit (Invitrogen, Beijing, China) according to the manufacturer’s instructions. Complementary DNA (cDNA) was reverse transcribed from total cellular RNA using specific miRNA primers from PrimeScript™ RT reagent kit and TaqMan® MicroRNA Reverse Transcription kit (Takara Bio, Inc., Shiga, Japan). The reverse transcriptase reactions were run in a 20-μl volume containing 20 ng RNA at 16°C for 30 min, 42°C for 30 min and 85°C for 5 min. The products were then kept at 4°C.
The expression levels of miRNAs were quantified using a two-step RT-PCR method. The PCR primer pairs for miR-31 and miR-155 were obtained from Invitrogen (Carlsbad, CA, USA) with the following sequence: miR-31, 5′-AGGCAAGAT GCTGGCATAGCT-3′ (sense) and miR-155, 5′-TTAATGCTA ATCGTGATAGGGGT-3′ (sense). For tissue samples, RUNU6B (sense: 5′-GCGAGCACAGAATTAATACGAC-3′) was used as a control to normalize the expression level of miRNAs by correcting the differences of the cDNA template amount for the quantitative PCR. For plasma samples, 18S ribosomal RNA (rRNA; sense: 5′-GGATGAGCCTACAAC TGGCTT-3′) was used as a control to normalize the expression level of target miRNAs. qRT-PCR was performed using the SYBR® Premix Ex Taq™ PCR kit (Takara Bio, Inc.). RT-PCR was run at 95°C for 10 min followed by 50 cycles of 15 sec at 95°C and 1 min at 60°C. All reactions were run in triplicate using the ABI 7900 HT Fast Real-Time PCR System with SDS software (version 2.3; Applied Biosystems China, Beijing, China) and the average threshold cycle number (Ct) of each miRNA was analyzed with the RQ Manager software (Version 1.2, Applied Biosystems China).
The 2−ΔCt method was used for analysis. The ΔCt value is the difference between the Ct value of the specific miRNA and the Ct value of control, ΔCt = Ct(miRNA)–Ct(RUNU6B/18S rRNA). The value of ΔCt represents the miRNA expression level or content of each sample. The value of 2−ΔCt represents the relative quotient (RQ) of the expression of the target gene to that of the control gene. The value of miRNA expression is shown as mean ± SD. In the present study, the value of RQ represents the ratio of miRNA expression in target samples to that in control samples. An RQ<1 indicated that the expression levels of miRNA in the target samples were lower than those in the control samples. Conversely, an RQ>1 indicated higher miRNA expression in target samples.
Immunohistochemistry
Frozen primary tumor samples were paraffin-embedded and sliced into 4-μm thick sections. The tissue sections were immunohistochemically stained by the Envision method using primary monoclonal antibodies against the ER, progesterone receptor (PR) and HER-2 (Novocastra™, Newcastle upon Tyne, UK). Positively archived tissue sections were used as positive controls for each antibody. In negative controls, the primary antibodies were substituted by phosphate-buffered saline. H-scores were derived by manual assessment of the intensity (scored 0–3) and the percentage (%) of ER- and PR-positive tumor cells in 10 high-powered fields of the same section. Sections were scored by two experienced investigators who were blinded to the clinicopathological and molecular variables of the patients. The two measurements were multiplied to give an H-score varying from 0 to 300. In all areas, only malignant cells with scores of ≥50 were considered positive for either receptor. The DAKO scoring system was used for the examination of the HER-2 status. A score of 0 or 1+ was considered negative and a score of 3+ was considered positive for Her2. A score of 2+ was identified by the FISH (fluorescence in situ hybridization) test, if FISH+ was considered positive, FISH- was considered negative.
Statistical analysis
The data are expressed as mean ± SD and were analyzed with the SPSS software (Version 17.0; SPSS Inc., Chicago, IL, USA). The paired sample t test was applied to compare the amount of miRNA. Pearson’s and Spearman’s rank tests were applied to analyze the correlation of values of the miRNA. The Mann-Whitney U test and Kruskal-Wallis test were used to evaluate the correlation between miRNA expression and the clinicopathological parameters. P<0.05 was considered to indicate statistically significant differences.
Results
Clinicopathological characteristics
A total of 67 patients met the inclusion criteria and were selected for this study. The clinicopathological characteristics of the breast cancer patients are shown in Table I. Their median age was 67 years (range, 32–74) and 53.7% (36/67) were >52 years of age. The majority of the patients had grade II (89.6%) and TNM stage II (68.7%) disease and tumor size 2–5 cm (86.6%). The expression levels of ER and PR were 77.6 and 83%, respectively. The majority of the patients were HER-2 negative (73.1%).
Table I.
Expression of miR-155 and miR-31 in the tissues of 67 breast cancer patients.
| Clinicopathological characteristics | RNA samples n (%) | miR-155 (mean ± SD) | miR-31 (mean ± SD) |
|---|---|---|---|
| Age (years) | |||
| ≥52 | 36 (53.7) | 0.1510±0.0035 | 0.02737±0.02097 |
| <52 | 31 (46.3) | 0.0076±0.0013 | 0.0032±0.0004 |
| Differentiation grade | |||
| I | 0 (0.0) | ||
| II | 60 (89.6) | 0.01167±0.0023 | 0.01799±0.01304 |
| III | 7 (10.4) | 0.0111±0.0024 | 0.0053±0.00174 |
| TNM stage | |||
| I | 3 (4.5) | 0.0071±0.005 | 0.00281±0.00159 |
| II | 46 (68.7) | 0.01315±0.0029 | 0.02187±0.01643 |
| III | 18 (26.9) | 0.0084±0.00143 | 0.00383±0.00078 |
| Lymph node metastasis | |||
| 0 | 31 (46.3) | 0.01285±0.004 | 0.029±0.0244 |
| ≤3 | 19 (28.4) | 0.0122±0.0023 | 0.0063±0.0019 |
| >3 | 17 (25.3) | 0.0087±0.0015 | 0.0039±0.0008 |
| Tumor size (cm) | |||
| ≤2 | 3 (4.5) | 0.0067±0.0008 | 0.00312±0.0002 |
| 2–5 | 58 (86.6) | 0.01541±0.005 | 0.0221±0.0044 |
| >5 | 6 (8.9) | 0.0071±0.0004 | 0.0041±0.0007 |
| ER | |||
| − | 27 (40.3) | 0.01852±0.0045 | 0.00487±0.0009 |
| + | 25 (37.3) | 0.00586±0.0010 | 0.00482±0.00141 |
| ++ | 10 (14.9) | 0.00786±0.0029 | 0.08035±0.0755 |
| +++ | 5 (7.5) | 0.01057±0.0053 | 0.00565±0.00323 |
| PR | |||
| − | 34 (50.7) | 0.0163±0.00364 | 0.00413±0.0007 |
| + | 23 (32.3) | 0.0060±0.0010 | 0.00516±0.0015 |
| ++ | 5 (8.5) | 0.0064±0.0053 | 0.1592±0.1502 |
| +++ | 5 (8.5) | 0.1057±0.0053 | 0.00565±0.0032 |
| HER-2 | |||
| Negative | 49(73.1) | 0.01098±0.0026 | 0.0200±0.01540 |
| Positive | 18(26.9) | 0.01335±0.0027 | 0.00575±0.0014 |
ER, estrogen receptor; PR, progesterone receptor; HER-2, epidermal growth factor receptor-2; miR, microRNA.
miR-155 and miR-31 were overexpressed in breast cancer patients compared with healthy tissue and plasma samples
The expression levels of miR-155 and miR-31 in breast cancer tissues were examined and matched to the adjacent normal tissues by qRT-PCR assays. The results revealed that the expression levels of miR-155 in breast cancer tissues were ∼6-fold higher than those in the adjacent noncancerous tissues (P<0.05; Fig. 1). Conversely, no statistically significant difference was observed in the expression levels of miR-31 between breast cancer and the adjacent noncancerous tissues (P>0.05; Fig. 1). Notably, in patients who were >52 years old, the expression levels of miR-155 and miR-31 were 20 and 8.6 times higher than those in patients whose age was <52 years old (Table I). We further investigated whether there were any changes in the expression of miR-155 and miR-31 in the plasma of breast cancer patients. The RT-PCR assays revealed that the plasma levels of miR-155 in breast cancer patients were ∼6-fold higher than those of the healthy subjects (P<0.05; Fig. 2). Although no difference in the miR-31 levels was detectable between cancerous and noncancerous tissues, a significant difference was observed in the plasma levels of miR-31 between breast cancer patients and healthy controls (Table II). Furthermore, the expression levels of miR-155 in the cancerous tissues revealed a significant correlation with its expression levels in the plasma (r=0.820; P=0.000), but no correlation was noted between miR-31 expression in the cancerous tissues and plasma samples of breast cancer patients.
Figure 1.
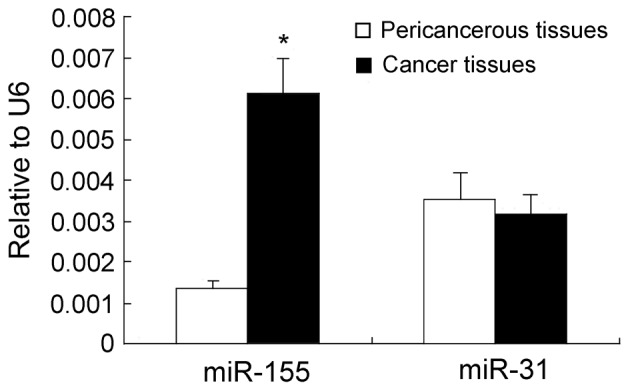
Expression of miR-155 and miR-31 in breast cancer tissues and pericancerous tissues.*P<0.05, compared with pericancerous tissues. miR, microRNA.
Figure 2.
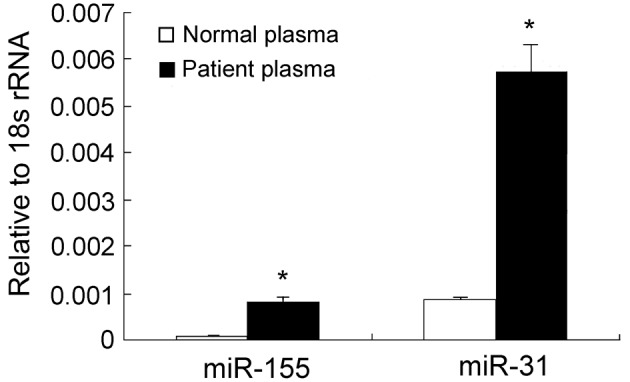
Relative miR-155 and miR-31 levels in plasma of breast cancer patients. *P<0.05, compared with healthy women. rRNA, ribosomal RNA.
Table II.
Expression of miR-155 and miR-31 in the plasma of 67 breast cancer patients.
| Clinicopathological characteristics | RNA samples n (%) | miR-155 (mean ± SD) | miR-31 (mean ± SD) |
|---|---|---|---|
| TNM stage | |||
| I | 3 (4.5) | 0.00024±0.00013 | 0.00112±0.00068 |
| II | 46 (68.7) | 0.0002±0.00005 | 0.00146±0.00040 |
| III | 18 (26.9) | 0.00016±0.00006 | 0.0011±0.00039 |
| ER | |||
| − | 27 (40.3) | 0.00020±0.00006 | 0.00136±0.00037 |
| + | 25 (37.3) | 0.00010±0.00004 | 0.00078±0.0002 |
| ++ | 10 (14.9) | 0.00013±0.00004 | 0.00072±0.00022 |
| +++ | 5 (7.5) | 0.00045±0.00017 | 0.00340±0.00151 |
| PR | |||
| − | 34 (50.7) | 0.00021±0.00006 | 0.00121±0.0003 |
| + | 23 (32.3) | 0.00016±0.00006 | 0.00100±0.0003 |
| ++ | 5 (8.5) | 0.00092±0.00002 | 0.00054±0.0001 |
| +++ | 5 (8.5) | 0.00049±0.00023 | 0.0043±0.0020 |
| HER-2 | |||
| Negative | 49 (73.1) | 0.00019±0.00004 | 0.00130±0.00031 |
| Positive | 18 (26.9) | 0.00036±0.00016 | 0.00257±0.00124 |
ER, estrogen receptor; PR, progesterone receptor; HER-2, epidermal growth factor receptor-2; miR, microRNA.
miR-155 expression is inversely correlated with the ER and PR status of breast cancer patients
The key roles of ER, PR and HER-2, which promote tumorigenesis, proliferation and distant metastasis, are well-established in the endocrine and target therapeutic regimens of breast cancer. Therefore, we investigated the correlation between miR-155 and miR-31 expression in breast cancer tissues and ER/PR/HER-2 status. An inverse correlation was observed between the expression levels of ER/PR and those of miR-155 in breast cancer patients (ER, r=−0.353, P=0.003; PR, r=−0.357, P=0.003) (Fig. 3). However, no correlation was observed between the expression levels of ER, PR and miR-31 (ER, r=−0.353, P=0.003; PR, r=−0.357, P=0.003). The correlation between miR-155 and miR-31 levels in the plasma and ER/PR/HER-2 status in breast cancer patients was further investigated. No correlation was observed between the expression levels of ER, PR and the plasma levels of miR-155 (ER, r=−0.353, P=0.003; PR, r=−0.357, P=0.003) as well as miR-31 (ER, r=−0.353, P=0.003; PR, r=−0.357, P=0.003). The correlation between HER-2, an independent predictor of breast cancer prognosis, miR-155 and miR-31 expression in breast cancer tissues and plasma levels was also examined. It was demonstrated that HER-2 status was not correlated with miR-155 (r=−0.353, P=0.003) or miR-31 expression (r=−0.353, P=0.003) in breast cancer tissues. Similarly, HER-2 was not correlated with plasma miR-155 (r=−0.353, P=0.003) and plasma miR-31 (r=−0.353, P=0.003).
Figure 3.
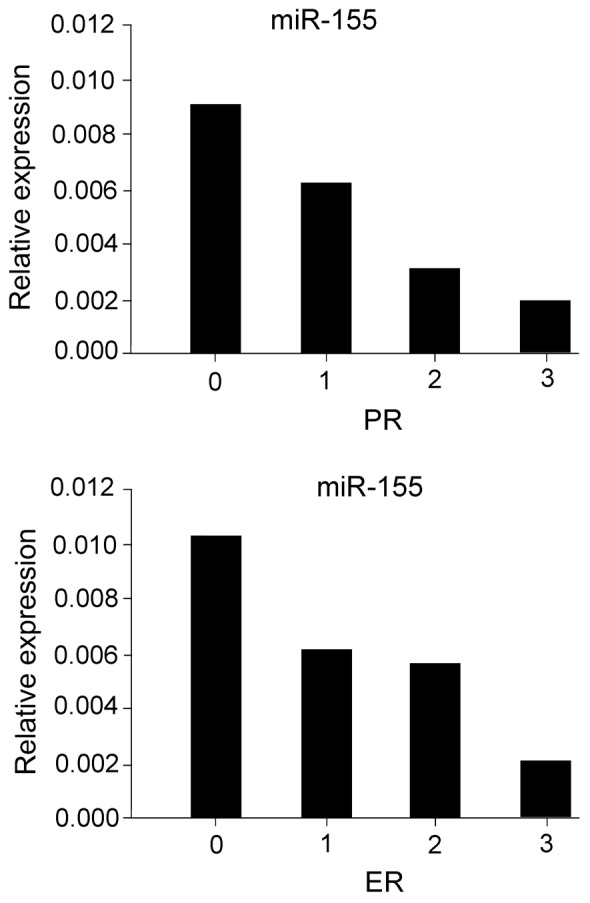
Correlation of miR-155 expression level with ER and PR levels in breast cancer tissues. miR, microRNA; ER, estrogen receptor; PR, progesterone receptor.
The correlations of miR-155 and miR-31 with patient clinicopathological characteristics, including TNM stage, lymph node metastasis and tumor size were also analyzed. The expression of miR-155 and miR-31 in TNM stage II tissues were higher than those in other TNM stages (I and III) and miR-155 was highly expressed in the groups of 0 or ≤3 lymph node metastases. High miR-31 expression was identified in non-lymph node metastasic tissues. In patients with tumor sizes of 2–5 cm, miR-155 and miR-31 were more abundant than in other sizes (Table I). The analysis of a correlation between the other clinicopathological characteristics examined, miR-155 and miR-31 expression in tissues and in plasma did not reveal any significant difference.
Discussion
miR-155 is overexpressed in various types of solid tumors, including breast cancer (25), pancreatic ductal adenocarcinoma (26) and lung cancer (27). miR-155 is considered to be a biological oncomir marker for poor prognosis. The significance analysis of microarrays (SAM) and prediction analysis of microarrays (PAM) from six types of solid tumors (lung, breast, colon, gastric, prostate and endocrine pancreatic tumors) revealed miR-21 and miR-155 to be at the top of the oncomir list (28). The dysregulation of miR-155 expression is involved in numerous pathological processes and oncogenic signaling (15,16,29). It was revealed that the miR-155 expression levels in breast cancer tissues were significantly elevated compared with those in paired normal tissues. miRNAs in the circulation have been shown to be stable (12,30) and are readily accessible. Sampling of miRNA in the blood is minimally invasive. Thus, the detection of miRNA in patient plasma has numerous advantages for possible clinic application. The plasma levels of miR-155 were significantly increased in breast cancer patients compared with those in healthy adults. These results are consistent with the observations in tissue samples. Furthermore, miR-155 expression was inversely correlated with ER and PR expression, regardless of HER-2 status. These findings suggest that miR-155 expression is dysregulated in breast cancer and is involved in the oncogenesis of breast tumors.
miR-31, which is encoded by a single genomic locus and is expressed in a variety of human tissues (19,31), is one of the pleiotropically cancer-relevant miRNAs. In a previous study, Valastyan et al identified miR-31 as a regulator of metastatic progression in human breast cancer via a PCR-based screening (17). The authors demonstrated an inverse correlation between miR-31 expression and the invasive capability in 15 different breast epithelial cell lines. Additionally, miR-31 levels in primary human breast tumors were revealed to be inversely associated with the propensity of clinically detectable distant metastases (17). In contrast to the existing clinical biomarkers for breast cancer, miR-31 expression was not correlated with disease relapse. In the current study, miR-31 expression was significantly elevated in the plasma samples of patients with breast cancer compared with that in healthy adults, whereas no significant difference was revealed between cancerous and noncancerous tissues. The observation that the level of miR-31 expression in tissue samples was different from the level of plasma samples reflects the complexity of the miRNA machinery regulation. One possible explanation is that numerous miRNAs are released into the circulation of the patients in a selective manner. The results of the current study did not demonstrate a close correlation between miR-31 and any clinicopathological characteristics. Unlike miR-31, miR-155 expression in tissue samples was consistent with that in plasma samples, indicating that the miR-155 level is a direct reflection of miR-155 expression in cancerous tissues. These results offer an experimental basis for the use of miRNAs as therapeutic targets. The development of modified miRNAs with longer in vivo half-lives and greater efficiency is the first step towards translating these fundamental research advances into medical practice. Future in vivo experiments of miRNA transgenics and knockouts are likely to offer more valuable information concerning the safety and efficacy of miRNA based therapy.
References
- 1.Jemal A, Bray F, Center MM, Ferlay J, Ward E, Forman D. Global cancer statistics. CA Cancer J Clin. 2011;61:69–90. doi: 10.3322/caac.20107. [DOI] [PubMed] [Google Scholar]
- 2.Iorio MV, Ferracin M, Liu CG, et al. MicroRNA gene expression deregulation in human breast cancer. Cancer Res. 2005;65:7065–7070. doi: 10.1158/0008-5472.CAN-05-1783. [DOI] [PubMed] [Google Scholar]
- 3.Mouridsen H, Giobbie-Hurder A, Goldhirsch A, et al. BIG 1-98 Collaborative Group: Letrozole therapy alone or in sequence with tamoxifen in women with breast cancer. N Engl J Med. 2009;361:766–776. doi: 10.1056/NEJMoa0810818. [DOI] [PMC free article] [PubMed] [Google Scholar]
- 4.Forbes JF, Cuzick J, Buzdar A, Howell A, Tobias JS, Baum M, Arimidex, Tamoxifen, Alone or in Combination Group Effect of anastrozole and tamoxifen as adjuvant treatment for early-stage breast cancer: 100-month analysis of the ATAC trial. Lancet Oncol. 2008;9:45–53. doi: 10.1016/S1470-2045(07)70385-6. [DOI] [PubMed] [Google Scholar]
- 5.Early Breast Cancer Trialist’s Collaborative Group Effects of chemotherapy and hormonal therapy for early breast cancer on recurrence and 15-year survival: an overview of the randomised trials. Lancet. 2005;365:1687–1717. doi: 10.1016/S0140-6736(05)66544-0. [DOI] [PubMed] [Google Scholar]
- 6.Calin GA, Croce CM. MicroRNA signatures in human cancers. Nat Rev Cancer. 2006;6:857–866. doi: 10.1038/nrc1997. [DOI] [PubMed] [Google Scholar]
- 7.Calin GA, Croce CM. MicroRNA-cancer connection: the beginning of a new tale. Cancer Res. 2006;66:7390–7394. doi: 10.1158/0008-5472.CAN-06-0800. [DOI] [PubMed] [Google Scholar]
- 8.Jeyaseelan K, Herath WB, Armugam A. MicroRNAs as therapeutic targets in human diseases. Expert Opin Ther Targets. 2007;11:1119–1129. doi: 10.1517/14728222.11.8.1119. [DOI] [PubMed] [Google Scholar]
- 9.Stahlhut Espinosa CE, Slack FJ. The role of microRNAs in cancer. Yale J Biol Med. 2006;79:131–140. [PMC free article] [PubMed] [Google Scholar]
- 10.Esquela-Kerscher A, Slack FJ. Oncomirs - microRNAs with a role in cancer. Nat Rev Cancer. 2006;6:259–269. doi: 10.1038/nrc1840. [DOI] [PubMed] [Google Scholar]
- 11.Tavazoie SF, Alarcón C, Oskarsson T, et al. Endogenous human microRNAs that suppress breast cancer metastasis. Nature. 2008;451:147–152. doi: 10.1038/nature06487. [DOI] [PMC free article] [PubMed] [Google Scholar]
- 12.Zhu W, Qin W, Atasoy U, Sauter ER. Circulating microRNAs in breast cancer and healthy subjects. BMC Res Notes. 2009;2:89. doi: 10.1186/1756-0500-2-89. [DOI] [PMC free article] [PubMed] [Google Scholar]
- 13.Faraoni I, Antonetti FR, Cardone J, Bonmassar E. miR-155 gene: a typical multifunctional microRNA. Biochim Biophys Acta. 2009;1792:497–505. doi: 10.1016/j.bbadis.2009.02.013. [DOI] [PubMed] [Google Scholar]
- 14.O’Connell RM, Chaudhuri AA, Rao DS, Baltimore D. Inositol phosphatase SHIP1 is a primary target of miR-155. Proc Natl Acad Sci USA. 2009;106:7113–7118. doi: 10.1073/pnas.0902636106. [DOI] [PMC free article] [PubMed] [Google Scholar]
- 15.Jiang S, Zhang HW, Lu MH, et al. MicroRNA-155 functions as an OncomiR in breast cancer by targeting the suppressor of cytokine signaling 1 gene. Cancer Res. 2010;70:3119–3127. doi: 10.1158/0008-5472.CAN-09-4250. [DOI] [PubMed] [Google Scholar]
- 16.Tili E, Michaille JJ, Wernicke D, et al. Mutator activity induced by microRNA-155 (miR-155) links inflammation and cancer. Proc Natl Acad Sci USA. 2011;108:4908–4913. doi: 10.1073/pnas.1101795108. [DOI] [PMC free article] [PubMed] [Google Scholar]
- 17.Valastyan S, Reinhardt F, Benaich N, et al. A pleiotropically acting microRNA, miR-31, inhibits breast cancer metastasis. Cell. 2009;137:1032–1046. doi: 10.1016/j.cell.2009.03.047. [DOI] [PMC free article] [PubMed] [Google Scholar] [Retracted]
- 18.Valastyan S, Chang A, Benaich N, Reinhardt F, Weinberg RA. Activation of miR-31 function in already-established metastases elicits metastatic regression. Genes Dev. 2011;25:646–659. doi: 10.1101/gad.2004211. [DOI] [PMC free article] [PubMed] [Google Scholar] [Retracted]
- 19.Valastyan S, Weinberg RA. miR-31: a crucial overseer of tumor metastasis and other emerging roles. Cell Cycle. 2010;9:2124–2129. doi: 10.4161/cc.9.11.11843. [DOI] [PubMed] [Google Scholar]
- 20.Liu CJ, Kao SY, Tu HF, Tsai MM, Chang KW, Lin SC. Increase of microRNA miR-31 level in plasma could be a potential marker of oral cancer. Oral Dis. 2010;16:360–364. doi: 10.1111/j.1601-0825.2009.01646.x. [DOI] [PubMed] [Google Scholar]
- 21.Sini RA, Trink B, Nissan A. The role of microRNA in tumorigenesis: key players or innocent bystanders. J Surg Oncol. 2009;99:135–136. doi: 10.1002/jso.21213. [DOI] [PubMed] [Google Scholar]
- 22.Tsui NB, Ng EK, Lo YM. Stability of endogenous and added RNA in blood specimens, serum, and plasma. Clin Chem. 2002;48:1647–1653. [PubMed] [Google Scholar]
- 23.Mitchell PS, Parkin RK, Kroh EM, et al. Circulating microRNAs as stable blood-based markers for cancer detection. Proc Natl Acad Sci USA. 2008;105:10513–10518. doi: 10.1073/pnas.0804549105. [DOI] [PMC free article] [PubMed] [Google Scholar]
- 24.Zhao H, Shen J, Medico L, Wang D, Ambrosone CB, Liu S. A pilot study of circulating miRNAs as potential biomarkers of early stage breast cancer. PLoS One. 2010;5:e13735. doi: 10.1371/journal.pone.0013735. [DOI] [PMC free article] [PubMed] [Google Scholar]
- 25.Zhu J, Hu XQ, Guo GL, et al. Expression and its clinical significance of miR-155 in human primary breast cancer. Zhonghua Wai Ke Za Zhi. 2010;48:205–208. (In Chinese) [PubMed] [Google Scholar]
- 26.Habbe N, Koorstra JB, Mendell JT, et al. MicroRNA miR-155 is a biomarker of early pancreatic neoplasia. Cancer Biol Ther. 2009;8:340–346. doi: 10.4161/cbt.8.4.7338. [DOI] [PMC free article] [PubMed] [Google Scholar]
- 27.Donnem T, Eklo K, Berg T, et al. Prognostic impact of MiR-155 in non-small cell lung cancer evaluated by in situ hybridization. J Transl Med. 2011;9:6. doi: 10.1186/1479-5876-9-6. [DOI] [PMC free article] [PubMed] [Google Scholar]
- 28.Volinia S, Calin GA, Liu CG, et al. A microRNA expression signature of human solid tumors defines cancer gene targets. Proc Natl Acad Sci USA. 2006;103:2257–2261. doi: 10.1073/pnas.0510565103. [DOI] [PMC free article] [PubMed] [Google Scholar]
- 29.Tili E, Croce CM, Michaille JJ. miR-155: on the crosstalk between inflammation and cancer. Int Rev Immunol. 2009;28:264–284. doi: 10.1080/08830180903093796. [DOI] [PubMed] [Google Scholar]
- 30.Heneghan HM, Miller N, Lowery AJ, Sweeney KJ, Newell J, Kerin MJ. Circulating microRNAs as novel minimally invasive biomarkers for breast cancer. Ann Surg. 2010;251:499–505. doi: 10.1097/SLA.0b013e3181cc939f. [DOI] [PubMed] [Google Scholar]
- 31.Stuelten CH, Salomon DS. miR-31 in cancer: location matters. Cell Cycle. 2010;9:4608–4609. doi: 10.4161/cc.9.23.13928. [DOI] [PubMed] [Google Scholar]