

Abstract
The corticospinal tract (CST) has dense contralateral and sparse ipsilateral spinal cord projections that converge with proprioceptive afferents on common spinal targets. Previous studies in adult rats indicate that the loss of dense contralateral spinal CST connections after unilateral pyramidal tract section (PTx), which models CST loss after stroke or spinal cord injury, leads to outgrowth from the spared side into the affected, ipsilateral, spinal cord. The reaction of proprioceptive afferents after this CST injury, however, is not known. Knowledge of proprioceptive afferent responses after loss of the CST could inform mechanisms of maladaptive plasticity in spinal sensorimotor circuits after injury. Here, we hypothesize that the loss of the contralateral CST results in a reactive increase in muscle afferents from the impaired limb and enhancement of their physiological actions within the cervical spinal cord. We found that 10 d after PTx, proprioceptive afferents sprout into cervical gray matter regions denervated by the loss of CST terminations. Furthermore, VGlut1-positive boutons, indicative of group 1A afferent terminals, increased on motoneurons. PTx also produced an increase in microglial density within the gray matter regions where CST terminations were lost. These anatomical changes were paralleled by reduction in frequency-dependent depression of the H-reflex, suggesting hyperreflexia. Our data demonstrate for the first time that selective CST injury induces maladaptive afferent fiber plasticity remote from the lesion. Our findings suggest a novel structural reaction of proprioceptive afferents to the loss of CST terminations and provide insight into mechanisms underlying spasticity.
Introduction
Skilled voluntary movements result from the interplay between supraspinal pathways and peripheral afferent inputs, converging upon common spinal circuits. The corticospinal tract (CST), a major pathway for voluntary control, has dense contralateral spinal cord projections. Proprioceptive afferents, which provide limb state information, project into segmental territories that partially overlap with the CST (Chakrabarty and Martin, 2011b). Serious CST damage, such as after stroke or spinal cord injury (SCI), produces a substantial loss of inputs onto contralateral spinal cord neurons, leading to negative and positive motor signs. Negative signs, including weakness and paralysis, are likely due to loss of feedforward control. Hyperreflexia and spasticity are common positive signs. Although it is not known how CST loss produces hyperreflexia and spasticity, these conditions can be produced by cortical disinhibition (Nielsen et al., 2007), changes in motoneuron membrane and neurotransmitter receptor properties (Thompson et al., 1998; Bennett et al., 2001; Li et al., 2004; Nielsen et al., 2007; Murray et al., 2010), and downregulation of membrane KCC2 cotransporter (Boulenguez et al., 2010) after spinal cord injury.
Loss of dense contralateral spinal CST connections leads to ipsilateral CST axon outgrowth from the unaffected side (Brus-Ramer et al., 2007). Outgrowth of spared ipsilateral CST axons begins to repopulate the spinal regions denervated by the injury (Brus-Ramer et al., 2007). In development, activity-dependent competition balances contralateral and ipsilateral CST terminations, whereby the developing CSTs from each hemisphere compete for synaptic connections onto spinal cord neurons (Martin et al., 2009). In maturity, activity-dependent competition is also functionally relevant: electrical stimulation of the spared CST promotes outgrowth into denervated regions (Brus-Ramer et al., 2007) and, in turn, leads to substantial functional improvement (Carmel et al., 2010).
As the CSTs from each hemisphere show important interactions after injury, in this study we examine a new interaction, between the CST and proprioceptive afferents. We test the hypothesis that loss of the contralateral CST results in a reactive increase in muscle afferents from the impaired limb, and their physiological actions, within the cervical spinal cord. Following our developmental findings, we propose that this is driven by the loss of competition with CST terminations. Knowledge of CST–proprioceptive interactions could inform mechanisms of maladaptive plasticity in spinal sensory-motor circuits after injury. We examined muscle afferent sprouting 10 d after severing all CST axons from one hemisphere by cutting the pyramid, sparing all other motor pathways. To assay functional changes after pyramidal lesion, we determined whether there was a change in the rate-dependent depression of the H-reflex, the electrophysiological analog of the spinal stretch reflex.
We found that proprioceptive afferents sprouted into spinal cord gray matter regions denervated by CST loss and this was paralleled by increased microgliosis. Importantly, the lesion produced a reduction in rate-dependent depression of the H-reflex, a model of hyperreflexia. Our data demonstrate, for the first time, that selective CST injury produces afferent fiber plasticity remote from the lesion. Our findings suggest a novel structural reaction of proprioceptive afferents to the loss of CST terminations and provide insight into mechanisms underlying spasticity.
Materials and Methods
Animals.
Experiments were performed in accordance with the National Institutes of Health Guidelines for the Care and Use of Laboratory Animals. All animal protocols were approved by The City College of New York Institutional Animal Care and Use Committee. Adult male Sprague Dawley rats (200–225 g) were used for this study. Animals were housed under a 12 h light/dark cycle in a pathogen-free area with water and food provided ad libitum.
Pyramidotomy.
Animals were anesthetized with a mixture of ketamine and xylazine (80/5 mg/kg, i.p.) and subjected to a pyramidal tract lesion (PTx animals; n = 11), as previously described (Brus-Ramer et al., 2007). A small craniotomy was made in the ventral surface of the occipital bone and the dura was resected to expose the pyramids on the ventral brainstem surface. A calibrated microscissor (Fine Science Tools) was lowered to a depth of 1.2 mm below the ventral medulla surface directly adjacent to the basilar artery [4 mm caudal to interaural distance (Paxinos and Watson, 1986)] and the entire right pyramid was transected. We histologically verified lesion completeness and the absence of involvement of more dorsal structures by examining transverse sections at the lesion site, and by the loss of PKC-γ immunoreactivity in the dorsal CST at the spinal cord level. Two animals were excluded from analysis due to this post hoc lesion confirmation. Sham animals (n = 10) received the same surgical procedures to expose the pyramid but did not undergo pyramidal lesions. Postoperative treatment included subcutaneous injection of 0.9% saline solution for rehydration (3.0 cc).
EMG recording and H-reflex testing.
Terminal electrophysiological experiments were performed 10 d after PTx or sham surgeries. Since H-reflex responses in animal models under ketamine anesthesia resemble that seen in unanesthetized humans (Ho and Waite, 2002), animals were first anesthetized with an induction dose of ketamine and xylazine (80/5 mg/kg, i.p.) but maintained on ketamine alone (20 mg/kg, i.p.) during the course of physiological experiments (Ho and Waite, 2002; Hosoido et al., 2009). Animals were monitored continuously throughout all procedures to ensure that adequate anesthesia was maintained. Supplemental ketamine anesthesia was provided to animals with the presence of a pedal reflex or eye blink reflex and to animals that exhibited increased respiration rates. Core body temperature was monitored with a rectal probe and maintained at 39 ± 1°C with a circulating water heating pad.
As described previously (Ho and Waite, 2002), the left and right forelimbs in anesthetized animals were shaved and a small skin incision was made to expose the muscles of the forearm and the lower biceps. The superficial radial nerve was used as a landmark to find the deep radial nerve, which was located below overlying muscle tissues. Careful blunt dissection with minimal muscle damage was used to isolate the deep radial nerve and mount the bipolar cuff stimulation electrode (see Fig. 7A, diagram). Teflon-insulated bipolar EMG electrodes (nickel chromium; A-M Systems) with exposed tips (∼1 mm) were inserted through syringe needles (27 g), bent into sharp barbs, and gently inserted ∼2 mm apart into the extensor carpi radialis (ECR) muscle. EMG responses to stimulation were filtered (10–1000 Hz), amplified, and recorded for off-line analysis using AxoGraph (AxoGraph X). Square wave unipolar stimulating pulses of 0.2 ms duration were used at a rate of 1 every 3 s to determine the minimum intensity to induce an M-wave response [threshold (T)]. Throughout all experiments, between 1.4T and 1.8T stimulation intensity provided the most consistent M- and H-wave responses. To determine the rate-dependent response of the H-reflex, a recognized approach for monitoring hyperreflexia, paired-pulse stimulation with conditioning and test pulses were used, at various interpulse intervals (IPIs) (5–2000 ms). Three trials (15 sweeps/trial) with at least 1 min rest between trials were recorded for each interpulse interval. The M- and H-wave amplitudes were quantified after rectifying and averaging the waveforms. For comparison, the maximum waveform amplitude of the H- and M-responses to the test pulse was converted into a percentage of the maximum amplitude response to the conditioning pulse. M- and H-waveform amplitude was measured from baseline to peak. In some animals, the end of the M-wave and the beginning of the H-wave overlapped, as observed in other studies of both the forelimb and hindlimb (Hosoido et al., 2009). In these cases, M- and H-wave currents may summate, making the H-wave measurements partially dependent on the M-wave. This did not affect comparisons of H-wave amplitude between 2000 and 50 ms IPIs because M-wave amplitude and the latency were stable (see Results). At 10 ms, a change in the M-wave amplitude or at 5 ms, a change in either amplitude or latency could result in a change in the measured H-wave relative to longer IPIs. M- and H-waveform latency was calculated from the stimulus to wave-response peak amplitude. To determine trial-to-trial consistency, the coefficient of variation for M- and H-waves was calculated by dividing the SD with the mean maximum amplitude.
Figure 7.

Physiological assessment of monosynaptic H-reflex. A shows the experimental setup for terminal electrophysiological testing. A stimulation bipolar cuff electrode was mounted around the deep radial nerve in the forelimb and stimulus-evoked EMGs were recorded with electrodes inserted into the extensor carpi radialis. Shown is the H-reflex monosynaptic pathway with sensory afferents (green) and motor efferents (red). Shown are the M-response (direct muscle activation) and H-reflex (central loop) after cuff stimulation. B, Averages (n = 15) of a representative recording from the DRN in a sham showing the responses to threshold stimulation (1T) and three suprathreshold stimuli. Note that the M-wave becomes progressively larger with increasing current, whereas the H-wave peaks at 1.6T. C, Representative M- and H-waves before (gray) and after (black) cutting the radial nerve proximal to the cuff electrode. Note loss of the H- but not the M-wave after nerve section demonstrating two distinct stimulus-evoked wave responses. D, The H- and M-wave percentage of maximal amplitudes are dependent on the stimulus intensity (T, threshold or rheobase for the M-wave response in each animal). As observed previously (Ho and Waite, 2002), whereas the amplitude of the M-wave increases over the range of stimulus intensities, the H-wave amplitude initially increases, reaches maximal values near 1.6T, and then progressively decreases. E, The ratio of the maximum amplitudes of the H-wave (Hmax) and M-wave (Mmax) reveals the stimulus-dependent relationship between the responses of these two waveforms.
Muscle afferent tracing.
Three days after PTx injury, animals were reanesthetized and muscle afferents of the deep radial nerve were labeled with 10 μl injections of a 1% solution of cholera toxin B (CTB) (List Biological Laboratories) into the extensor carpi radialis of both forelimbs. The solution was injected over 1 min, and the needle was withdrawn over an additional 1 min. The wound was closed by suturing the overlying muscle and skin.
Preliminary data demonstrated that CTB transganglionically labeled both primary sensory afferents and retrogradely labeled motoneuron pools. Anterograde labeling is punctate. Whereas at high magnification we could see punctate ventral horn labeling in proximity to labeled motoneurons, we were not able to distinguish this labeling from other ventral horn label, including portions of motoneuron dendrites and labeled recurrent motoneuron axon collaterals. For this reason, we limited our quantitative CTB analysis to the dorsal horn and intermediate zone. To assay putative 1A boutons on motoneuron cell bodies and proximal dendrites, we examined VgluT1 presynaptic labeling. As we were interested only in the effects of PTx on proprioceptive fibers, and their influence on spinal reflexes, we excluded CTB labeling within the motor pools from quantitative CTB analysis.
We confirmed symmetrical CTB labeling by quantifying the number of retrogradely labeled motoneurons in each animal (see Results). The pattern of CTB labeling also allowed us to examine the colocalization of VGluT1, a marker for excitatory presynaptic terminations, onto CTB-labeled motoneurons.
Tissue processing and immunofluorescent staining.
At the end of the survival period, rats were deeply anesthetized with ketamine–xylazine and transcardially perfused with 250 ml of 0.1 m phosphate buffer (PB) and heparin (0.003%) at 37°C followed by 300 ml of freshly prepared cold paraformaldehyde solution (4% in 0.1 m PB). The spinal cord (cervical enlargement ∼C5–C6) and hindbrain were removed, postfixed for 2 h at room temperature, and cryoprotected by immersion in 30% sucrose, 0.1 m PB at 4°C (Tan et al., 2007). Frozen coronal tissue sections were cut at 40 μm thickness using a sliding microtome and thaw mounted onto gelatinized glass slides.
Immunofluorescence staining methods are described previously (Tan et al., 2006; Campos et al., 2008). Sections were washed in blocking solution (0.1 m PBS, 0.1% Triton X-100, and 4% normal donkey serum) and incubated overnight at 4°C in the primary antibodies diluted in the same blocking solution. After washing in blocking solution, sections were incubated in fluorescent secondary antibodies (Invitrogen) for 90 min at room temperature. Slides were washed in clean PBS and coverslipped with Fluoromount-G (Southern Biotechnology). The following primary antibodies were used: goat anti-CTB antibody (List Biological Laboratories; 1:2000), mouse anti-VGlut (University of California at Davis/NIH NeuroMab Facility 1:500), rabbit anti-PKCγ (Santa Cruz Biotechnology 1:1000), and mouse anti-OX42 (Serotec; 1:1000). The following secondary antibodies were used: CY3 donkey anti-mouse (Jackson ImmunoResearch Laboratories; 1:500), Alexa Fluor 488 donkey anti-mouse (1:2000), Alexa Fluor 594 donkey anti-goat (1:2000), and Alexa Fluor 488 donkey anti-rabbit. All Alexa Fluor-conjugated antibodies were obtained from Invitrogen. Sections were visualized and digitally imaged using a Nikon Eclipse 80i fluorescence microscope equipped with a HQ Coolsnap camera (Roper Scientific) and/or a Zeiss LSM 510meta confocal microscope for Z-stack reconstruction analysis.
Image analysis.
To examine changes in the area and density of CTB-labeled axons, high-resolution digital photographs were taken at 10× magnification and combined into a single large image of entire spinal cord section at C5. We photographed 10–12 sections per animal. Sections were obtained from animals chosen on the basis of the following criteria: (1) having similar numbers of CTB-labeled motoneurons on each side of the spinal gray matter, and (2) complete unilateral lesion assessed by Nissl staining of the hindbrain (pyramids), and (3) the asymmetric loss of PKCγ immunoreactivity of the dorsal CST in the spinal cord dorsal columns. Double staining against PKCγ also confirmed the contralateral side of the spinal gray matter that was affected by unilateral pyramidotomy. All images underwent selective threshold adjustments using equivalent contrast/brightness levels to highlight only CTB-labeled fibers, which reduced noise variations between sections and animals (Photoshop; Adobe). Images were converted to binary and color-inverted for analysis. For digital color-coded density maps, black-and-white section images were exported into Matlab (MathWorks) and averaged using custom programs, as previously reported (Brus-Ramer et al., 2007; Friel and Martin, 2007).
For image analysis of CTB labeling, high-resolution mosaic images of each spinal cord coronal section was divided into three dorsoventral regions corresponding to the: dorsal zone (lamina I–III), the intermediate zone (lamina III–VI), and the remaining ventral horn of the gray matter. To compare the contralateral and ipsilateral sides from the PTx lesion, each of these regions were divided along the spinal cord midline to create a total of six distinct regions of interest. Because we were interested in changes within the gray matter only, the white matter areas of the spinal cord were digitally removed before analyses. The ventral regions containing the motor pools were also excluded from analysis. Although we could not entirely rule out the presence of labeled fragments of motoneuron dendrites from primary afferent analysis, we used consistent criteria for inclusion of dorsal and intermediate zone sampling across sections and animals. Furthermore, there was no difference in the numbers of labeled motoneurons in the sham and injured groups (see Results). CTB-labeling density of primary afferents was measured in each region using ImageJ software (http://rsb.info.nih.gov/ij/index.html), and the ratios between the contralateral and ipsilateral for each region were calculated and pooled within each animal and across animals for each experimental group. This ratio measurement was justified because ipsilesional label area was not different from shams. Afferent fiber density ratios were compared between sham and PTx animals for the dorsal and intermediate zone. Total pixel counts of labeled fibers were converted into micrometer units to calculate CTB-labeled primary afferent area. The mean total CTB-labeled primary afferent area was compared between sham (with averaged left and right sides) and contralateral regions in PTx animals.
To measure VGluT1 density on motoneurons, spinal cord sections (five to eight sections/animal) double-stained with CTB and VGluT1 were randomly chosen and analyzed by a blinded observer. Using confocal microscopy, captured Z-stack images were analyzed for the presence of VGluT1 boutons contacting CTB-labeled motoneuron dendrites and soma. VGlut1 bouton density on soma and dendrites were compared between sham (n = 6) and contralateral motoneurons in PTx animals (n = 6).
To measure the effects of unilateral PTx on spinal cord microglia, we also divided the spinal gray matter into dorsal, intermediate, and ventral regions (using methods described above) and corrected for staining differences by adjusting threshold control with ImageJ software so that background staining was eliminated. White matter regions were digitally removed before analysis. The area occupied by OX42-immunoreactive labeling within each region was measured. Regions from sham animals were compared with the contralesional side in PTx animals.
Regional density maps of CTB and OX42 labeling.
We previously developed a quantitative method for determining the topographic distribution of labeling within the spinal gray matter (Brus-Ramer et al., 2007; Friel and Martin, 2007; Salimi et al., 2008). In this study, we used this analysis for examining the regional distribution of CTB-labeled axons and for OX42-labeled microglia. For CTB labeling, the images used for quantitative measurements of label within the gray matter were imported into Matlab (MathWorks). Using a suite of programs that we have written, the gray matter was divided into 52 × 52 μm square regions of interest (ROIs). For each ROI, the mean density of labeling was determined. A matrix of mean label density was generated in Matlab that preserved the mediolateral and dorsoventral dimensions of the distribution of label within the gray matter. We converted the matrix into an image in which label density is represented according to a color scale, from the lowest density (blue) to the highest (red). First, averaged regional distribution maps were generated for individual animals, based on the same set of sections used for the quantitative measurements. Sections were aligned according to the point of intersection between the gray matter above the central canal and the dorsal median septum. These maps were examined and verified for similarity in section shape and alignment, for each component section. Next, on the basis of section similarity and alignment, we selected five sections from each animal (to give each animal equal weight) and generated an average map for all animals within each treatment group.
For the analysis of the locations of microglia, we first used two criterion to identify microglia: (1) positive immunoreactivity for OX42 and (2) the presence of stellate-shaped processes, a morphological characteristic of microglia in the spinal cord (Tan et al., 2011). We then digitally marked the center of the cell bodies of identified microglial cells on individual sections (five per animal). These were combined into a single file for each animal. Files containing the locations of microglia in individual animals were then imported into Matlab to generate an average map for each treatment group.
Statistical analysis.
All statistical tests were performed at the α-level of significance of 0.05 by two-tailed analyses using parametric and nonparametric tests, including t test and one-way ANOVA pairwise comparison and repeated-measures ANOVA, followed by post hoc correction for multiple comparison procedures as needed, and Mann–Whitney rank sum test. Data management and statistical analyses were performed using SigmaStat (version 3.0.1a; Jandel Scientific), and Microsoft Office Excel (2011), and plotted as mean ± SEM using SigmaPlot, version 8.02a.
Results
We traced central afferent projections from wrist extensor muscles to the C5–C6 segments to determine how unilateral PT lesion affected the local density and distribution of muscle afferents in the dorsal horn and intermediate zone. We used VGluT1 immunohistochemistry, combined with retrograde labeling of wrist extensor motoneurons, to determine the effect of PT lesion on group 1A afferent terminations on identified ECR motoneurons. Then we determined the effect of the PT lesion on microglia, using the histochemical marker OX42. To determine changes in spinal motor circuit excitability, we recorded the monosynaptic reflex, using a conditioning test paired-pulse paradigm.
Unilateral pyramidotomy interrupts CST axons contralateral to the injury
In sham animals, PKC-γ immunoreactivity revealed symmetrical labeling in the dorsal corticospinal tract (dCST) and laminae I and II of the substantia gelatinosa at the C5 level (Fig. 1A, inset). Ten days after unilateral pyramidotomy (on left side), PKC-γ immunoreactivity in the dorsal column on the contralesional side of the spinal cord was eliminated, while immunoreactivity on the ipsilesional side remained unchanged (Fig. 1B). In all animals used in our analysis, dorsal column staining of PKC-γ validated the completeness of the pyramidotomy at the spinal cord level. Furthermore, histological analysis at the lesion site indicated complete lesion in the animals used, without significant involvement of structures dorsal to the pyramid. As shown in the schematic in Figure 1B, inset, the majority of descending corticospinal tract on one side of the spinal cord are disrupted after this lesion (∼85–90%). The remaining CST projection to the contralesional side of the spinal cord originates from the motor cortex ipsilateral to the pyramidotomy (Brosamle and Schwab, 1997; Z'Graggen et al., 2000; Carmel et al., 2010).
Figure 1.

Pyramidal tract lesion. Thoracic spinal cord sections showing PKC-γ immunoreactivity in sham-operated rat (A) and after unilateral pyramidal tract lesion (B). The arrowhead points to loss of staining in the contralateral dCST. The insets in A and B show dCST staining at higher magnification. The schematic in B shows lesion and anatomical organization of spared CST. Scale bars: A, B, 1000 μm; insets, 200 μm.
Unilateral corticospinal tract injury induces proprioceptive afferent plasticity in the spinal cord
We hypothesized that unilateral PTx, with the loss of the dense contralateral CST projection, would lead to sprouting of proprioceptive afferents. To determine changes in the proprioceptive afferent terminations in the spinal cord, we injected the transganglionic axonal tracer CTB symmetrically into the ECR muscles on each side of sham and injured rats (Fig. 2). Previous studies have shown that CTB tracer preferentially labels medium- and large-diameter mechanoreceptive afferents projecting to the cuneate nucleus (LaMotte et al., 1991), as well as retrogradely labels motoneurons innervating the CTB-injected muscle (Kitzman, 2007). In agreement, we observed CTB-labeled fibers with segmental distributions that match well with the expected distribution of group I and group II mechanosensory afferents in the spinal cord dorsal horn, intermediate zone, and ventral horn motoneuron pools (Woolf et al., 1992, 1995).
Figure 2.

CTB labeling of muscle afferents in cervical spinal cord. Following bilateral injections of transganglionic neuronal tracer CTB into the extensor carpi radialis muscle groups, representative coronal sections of spinal cord cervical enlargement (segmental level C5) show CTB-labeled primary afferent terminations and motor pools in sham (A) and unilateral pyramidal tract lesion (C). The insets (a, a′, c, c′,) show magnified views of dorsal horn with Rexed's laminae indicated. Color-coded representations (heat maps) of the local density of CTB labeling for the group of sham controls (B, n = 6) and PTx (D, n = 5). Color scales plot sparse (blue) to dense (red) label (B, 0–0.55; D, 0–35; arbitrary units). Scale bars: A, C, insets, 500 μm; B, D, 650 μm.
To confirm that CTB injection labeling efficiency was equivalent for each side, we counted the number of retrogradely labeled motoneurons. There was no difference between the number of motoneurons located on either side of spinal cord sections in sham or PTx animals (for sham, left side vs right side: 5.95 ± 2.82 vs 5.89 ± 2.24 neurons, p = 0.96; PTx, left side vs right side: 6.91 ± 2.16 vs 7.26 ± 2.87 neurons, p = 0.82, t test). Similarly, a comparison across animal groups showed no difference in motoneuron number (sham vs PTx: 5.91 ± 2.42 vs 7.08 ± 2.42 neurons; p = 0.25, t test). Furthermore, the ratio of number of motoneurons on the right and left sides was close to 1 in both sham and PTx animals (for sham ratio, 1.01; for PTx ratio, 0.95).
Figure 2 shows C5 spinal cord CTB labeling from a representative sham (Fig. 2A) and a lesioned (Fig. 2C) animal. CTB labeled both afferents anterogradely and motoneurons, retrogradely. Overall, afferent fiber labeling in both groups was densest dorsally within laminae III and IV and in the medial halves of laminae V and VI, which is similar to other reports in the rat (LaMotte et al., 1991) and the cat (Chakrabarty and Martin, 2011a). In sham animals, CTB labeled sensory afferents symmetrically, as shown for a single representative section in the C5 segment (Fig. 2A, top panel). Figure 2B shows an averaged color-coded CTB density map for the sham group. Labeling is symmetrical between the two sides. Quantitative analysis of the primary afferent fiber densities on the two sides of the spinal cord (Fig. 3) demonstrated ratios close to 1 for both the dorsal horn (lamina I–III; ratio R/L: 1.01 ± 0.05; Fig. 3A) and intermediate zone (lamina III–VI; ratio R/L: 0.97 ± 0.06; Fig. 3B).
Figure 3.

Quantification of CTB-labeled primary afferent density. Response of CTB-labeled afferents in the dorsal horn (A) and intermediate zone (B) to unilateral pyramidal tract lesion. The open diamond symbols are means from individual animals. The bar graphs plot mean values of the ratio on the density of CTB labeling on the contralateral and ipsilateral sides. The ratio in PTx animals increased significantly, by >1.5-fold over that of sham animals for both the dorsal and intermediate zones (*p < 0.05).
In contrast to symmetrical labeling in sham animals, 10 d after unilateral PTx, proprioceptive afferent terminal density on the contralesional side of the spinal cord increased (Fig. 2C, top and bottom panels). Figure 2D shows an average color-coded density map for the PTx group. Note that the color scales in Figure 2, B and D, are the same, chosen to match the label density of the sham (bilaterally) with the PTx group ipsilesionally. Note that the differences in overall labeling in the motor pools between the two groups reflect overlap, size, and other factors of the labeled motoneurons, not differences in the numbers of labeled motoneurons. The pattern of anterograde labeling is similar to that of the sham group. Importantly, the density within the dorsal horn is substantially higher on the contralesional than ipsilesional side. A small increase in intermediate zone CTB label density contralateral to the lesion is apparent. Thus, there was a robust and consistent increase in CTB label density contralateral to the injury.
We next compared the ratio of the area of labeling on the contralateral and ipsilateral sides in the injured and sham (left and right sides) animals, both in the dorsal horn and intermediate zone (Fig. 3). The ratio in PTx animals increased significantly, by >1.5-fold over that of sham animals for both the dorsal (1.77 ± 0.48 vs 1.01 ± 0.05; p < 0.003, t = 3.817; Fig. 3A) and intermediate zone (1.52 ± 0.34 vs 0.97 ± 0.06; p < 0.003, t = 3.897; Fig. 3B). These changes continued to be significant after correction for multiple comparisons. Our findings show, for the first time, reactive sprouting of proprioceptive afferents after selective lesion of a supraspinal pathway, the CST. Interestingly, the increase in afferent fiber density overlapped partially the regions of CST loss we observed previously (Brus-Ramer et al., 2007; Carmel et al., 2010), suggesting a competitive interaction between the sensory fibers and CST (see Discussion).
VGLUT1-positive boutons on motoneurons increases after pyramidotomy
We next determined whether excitatory inputs onto motoneurons, in particular those of group 1A afferents, also increased after PTx. As discussed in Materials and Methods, we used immunostaining for VGluT1-positive boutons on CTB-labeled motoneurons to mark group 1A afferent terminals (Todd et al., 2003; Alvarez et al., 2004). Figure 4 shows a representative confocal z-stack from a sham (Fig. 4A) and an injured (Fig. 4B) animal (green, CTB; red, VGluT1). The arrowheads mark the locations of VGLuT1 boutons. As can be seen on these micrographs, there were substantially more VGlut1-positive boutons on the motoneuron soma and proximal dendrites on the contralateral side in the injured animal. The inset in Figure 4B shows a region of labeled motoneuron dendrite (green) and associated VGLUT1-positive boutons. We occasionally observed double-labeled pixels within a bouton (e.g., bottom left bouton), implying bouton–motoneuron overlap. However, CTB labeling within motoneurons was consistently less dense close to the membrane, which would minimize the opportunity for colocalization. For this reason, contact was defined on the basis of juxtaposition of VGLUT1 and CTB labeling only. A blinded observer counted the number of VGLUT1-immunopositive boutons (>1 μm diameter) that contacted the soma or dendrites of CTB-labeled motoneurons (sham: n = 20 motoneurons, 3.33 neurons/animal; PTx-affected side: n = 29 motoneurons, 4.83 neurons/animal; PTx-unaffected side: n = 19 motoneurons, 3.16 neurons/animal). Ten days after PTx, the density of VGLUT1 boutons contacting CTB-labeled motoneuron cell bodies (Fig. 4C) and proximal dendrites (Fig. 4D) increased significantly compared with sham animals (for soma: 7.62 ± 2.62 vs 5.95 ± 2.93 boutons, p < 0.05; for dendrites: 0.16 ± 0.05 vs 0.09 ± 0.05 boutons, p < 0.001, t test). These findings suggest a corresponding increase in proprioceptive afferent terminations on motoneurons after unilateral PTx.
Figure 4.

Excitatory neurotransmitter input upon motoneurons. Representative confocal z-stack images (8–12 optical sections) in sham (A) and contralesional side in PTx (B) animals show CTB-labeled motoneurons (green) and VGlut1-immunopositive boutons (red). The inset in B shows a 1 μm optical slice of apposition of VGluT1-positive bouton and a proximal motoneuron dendrite. Quantification of VGlut1 density on the soma (*p < 0.05) (C) and on dendritic branches (*p < 0.001) (D) showed a significantly increased density of boutons in PTx animals on the contralesional side compared with sham. The white arrowheads mark VGluT1-positive boutons. Scale bars: 20 μm; B, inset, 2 μm.
Pyramidotomy increases microglia density in the spinal cord gray matter
Microglia are thought to play an important role in initiating and maintaining hyperexcitable states in the CNS after injury and disease (Leong et al., 1995; Tsuda et al., 2008; Gwak and Hulsebosch, 2009; Tan et al., 2009). We next determined whether pyramidotomy significantly enhanced spinal microglial activation and microglia number. We compared OX42 staining of microglia in the gray matter of spinal cords in sham (A) and PTx (B) animals. Representative sections are shown in Figure 5. Compared with stellate-appearing microglia with elongated processes in a quiescent state, injury-activated microglia exhibit swollen cell bodies and shortened processes (Smith, 2010). As expected, microglia in the PTx animal have a morphology that is consistent with an activated state (Fig. 5A,C, insets). These sections also reveal an overall increase in OX42 density in PTx animals compared with sham animals.
Figure 5.

OX42 immunoreactivity reveal microglia in the spinal gray matter. Micrographs of a representative section in sham (A) and lesioned (C) animals. The bottom-left insets are higher magnification views showing the morphological change from inactive (A) to activated (C) forms. The bottom-right insets show the increased OX42 staining within the boxed areas (a and c) in the low-power views. The bar graphs plot the mean area of contralateral OX42-immunopositive within the dorsal horn, intermediate zone, and ventral horn from sham (B) and PTx (D) animals. Scale bars: A, C, 500 μm; bottom-left insets, 10 μm; bottom-right insets, 100 μm.
We quantified changes in the regional density of OX42 labeling. We focused on three regions: (1) dorsal horn, where the CST terminates densely; (2) intermediate zone, also where the CST terminates; and (3) ventral horn, where the CST has sparse termination. As for the CTB analysis, we used an imaging-based analysis to determine the total area of OX42 labeling. Figure 5B plots the amount of OX42 immunolabeling in the sham animals and, in Figure 5D, injured animals for the dorsal horn (laminae 1–3; top bars), intermediate zone (laminae 3–6; middle bars), and ventral horn (laminae 7–9; bottom bars). Significant differences between sham and injured animals were observed for the dorsal horn and intermediate zones only (dorsal horn: 17.7 ± 10.5 vs 33.27 ± 16.1 μm2; p = 0.04, ANOVA on ranks with Dunn's method); intermediate zone: 27.5 ± 4.39 vs 46.1 ± 8.57 μm2, p = 0.007, ANOVA on ranks with Bonferroni's post hoc).
The significant increases in OX42 staining within the dorsal horn and intermediate zone, where the CST terminates densely, but not the ventral horn, where CST terminations are sparse, suggested a microglial response only within the particular gray matter regions where dense CST terminations were lost to injury. To examine this further, we determined the regional density of microglia in the two animal groups, by plotting local microglial cell density as a color-coded representation (Fig. 6). Representative individual animals (Fig. 6A,B) show symmetrical density in the sham and substantially increased density for the PTx animal, on the contralateral side. This differential pattern is also clearly seen in the group data (Fig. 6B,D). We noted a correspondence between the region of increased microglial cell density and the region of densest CST terminations. Figure 6D also shows the approximate distribution of contralateral CST axon terminations, redrawn from our earlier study (Brus-Ramer et al., 2007). The solid line corresponds to the region of the densest labeling (calculated in that study to be the densest 35%). The generalized surrounding increase roughly corresponds to the total CST termination territory, which varies from dense in the intermediate zone to sparse in the ventral horn. Furthermore, the grouped data reveals an ipsilateral increase in microgliosis. The total distribution of increased microglial cell density corresponds well to the total distribution of ipsilateral CST terminations 10 d after PTx (Brus-Ramer et al., 2007).
Figure 6.

Microglia density in the cervical enlargement of representative sham (A) and PTx (B) rats. Group data are shown below in C and D (C, n = 6; D, n = 6). The black line in D marks the territory of densest CST terminations (Brus-Ramer et al., 2007). The scales in B apply to all sections: 1000 μm. Color scale is in arbitrary units: A, B, 0–0.06; C, D, 0–0.02.
In support of OX42 density measurements, microglia cell counts also demonstrated a significant increase in cell number in the PTx group affected side compared with sham animals in both the dorsal horn (66.4 ± 17.3 vs 87.2 ± 14.5 cells/section; p = 0.04, one-way ANOVA with Bonferroni's post hoc) and intermediate zone (59.4 ± 15.0 vs 150.9 ± 33.5 cells/section; p = 0.011, one-way ANOVA with Bonferroni's post hoc). We did not detect a difference in cell number between PTx and sham animals in the ventral horn (80.9 ± 16.1 vs 102.6 ± 26.1 cells/section; p = 0.11, one-way ANOVA). There was no significant difference in microglial cell number between the unaffected side (i.e., ipsilateral to the lesion) in the PTx group compared with uninjured sham (p = 0.39–0.84). Together, these findings suggest that, like other selective nerve injury models (Cova et al., 1988; Block et al., 2005; Blackbeard et al., 2007), microgliosis is topographically related to the loss of CST axon terminations and not a generalized inflammatory response.
Electrical stimulation of the deep radial nerve evokes predictable H-reflex and M-wave responses
We next determined the physiological impact of muscle afferent sprouting and increased microglial staining on local spinal circuits on the affected side. We compared the H-reflex response (also termed H-wave) in sham and injured animals. Simultaneously, we monitored the M-wave, which is produced by the orthodromically activated (direct) muscle response. The amplitude of the M-wave depends on the capacity of the muscle to respond to the electrical stimulation (Hultborn and Nielsen, 1995; Hosoido et al., 2009). We determined the H- and M-waves in the rat forelimb by electrically stimulating the deep radial nerve (DRN) and recording ECR EMG. We used a bipolar cuff stimulation electrode and EMG recording (Fig. 7A) (see also Materials and Methods). Group 1A afferents (green) and motor efferents (red) comprise the H-reflex monosynaptic pathway. Cuff electrode stimulation depolarizes both fibers bidirectionally, resulting in two EMG wave types: the M-response (direct muscle activation) and the H-reflex (central loop pathway). Typically, the M-wave was evoked at threshold followed by the H-wave at slightly increased stimulus intensity (e.g., 1.4T; Fig. 7B). Whereas the M-wave increased progressively with stimulus current, the H-wave reached maximal amplitude at 1.6T (see below) (Fig. 7D). Because of the short conductance times in the rat forelimb, in some animals, the end of the M-wave and the beginning of the H-wave overlapped. In these circumstances, it is possible that the measured H-wave amplitude may depend partially on the M-wave. As described below, the M-wave amplitude remained stable between 2000 and 50 ms IPIs, as did the latency, between 2000 and 10 ms. At the shortest intervals, a change in the M-wave could result in a change in the measured H-wave. At the conclusion of each reflex testing experiment, we transected the DRN proximal to the cuff to verify that the second response was a reflex. After nerve transection, the first wave was preserved, whereas the second was eliminated (Fig. 7C, black trace). The reduction in M-wave amplitude after nerve transection likely reflects acute hypotonia as a result of the sudden loss of tonic excitation that normally maintains the muscle tone in ketamine-anesthetized rats. In two experiments, we cut both distal and proximal to the cuff electrode, which resulted in the complete loss of both M- and H-waves.
We initially determined the optimal stimulus intensity for evoking a consistent H-reflex, as others have reported for rat hindlimb (Ho and Waite, 2002) and forelimb (Hosoido et al., 2009). We found that the M-wave threshold was consistently lower than the H-wave threshold. As expected, the M-wave peak amplitude increased in a linear fashion: as stimulus intensity increased, the M-wave amplitude increased. As shown in Figure 7D, at 1.4 times threshold (1.4T), the H-wave peak amplitude increased beyond the peak M-wave amplitude. At 1.6T, the H-wave peak amplitude was consistently larger than the M-wave. In most animals, increasing the stimulus intensity beyond 1.6T resulted in a decrease in the maximum H-wave amplitude compared with the M-wave, which continued to increase with increasing stimulus intensities. The peak amplitudes of the H- and M-waves at 1.6× threshold were 92.5 ± 6.4 and 65.75 ± 36.4%, respectively (n = 5). Figure 7E plots the ratio of the maximal H-wave amplitude to the maximal M-wave amplitude in relation to stimulus intensity. The ratio is >1 (i.e., H > M) for 1.4 to 1.8 times threshold. For the rest of our physiological experiments, we used stimulus intensities between 1.4T and 1.8T to ensure the consistent presence of the H-wave during the course of testing. These results show that, over a narrow range of stimulus intensities, the H-wave can be used as a sensitive assay for the magnitude of the H-reflex.
Unilateral pyramidotomy induces frequency-dependent amplification of the contralesional H-reflex
We determined the effects of unilateral pyramidotomy on the forelimb H-reflex (i.e., H-wave). Normally, following peripheral nerve stimulation, the H-reflex demonstrates frequency-dependent depression (Ho and Waite, 2002; Lee et al., 2009), either by a train of stimuli of progressively higher frequencies or paired stimuli of progressively shorter IPIs. In this study, we used a paired-pulse stimulation paradigm: a control and test pulse, separated by a range of IPIs from 2000 to 5 ms. Figure 8A shows representative qualitative examples of frequency-dependent depression in sham animals. At the longest IPI, 2000 ms, no depression was observed; the control and test stimulus produced H-waves of similar amplitudes. At 100 ms interval, there was clear frequency-dependent depression of the H-wave, with no change in the M-wave. At 10 ms, both the M- and H-waves were nearly abolished. Thus, there was clear depression of the H-wave, but the reduction in the M-wave indicates that the muscle cannot follow this high-frequency stimulation. We typically observed that the M-wave was substantially reduced at very short IPIs (see below).
Figure 8.
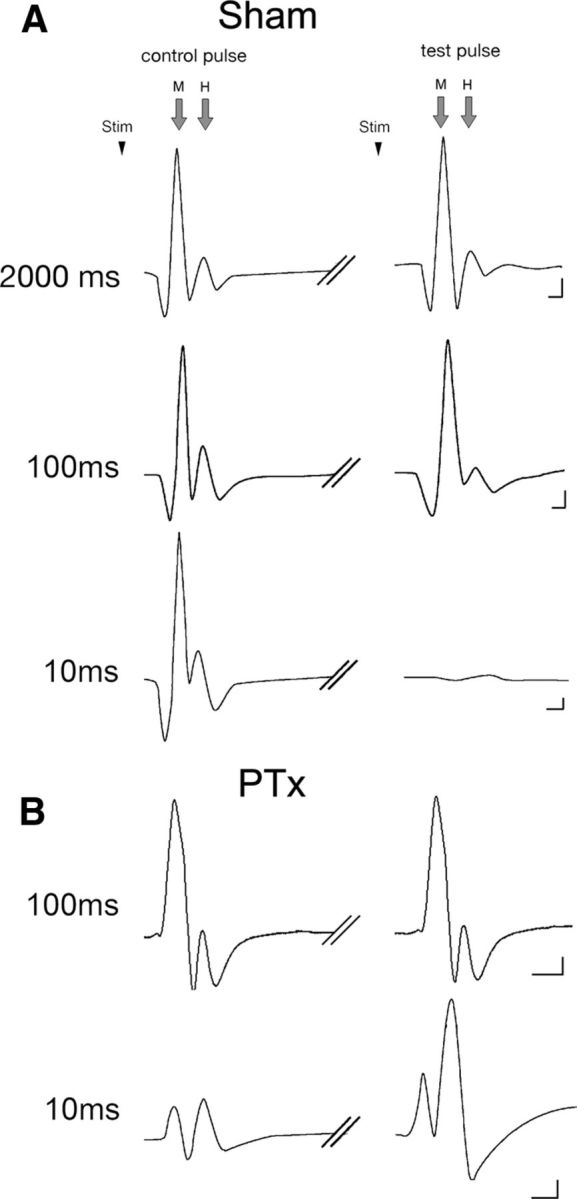
Representative M- and H-responses to the control (initial) and test (second) pulses are shown for key interpulse intervals. The control pulse stimulus (stim) was followed by the test pulse stimulus with a range of interpulse latencies. Data from sham (A) and PTx (B) animals are shown. Calibration: 100 mV/1 ms.
Ten days after unilateral pyramidotomy, the H-reflex in response to the test pulse revealed an injury-induced augmentation. Figure 8B shows a representative example of injury-induced stabilization of the H-wave at 100 ms, in contrast to normally expected depression at this IPI. The example at 10 ms IPI was chosen from a different animal (bottom trace). In this preparation, the M-wave remained stable at this short IPI. This reflects interanimal variability and not an effect of the lesion (see below). With a baseline of stable M-wave, we see a remarkable increase in the H-wave.
Figure 9 shows the percentage change in H- (Fig. 9A) and M- (Fig. 9B) waves for all sham (n = 5) and test animals (n = 5) over the complete range of IPIs examined (2000–5 ms). For sham animals, the H-reflex remained stable between 2000 and 150 ms. At shorter intervals, there is a progressive depression of the reflex. This time course of reflex depression is similar to prior studies in intact rats or after traumatic spinal injury (Ho and Waite, 2002; Hosoido et al., 2009). The M-wave amplitude is stable between 2000 and 50 ms. Significant reductions were observed only at 10 ms (percentage M-wave amplitude 2000 vs 10 ms: p = 0.002, F = 265.7, one-way ANOVA with Bonferroni's post hoc), with virtual elimination of the M-wave (along with the H-response) at 5 ms (2000 vs 5 ms for percentage M-wave amplitude: p < 0.001, F = 102.7, one-way ANOVA with Bonferroni's post hoc; for percentage H-wave amplitude: p < 0.001, F = 426.6, one-way ANOVA with Bonferroni's post hoc). Thus, H-reflex depression is a consistent feature in sham animals and for IPIs >10 ms, it is due to central changes, not an inability of the muscle to respond. At 5–10 ms IPIs, the reduction in H-wave is likely due to the combination of a central reduction and, importantly, the profound loss of the capacity of the muscle to respond.
Figure 9.

Rate-dependent depression of the H- and M-responses. Percentage H-reflex (A) and percentage M-wave (B) amplitudes (y-axis in A and B) are normalized values of the stimulus-evoked responses of the test pulse compared with the control pulse. In sham animals, as the interpulse intervals between the control and test pulse decreased (i.e., increase in stimulus frequency), both the percentage H-reflex (black line) and percentage M-wave (red line) remained relatively stable, close to 100%; at shorter intervals, these values decreased, demonstrating a rate-dependent depression of the responses. In PTx animals on the contralesional side, the percentage H-reflex exhibits less depression at higher rates of activity compared with sham, demonstrating increased excitability of the H-reflex; at 10 ms, there is evidence of strong facilitation (*p < 0.05). In contrast, the percentage M-wave does not significantly change after PTx. C and D plot the change in latency between the test and conditioning responses in relation to IPIs. Latency remained stable between IPIs of 2000 and 50 ms.
For the lesion group, all IPIs showed an increased percentage change in percentage H-reflex (Fig. 9A, red line). At 10 ms, there was a consistent and significant further facilitation of the H-reflex compared with sham (129.4 vs 38.1%; p = 0.01, one-way ANOVA). This is particularly remarkable because at this short interval there is a profound reduction in the M-wave in both groups. This indicates that the robust reflex facilitation is being transduced by a muscle that is substantially less capable of responding to the stimulus. Importantly, over the range of 2000 to 50 ms, the M-wave is close to 100%. A within-group analysis demonstrated no systematic difference in the percentage M-wave amplitude values between the 2000 and 50 ms interpulse interval test conditions (for sham, 2000 vs 50 ms: 111.5 vs 94.0%, p = 0.27, F = 1.42, one-way ANOVA with Bonferroni's post hoc; for PTx, 2000 vs 50 ms: 100.73 vs 93.2%, p = 0.64, F = 0.242; Fig. 9B). The difference between the H-wave percentage plots for the two groups (i.e., the space between the black and red lines) represents the augmentation in the H-reflex. Between 2000 and 50 ms, this was due to changes in central motor circuit plasticity in response to unilateral PTx, not the response capability of ECR. At 10 ms IPI, there was actually an increase in the H-wave despite a loss of muscle response capacity.
Figure 10 plots the H/M ratio. At all points, the PTx group shows larger ratio values than the shams. Beginning at 300 ms IPI, the two curves begin to deviate, with a large increase in H/M ratio for the PTx than sham groups. Thus, in contrast to sham animals where the M-wave is larger than the H-wave for most of the range of IPIs, the opposite is the case for the PTx group; the H-wave is larger. We calculated the coefficient of variation (CoV) for the H-wave (CoV = SD/mean of percentage H-reflex amplitude) for 50 and 10 ms IPIs for sham and injured animals. At the 50 ms IPI, the CoV was nearly 30% smaller for injured animals than shams (injured, 0.12; sham, 0.38). Similarly, at the 10 ms IPI, the CoV remained smaller, by nearly 20%, for injured than compared with sham animals (injured, 0.19; sham, 0.62). This demonstrates that unilateral PTx results in increased fidelity of the H-reflex response, which would result in more consistent reflex activation. This is likely due to the enhanced response.
Figure 10.

The ratio of the H-wave amplitude and the M-wave amplitude for the sham and PTx animal groups. Note that, at all IPIs, the ratio is higher for the PTx than sham group.
We also determined whether there were changes in the latency of the H-reflex and M-wave (time from stimulus onset to peak amplitude; Fig. 9C,D). Although there was a trend to longer latencies at 5 ms IPI after injury compared with sham, there were no significant differences overall (for H-reflex, 0.48 ± 0.31 vs 0.23 ± 0.16 ms, p = 0.51, t test; for M-wave, 0.60 ± 0.25 vs 0.13 ± 0.05, p = 0.19, t test). Thus, conduction and synaptic delay times remained the same across and within groups at all IPIs tested. The trend toward a longer latency at 5 ms may be due to the relative refractory period of the motor axons (Horcholle-Bossavit et al., 1987), which may further contribute to the loss of muscle response capacity at short IPIs.
Discussion
Spinal circuits are able to reorganize rapidly, both structurally and functionally, after motor pathway injury. CST lesion alone, without spinal cord injury, produces a diverse set of reactive changes in the spinal cord. It is well known that there is sprouting of spared ipsilateral CST fibers into the denervated side (Bareyre et al., 2002; Brus-Ramer et al., 2007; Carmel et al., 2010). Here, we show that, within the territory of the degenerating CST axons, there is sprouting of large-diameter muscle afferent fibers and an increase in microglia 10 d after PTx. We propose that these changes underlie the hyperreflexia we observed in the group 1a monosynaptic pathway. Reactive afferent sprouting occurs after SCI (McCouch et al., 1958; Krenz and Weaver, 1998; Wong et al., 2000; Ondarza et al., 2003; Zinck et al., 2007). Our study is the first to provide direct evidence for large-diameter afferent sprouting after selective CST injury. Sprouting after PTx could be due to several mechanisms, including local release of growth-promoting factors from microglia (see below), loss of synaptic competition exerted by contralateral CST terminations (Martin et al., 2009), and possibly a more permissive environment created by opening of synaptic space (Mannion et al., 1998).
There are multiple mechanisms of hyperreflexia
Animal and human studies provide evidence for multiple mechanisms for hyperreflexia and spasticity, including the following: at the level of sensory input to spinal circuits (Nielsen et al., 2007), synaptic rebalancing toward less descending and local inhibition (Kitzman, 2007), increases in motoneuronal excitability [e.g., plateau potentials (Bennett et al., 2001; Li and Bennett, 2003)], and KCC2 downregulation (Boulenguez et al., 2010; Murray et al., 2010). Our study helps to inform the mechanism of hyperreflexia in two new ways: we show a large-diameter afferent sprouting component that could produce larger responses at both interneuronal and motoneuronal levels for a given stimulus and, for microglial activation, a potential mechanism to increase neuronal excitability, similar to neuropathic pain after SCI (Scholz and Woolf, 2007; Milligan and Watkins, 2009).
Compared with spinal injury models (e.g., contusion), our approach provides a unique advantage for understanding reorganization of spinal circuits. Selective CST lesion in the brain provides an experimentally tractable approach to identify the loci of reactive excitability change because: only one pathway is involved; that pathway has few, if any, monosynaptic motoneuronal connections in the rat (Yang and Lemon, 2003); and there is no direct injury to the spinal cord. In addition to sprouting of CTB-labeled muscle afferents, we observed an increase in VGlut1-labeled puncta, a marker for presynaptic 1A afferent terminals (Alvarez et al., 2004), on motoneurons. Peripheral afferents contain the intrinsic capability to react after injury, as shown by others (Cao et al., 2006; Tan et al., 2006), and hence could become more effective in competing for, strengthening, or establishing de novo synaptic connections. In addition to dorsal horn and intermediate zone sprouting, a maladaptive increase in excitatory drive onto motoneurons likely contributes the presence of hyperreflexia after injury. If not accompanied by coestablishment of presynaptic inhibition (Betley et al., 2009), increased excitatory drive would support a net synergistic gain model of central hyperexcitability underlying the phenomenon of spasticity.
Potential tonic and phasic components of hyperreflexia
The robust reflex increase at the short IPIs could be especially debilitating, because it would preferentially affect movements requiring large forces and recruitment of the largest motor units. When muscle is driven maximally, muscle action potentials occur at short intervals [i.e., doublets (Gorassini et al., 1999)]. The largest responses have the greatest incremental force changes and are consequentially less well controlled than small forces. This could produce greater force control impairment after injury with production of higher intended forces.
Augmentation of the H-reflex at short and long IPIs could reflect distinct mechanisms: reflex augmentation at longer IPIs (i.e., 2000–50 ms) could be due to a reduction in postactivation depression, and at <50 ms, augmentation of postactivation facilitation. Using multipulse stimulation to activate the group 1A monosynaptic circuit, brief postactivation facilitation (<25 ms) is superimposed on a more prolonged postactivation depression at longer intervals (Curtis and Eccles, 1960; Wolpaw and Carp, 2006). Similar processes have been reported in motoneurons and in the intermediate zone (Collins et al., 1986, 1988; Grimwood and Appenteng, 1995). Normally, short-term modifications of the 1A response are thought to reflect the size of the readily releasable vesicular pool (Nielsen et al., 2007). Afferent sprouting would effectively increase this pool. This would help explain combined gain of postactivation facilitation (i.e., short-interval component) and loss of postactivation depression (i.e., long-interval components). Importantly, postactivation depression is reduced in spasticity patients (Nielsen et al., 1993, 1995; Aymard et al., 2000). Enhancement of temporal summation after injury could also differentially affect the short-interval component. For example, pain sensation and the withdrawal reflex shows maximal temporal facilitation in the 10–20 Hz range (Arendt-Nielsen et al., 2000). Injury-induced increases in circuit excitability underlying hyperreflexia may result from strengthened temporal-dependent central integration mechanism.
We studied the effects of selectively eliminating CST connections unilaterally on the contralateral forelimb and spinal circuits; we noted effects on the ipsilesional side that were intermediate in value between the contralesional side and uninjured sham animals. The loss of the sparse ipsilateral CST projection could explain ipsilateral changes. Interestingly, the facilitation during the phasic period, consistently observed contralaterally, was not present when examined ipsilaterally, further suggesting differential mechanisms.
Reactive microgliosis is restricted to regions of CST loss
Our findings demonstrate that selective CST injury produces microgliosis that is both remote from the initial site of injury and topographically restricted to spinal cord regions affected by Wallerian degeneration (dorsal horn, intermediate zone). In agreement, others have shown selective microgliosis in the spinal cord following unilateral peripheral nerve injury (Blackbeard et al., 2007; Zhang et al., 2008; Tan et al., 2011), traumatic brain injury (Block et al., 2005; Nagamoto-Combs et al., 2007), and cutaneous burn injury (Chang et al., 2010). Leong et al. (1995) demonstrated increased spinal microglia after PTx.
Activated microglia can release soluble BDNF and TNFα (Elkabes et al., 1996; Coull et al., 2005; Zhou et al., 2010), which can affect spinal neuronal excitability. Glia-to-neuron neurotrophin signaling can directly affect motoneuronal excitability (Mendell et al., 2001; García-Alías et al., 2011), and release of cytokines and growth factors can lead to reactive sprouting (Parish et al., 2002; Chen et al., 2008). Cytokines more than neurotrophins may be maladaptive after CST loss, since increases in spinal neurotrophin levels after motor training are associated with abrogating rate-dependent reflex depression (Côté et al., 2011). Similar to the potential role of microglial activation in hyperexcitability associated with neuropathic pain (Zhao et al., 2007; Biber et al., 2011), loss of the CST connection in the dorsal horn and intermediate zone might contribute to local microglial activation by cytokine release (Guo et al., 2007) and, in turn, lead to increased excitability in local spinal sensory-motor circuits. Microglial activation after PTx injury might “trigger” both reactive sprouting and excitability changes that together contribute to development of hyperreflexia and spasticity.
Promoting connections to abrogate establishment of maladaptive gain of function after injury
Competition between the CST and proprioceptive afferents may normally help to maintain balance in the density of their segmental connections in maturity. Competitive-like interactions between the developing CST and proprioceptive afferents have been described, as coordinated development (Chakrabarty and Martin, 2011b), and both competitive (Gibson et al., 2000) and cooperative interactions (Clowry et al., 2004). Ours is the first demonstration of large-diameter afferent sprouting after loss of the CST in maturity. Activity-dependent competition between CST axon terminations in maturity is supported by the finding of increased CST outgrowth with stimulation, either in the intact CST or the spared CST after unilateral PTx (Brus-Ramer et al., 2007; Carmel et al., 2010).
Competition, as a way to explain the response of spinal circuits to partial injury, is a new idea, relevant to consideration of gain of function after injury (Martin, 2012). The loss of dense CST terminations after PTx may alleviate the competition faced by afferent fibers, allowing the afferents to expand their termination space. However, it should be noted that a stroke or traumatic brain injury that damages the CST is apt also to affect corticobulbar projections, which could change the balance of function of spinal motor circuits in more complex ways. In the context of potential maladaptive competitive interactions, which systems should be supported by therapy: proprioceptive afferents or the CST? Functional electrical stimulation, an afferent therapy, is effective in ameliorating spasticity (Peckham and Knutson, 2005). Promoting afferents and reflex strength also, for example, improves posture (Wolpaw, 1994; Sandrini et al., 2005). But this might be at the expense of sprouting of spared CST connections and feedforward control. By contrast, promoting remaining CST connections could lead to behavioral recovery (Brus-Ramer et al., 2007; Carmel et al., 2010) by strengthening feedforward control, but at the expense of afferent fiber sprouting and feedback control mechanisms. Promoting spared CST connections could help balance unchecked competition from afferent fiber outgrowth and stem the tide of maladaptive reactive changes after injury.
Footnotes
This work was supported by NIH Grant R01 NS64004 (J.H.M.). We thank Harry Acosta and Dr. Sulli Popilskis for animal care, Xiuli Wu for histology and immunohistochemistry, and Dr. Kathleen Friel for statistical consultation.
References
- Alvarez FJ, Villalba RM, Zerda R, Schneider SP. Vesicular glutamate transporters in the spinal cord, with special reference to sensory primary afferent synapses. J Comp Neurol. 2004;472:257–280. doi: 10.1002/cne.20012. [DOI] [PubMed] [Google Scholar]
- Arendt-Nielsen L, Sonnenborg FA, Andersen OK. Facilitation of the withdrawal reflex by repeated transcutaneous electrical stimulation: an experimental study on central integration in humans. Eur J Appl Physiol. 2000;81:165–173. doi: 10.1007/s004210050026. [DOI] [PubMed] [Google Scholar]
- Aymard C, Katz R, Lafitte C, Lo E, Pénicaud A, Pradat-Diehl P, Raoul S. Presynaptic inhibition and homosynaptic depression: a comparison between lower and upper limbs in normal human subjects and patients with hemiplegia. Brain. 2000;123:1688–1702. doi: 10.1093/brain/123.8.1688. [DOI] [PubMed] [Google Scholar]
- Bareyre FM, Haudenschild B, Schwab ME. Long-lasting sprouting and gene expression changes induced by the monoclonal antibody IN-1 in the adult spinal cord. J Neurosci. 2002;22:7097–7110. doi: 10.1523/JNEUROSCI.22-16-07097.2002. [DOI] [PMC free article] [PubMed] [Google Scholar]
- Bennett DJ, Li Y, Siu M. Plateau potentials in sacrocaudal motoneurons of chronic spinal rats, recorded in vitro. J Neurophysiol. 2001;86:1955–1971. doi: 10.1152/jn.2001.86.4.1955. [DOI] [PubMed] [Google Scholar]
- Betley JN, Wright CV, Kawaguchi Y, Erdélyi F, Szabó G, Jessell TM, Kaltschmidt JA. Stringent specificity in the construction of a GABAergic presynaptic inhibitory circuit. Cell. 2009;139:161–174. doi: 10.1016/j.cell.2009.08.027. [DOI] [PMC free article] [PubMed] [Google Scholar]
- Biber K, Tsuda M, Tozaki-Saitoh H, Tsukamoto K, Toyomitsu E, Masuda T, Boddeke H, Inoue K. Neuronal CCL21 up-regulates microglia P2X4 expression and initiates neuropathic pain development. EMBO J. 2011;30:1864–1873. doi: 10.1038/emboj.2011.89. [DOI] [PMC free article] [PubMed] [Google Scholar]
- Blackbeard J, O'Dea KP, Wallace VC, Segerdahl A, Pheby T, Takata M, Field MJ, Rice AS. Quantification of the rat spinal microglial response to peripheral nerve injury as revealed by immunohistochemical image analysis and flow cytometry. J Neurosci Methods. 2007;164:207–217. doi: 10.1016/j.jneumeth.2007.04.013. [DOI] [PMC free article] [PubMed] [Google Scholar]
- Block F, Dihné M, Loos M. Inflammation in areas of remote changes following focal brain lesion. Prog Neurobiol. 2005;75:342–365. doi: 10.1016/j.pneurobio.2005.03.004. [DOI] [PubMed] [Google Scholar]
- Boulenguez P, Liabeuf S, Bos R, Bras H, Jean-Xavier C, Brocard C, Stil A, Darbon P, Cattaert D, Delpire E, Marsala M, Vinay L. Down-regulation of the potassium-chloride cotransporter KCC2 contributes to spasticity after spinal cord injury. Nat Med. 2010;16:302–307. doi: 10.1038/nm.2107. [DOI] [PubMed] [Google Scholar]
- Brösamle C, Schwab ME. Cells of origin, course, and termination patterns of the ventral, uncrossed component of the mature rat corticospinal tract. J Comp Neurol. 1997;386:293–303. doi: 10.1002/(sici)1096-9861(19970922)386:2<293::aid-cne9>3.0.co;2-x. [DOI] [PubMed] [Google Scholar]
- Brus-Ramer M, Carmel JB, Chakrabarty S, Martin JH. Electrical stimulation of spared corticospinal axons augments connections with ipsilateral spinal motor circuits after injury. J Neurosci. 2007;27:13793–13801. doi: 10.1523/JNEUROSCI.3489-07.2007. [DOI] [PMC free article] [PubMed] [Google Scholar]
- Campos LW, Chakrabarty S, Haque R, Martin JH. Regenerating motor bridge axons refine connections and synapses on lumbar motoneurons to bypass chronic spinal cord injury. J Comp Neurol. 2008;506:838–850. doi: 10.1002/cne.21579. [DOI] [PubMed] [Google Scholar]
- Cao Z, Gao Y, Bryson JB, Hou J, Chaudhry N, Siddiq M, Martinez J, Spencer T, Carmel J, Hart RB, Filbin MT. The cytokine interleukin-6 is sufficient but not necessary to mimic the peripheral conditioning lesion effect on axonal growth. J Neurosci. 2006;26:5565–5573. doi: 10.1523/JNEUROSCI.0815-06.2006. [DOI] [PMC free article] [PubMed] [Google Scholar]
- Carmel JB, Berrol LJ, Brus-Ramer M, Martin JH. Chronic electrical stimulation of the intact corticospinal system after unilateral injury restores skilled locomotor control and promotes spinal axon outgrowth. J Neurosci. 2010;30:10918–10926. doi: 10.1523/JNEUROSCI.1435-10.2010. [DOI] [PMC free article] [PubMed] [Google Scholar]
- Chakrabarty S, Martin J. Postnatal refinement of proprioceptive afferents in the cat cervical spinal cord. Eur J Neurosci. 2011a;33:1656–1666. doi: 10.1111/j.1460-9568.2011.07662.x. [DOI] [PMC free article] [PubMed] [Google Scholar]
- Chakrabarty S, Martin JH. Co-development of proprioceptive afferents and the corticospinal tract within the cervical spinal cord. Eur J Neurosci. 2011b;34:682–694. doi: 10.1111/j.1460-9568.2011.07798.x. [DOI] [PubMed] [Google Scholar]
- Chang YW, Tan A, Saab C, Waxman S. Unilateral focal burn injury is followed by long-lasting bilateral allodynia and neuronal hyperexcitability in spinal cord dorsal horn. J Pain. 2010;11:119–130. doi: 10.1016/j.jpain.2009.06.009. [DOI] [PubMed] [Google Scholar]
- Chen Q, Smith GM, Shine HD. Immune activation is required for NT-3-induced axonal plasticity in chronic spinal cord injury. Exp Neurol. 2008;209:497–509. doi: 10.1016/j.expneurol.2007.11.025. [DOI] [PMC free article] [PubMed] [Google Scholar]
- Clowry GJ, Davies BM, Upile NS, Gibson CL, Bradley PM. Spinal cord plasticity in response to unilateral inhibition of the rat motor cortex during development: changes to gene expression, muscle afferents and the ipsilateral corticospinal projection. Eur J Neurosci. 2004;20:2555–2566. doi: 10.1111/j.1460-9568.2004.03713.x. [DOI] [PubMed] [Google Scholar]
- Collins WF, 3rd, Davis BM, Mendell LM. Amplitude modulation of EPSPs in motoneurons in response to a frequency-modulated train in single la afferent fibers. J Neurosci. 1986;6:1463–1468. doi: 10.1523/JNEUROSCI.06-05-01463.1986. [DOI] [PMC free article] [PubMed] [Google Scholar]
- Collins WF, 3rd, Davis BM, Mendell LM. Modulation of EPSP amplitude during high frequency stimulation depends on the correlation between potentiation, depression and facilitation. Brain Res. 1988;442:161–165. doi: 10.1016/0006-8993(88)91445-x. [DOI] [PubMed] [Google Scholar]
- Côté MP, Azzam GA, Lemay MA, Zhukareva V, Houlé JD. Activity-dependent increase in neurotrophic factors is associated with an enhanced modulation of spinal reflexes after spinal cord injury. J Neurotrauma. 2011;28:299–309. doi: 10.1089/neu.2010.1594. [DOI] [PMC free article] [PubMed] [Google Scholar]
- Coull JA, Beggs S, Boudreau D, Boivin D, Tsuda M, Inoue K, Gravel C, Salter MW, De Koninck Y. BDNF from microglia causes the shift in neuronal anion gradient underlying neuropathic pain. Nature. 2005;438:1017–1021. doi: 10.1038/nature04223. [DOI] [PubMed] [Google Scholar]
- Cova JL, Aldskogius H, Arvidsson J, Molander C. Changes in microglial cell numbers in the spinal cord dorsal horn following brachial plexus transection in the adult rat. Exp Brain Res. 1988;73:61–68. doi: 10.1007/BF00279661. [DOI] [PubMed] [Google Scholar]
- Curtis DR, Eccles JC. Synaptic action during and after repetitive stimulation. J Physiol. 1960;150:374–398. doi: 10.1113/jphysiol.1960.sp006393. [DOI] [PMC free article] [PubMed] [Google Scholar]
- Elkabes S, DiCicco-Bloom EM, Black IB. Brain microglia/macrophages express neurotrophins that selectively regulate microglial proliferation and function. J Neurosci. 1996;16:2508–2521. doi: 10.1523/JNEUROSCI.16-08-02508.1996. [DOI] [PMC free article] [PubMed] [Google Scholar]
- Friel KM, Martin JH. Bilateral activity-dependent interactions in the developing corticospinal system. J Neurosci. 2007;27:11083–11090. doi: 10.1523/JNEUROSCI.2814-07.2007. [DOI] [PMC free article] [PubMed] [Google Scholar]
- García-Alías G, Petrosyan HA, Schnell L, Horner PJ, Bowers WJ, Mendell LM, Fawcett JW, Arvanian VL. Chondroitinase ABC combined with neurotrophin NT-3 secretion and NR2D expression promotes axonal plasticity and functional recovery in rats with lateral hemisection of the spinal cord. J Neurosci. 2011;31:17788–17799. doi: 10.1523/JNEUROSCI.4308-11.2011. [DOI] [PMC free article] [PubMed] [Google Scholar]
- Gibson CL, Arnott GA, Clowry GJ. Plasticity in the rat spinal cord seen in response to lesions to the motor cortex during development but not to lesions in maturity. Exp Neurol. 2000;166:422–434. doi: 10.1006/exnr.2000.7511. [DOI] [PubMed] [Google Scholar]
- Gorassini M, Bennett DJ, Kiehn O, Eken T, Hultborn H. Activation patterns of hindlimb motor units in the awake rat and their relation to motoneuron intrinsic properties. J Neurophysiol. 1999;82:709–717. doi: 10.1152/jn.1999.82.2.709. [DOI] [PubMed] [Google Scholar]
- Grimwood P, Appenteng K. Effects of afferent firing frequency on the amplitude of the monosynaptic EPSP elicited by trigeminal spindle afferents on trigeminal motoneurones. Brain Res. 1995;689:299–303. doi: 10.1016/0006-8993(95)00606-q. [DOI] [PubMed] [Google Scholar]
- Guo W, Wang H, Watanabe M, Shimizu K, Zou S, LaGraize SC, Wei F, Dubner R, Ren K. Glial-cytokine-neuronal interactions underlying the mechanisms of persistent pain. J Neurosci. 2007;27:6006–6018. doi: 10.1523/JNEUROSCI.0176-07.2007. [DOI] [PMC free article] [PubMed] [Google Scholar]
- Gwak YS, Hulsebosch CE. Remote astrocytic and microglial activation modulates neuronal hyperexcitability and below-level neuropathic pain after spinal injury in rat. Neuroscience. 2009;161:895–903. doi: 10.1016/j.neuroscience.2009.03.055. [DOI] [PMC free article] [PubMed] [Google Scholar]
- Ho SM, Waite PM. Effects of different anesthetics on the paired-pulse depression of the h reflex in adult rat. Exp Neurol. 2002;177:494–502. doi: 10.1006/exnr.2002.8013. [DOI] [PubMed] [Google Scholar]
- Horcholle-Bossavit G, Jami L, Petit J, Scott JJ. Activation of cat motor units by paired stimuli at short intervals. J Physiol. 1987;387:385–399. doi: 10.1113/jphysiol.1987.sp016579. [DOI] [PMC free article] [PubMed] [Google Scholar]
- Hosoido T, Motoyama S, Goto M, Mori F, Tajima T, Hirata H, Wada N. Characteristics of H- and M-waves recorded from rat forelimbs. Neurosci Lett. 2009;450:239–241. doi: 10.1016/j.neulet.2008.11.045. [DOI] [PubMed] [Google Scholar]
- Hultborn H, Nielsen JB. H-reflexes and F-responses are not equally sensitive to changes in motoneuronal excitability. Muscle Nerve. 1995;18:1471–1474. doi: 10.1002/mus.880181219. [DOI] [PubMed] [Google Scholar]
- Kitzman P. VGLUT1 and GLYT2 labeling of sacrocaudal motoneurons in the spinal cord injured spastic rat. Exp Neurol. 2007;204:195–204. doi: 10.1016/j.expneurol.2006.10.008. [DOI] [PubMed] [Google Scholar]
- Krenz NR, Weaver LC. Sprouting of primary afferent fibers after spinal cord transection in the rat. Neuroscience. 1998;85:443–458. doi: 10.1016/s0306-4522(97)00622-2. [DOI] [PubMed] [Google Scholar]
- LaMotte CC, Kapadia SE, Shapiro CM. Central projections of the sciatic, saphenous, median, and ulnar nerves of the rat demonstrated by transganglionic transport of choleragenoid-HRP (B-HRP) and wheat germ agglutinin-HRP (WGA-HRP) J Comp Neurol. 1991;311:546–562. doi: 10.1002/cne.903110409. [DOI] [PubMed] [Google Scholar]
- Lee HJ, Jakovcevski I, Radonjic N, Hoelters L, Schachner M, Irintchev A. Better functional outcome of compression spinal cord injury in mice is associated with enhanced H-reflex responses. Exp Neurol. 2009;216:365–374. doi: 10.1016/j.expneurol.2008.12.009. [DOI] [PubMed] [Google Scholar]
- Leong SK, Ling EA, Fan DP. Glial reaction after pyramidotomy in mice and rats. Neurodegeneration. 1995;4:403–413. doi: 10.1006/neur.1995.0049. [DOI] [PubMed] [Google Scholar]
- Li Y, Bennett DJ. Persistent sodium and calcium currents cause plateau potentials in motoneurons of chronic spinal rats. J Neurophysiol. 2003;90:857–869. doi: 10.1152/jn.00236.2003. [DOI] [PubMed] [Google Scholar]
- Li Y, Li X, Harvey PJ, Bennett DJ. Effects of baclofen on spinal reflexes and persistent inward currents in motoneurons of chronic spinal rats with spasticity. J Neurophysiol. 2004;92:2694–2703. doi: 10.1152/jn.00164.2004. [DOI] [PubMed] [Google Scholar]
- Mannion RJ, Doubell TP, Gill H, Woolf CJ. Deafferentation is insufficient to induce sprouting of A-fibre central terminals in the rat dorsal horn. J Comp Neurol. 1998;393:135–144. doi: 10.1002/(sici)1096-9861(19980406)393:2<135::aid-cne1>3.0.co;2-3. [DOI] [PubMed] [Google Scholar]
- Martin J, Friel K, Salimi I, Chakrabarty S. Corticospinal development. In: Squire L, editor. Encyclopedia of neuroscience. Vol 3. Oxford: Academic; 2009. pp. 302–314. [Google Scholar]
- Martin JH. Systems neurobiology of restorative neurology and future directions for repair of the damaged motor systems. Clin Neurol Neurosurg. 2012;114:515–523. doi: 10.1016/j.clineuro.2012.01.011. [DOI] [PubMed] [Google Scholar]
- McCouch GP, Austin GM, Liu CN, Liu CY. Sprouting as a cause of spasticity. J Neurophysiol. 1958;21:205–216. doi: 10.1152/jn.1958.21.3.205. [DOI] [PubMed] [Google Scholar]
- Mendell LM, Munson JB, Arvanian VL. Neurotrophins and synaptic plasticity in the mammalian spinal cord. J Physiol. 2001;533:91–97. doi: 10.1111/j.1469-7793.2001.0091b.x. [DOI] [PMC free article] [PubMed] [Google Scholar]
- Milligan ED, Watkins LR. Pathological and protective roles of glia in chronic pain. Nat Rev Neurosci. 2009;10:23–36. doi: 10.1038/nrn2533. [DOI] [PMC free article] [PubMed] [Google Scholar]
- Murray KC, Nakae A, Stephens MJ, Rank M, D'Amico J, Harvey PJ, Li X, Harris RL, Ballou EW, Anelli R, Heckman CJ, Mashimo T, Vavrek R, Sanelli L, Gorassini MA, Bennett DJ, Fouad K. Recovery of motoneuron and locomotor function after spinal cord injury depends on constitutive activity in 5-HT2C receptors. Nat Med. 2010;16:694–700. doi: 10.1038/nm.2160. [DOI] [PMC free article] [PubMed] [Google Scholar]
- Nagamoto-Combs K, McNeal DW, Morecraft RJ, Combs CK. Prolonged microgliosis in the rhesus monkey central nervous system after traumatic brain injury. J Neurotrauma. 2007;24:1719–1742. doi: 10.1089/neu.2007.0377. [DOI] [PubMed] [Google Scholar]
- Nielsen J, Petersen N, Ballegaard M, Biering-Sørensen F, Kiehn O. H-reflexes are less depressed following muscle stretch in spastic spinal cord injured patients than in healthy subjects. Exp Brain Res. 1993;97:173–176. doi: 10.1007/BF00228827. [DOI] [PubMed] [Google Scholar]
- Nielsen J, Petersen N, Crone C. Changes in transmission across synapses of Ia afferents in spastic patients. Brain. 1995;118:995–1004. doi: 10.1093/brain/118.4.995. [DOI] [PubMed] [Google Scholar]
- Nielsen JB, Crone C, Hultborn H. The spinal pathophysiology of spasticity—from a basic science point of view. Acta Physiol (Oxf) 2007;189:171–180. doi: 10.1111/j.1748-1716.2006.01652.x. [DOI] [PubMed] [Google Scholar]
- Ondarza AB, Ye Z, Hulsebosch CE. Direct evidence of primary afferent sprouting in distant segments following spinal cord injury in the rat: colocalization of GAP-43 and CGRP. Exp Neurol. 2003;184:373–380. doi: 10.1016/j.expneurol.2003.07.002. [DOI] [PubMed] [Google Scholar]
- Parish CL, Finkelstein DI, Tripanichkul W, Satoskar AR, Drago J, Horne MK. The role of interleukin-1, interleukin-6, and glia in inducing growth of neuronal terminal arbors in mice. J Neurosci. 2002;22:8034–8041. doi: 10.1523/JNEUROSCI.22-18-08034.2002. [DOI] [PMC free article] [PubMed] [Google Scholar]
- Paxinos G, Watson C. The rat brain in stereotaxic coordinates. Sydney: Academic; 1986. [DOI] [PubMed] [Google Scholar]
- Peckham PH, Knutson JS. Functional electrical stimulation for neuromuscular applications. Annu Rev Biomed Eng. 2005;7:327–360. doi: 10.1146/annurev.bioeng.6.040803.140103. [DOI] [PubMed] [Google Scholar]
- Salimi I, Friel KM, Martin JH. Pyramidal tract stimulation restores normal corticospinal tract connections and visuomotor skill after early postnatal motor cortex activity blockade. J Neurosci. 2008;28:7426–7434. doi: 10.1523/JNEUROSCI.1078-08.2008. [DOI] [PMC free article] [PubMed] [Google Scholar]
- Sandrini G, Serrao M, Rossi P, Romaniello A, Cruccu G, Willer JC. The lower limb flexion reflex in humans. Prog Neurobiol. 2005;77:353–395. doi: 10.1016/j.pneurobio.2005.11.003. [DOI] [PubMed] [Google Scholar]
- Scholz J, Woolf CJ. The neuropathic pain triad: neurons, immune cells and glia. Nat Neurosci. 2007;10:1361–1368. doi: 10.1038/nn1992. [DOI] [PubMed] [Google Scholar]
- Smith HS. Activated microglia in nociception. Pain Physician. 2010;13:295–304. [PubMed] [Google Scholar]
- Tan AM, Colletti M, Rorai AT, Skene JH, Levine JM. Antibodies against the NG2 proteoglycan promote the regeneration of sensory axons within the dorsal columns of the spinal cord. J Neurosci. 2006;26:4729–4739. doi: 10.1523/JNEUROSCI.3900-05.2006. [DOI] [PMC free article] [PubMed] [Google Scholar]
- Tan AM, Petruska JC, Mendell LM, Levine JM. Sensory afferents regenerated into dorsal columns after spinal cord injury remain in a chronic pathophysiological state. Exp Neurol. 2007;206:257–268. doi: 10.1016/j.expneurol.2007.05.013. [DOI] [PMC free article] [PubMed] [Google Scholar]
- Tan AM, Zhao P, Waxman SG, Hains BC. Early microglial inhibition preemptively mitigates chronic pain development after experimental spinal cord injury. J Rehabil Res Dev. 2009;46:123–133. [PubMed] [Google Scholar]
- Tan AM, Chang YW, Zhao P, Hains BC, Waxman SG. Rac1-regulated dendritic spine remodeling contributes to neuropathic pain after peripheral nerve injury. Exp Neurol. 2011;232:222–233. doi: 10.1016/j.expneurol.2011.08.028. [DOI] [PubMed] [Google Scholar]
- Thompson FJ, Parmer R, Reier PJ. Alteration in rate modulation of reflexes to lumbar motoneurons after midthoracic spinal cord injury in the rat. I. Contusion injury. J Neurotrauma. 1998;15:495–508. doi: 10.1089/neu.1998.15.495. [DOI] [PubMed] [Google Scholar]
- Todd AJ, Hughes DI, Polgár E, Nagy GG, Mackie M, Ottersen OP, Maxwell DJ. The expression of vesicular glutamate transporters VGLUT1 and VGLUT2 in neurochemically defined axonal populations in the rat spinal cord with emphasis on the dorsal horn. Eur J Neurosci. 2003;17:13–27. doi: 10.1046/j.1460-9568.2003.02406.x. [DOI] [PubMed] [Google Scholar]
- Tsuda M, Ueno H, Kataoka A, Tozaki-Saitoh H, Inoue K. Activation of dorsal horn microglia contributes to diabetes-induced tactile allodynia via extracellular signal-regulated protein kinase signaling. Glia. 2008;56:378–386. doi: 10.1002/glia.20623. [DOI] [PubMed] [Google Scholar]
- Wolpaw JR. Acquisition and maintenance of the simplest motor skill: investigation of CNS mechanisms. Med Sci Sports Exerc. 1994;26:1475–1479. [PubMed] [Google Scholar]
- Wolpaw JR, Carp JS. Plasticity from muscle to brain. Prog Neurobiol. 2006;78:233–263. doi: 10.1016/j.pneurobio.2006.03.001. [DOI] [PubMed] [Google Scholar]
- Wong ST, Atkinson BA, Weaver LC. Confocal microscopic analysis reveals sprouting of primary afferent fibres in rat dorsal horn after spinal cord injury. Neurosci Lett. 2000;296:65–68. doi: 10.1016/s0304-3940(00)01601-3. [DOI] [PubMed] [Google Scholar]
- Woolf CJ, Shortland P, Coggeshall RE. Peripheral nerve injury triggers central sprouting of myelinated afferents. Nature. 1992;355:75–78. doi: 10.1038/355075a0. [DOI] [PubMed] [Google Scholar]
- Woolf CJ, Shortland P, Reynolds M, Ridings J, Doubell T, Coggeshall RE. Reorganization of central terminals of myelinated primary afferents in the rat dorsal horn following peripheral axotomy. J Comp Neurol. 1995;360:121–134. doi: 10.1002/cne.903600109. [DOI] [PubMed] [Google Scholar]
- Yang HW, Lemon RN. An electron microscopic examination of the corticospinal projection to the cervical spinal cord in the rat: lack of evidence for cortico-motoneuronal synapses. Exp Brain Res. 2003;149:458–469. doi: 10.1007/s00221-003-1393-9. [DOI] [PubMed] [Google Scholar]
- Z'Graggen WJ, Fouad K, Raineteau O, Metz GA, Schwab ME, Kartje GL. Compensatory sprouting and impulse rerouting after unilateral pyramidal tract lesion in neonatal rats. J Neurosci. 2000;20:6561–6569. doi: 10.1523/JNEUROSCI.20-17-06561.2000. [DOI] [PMC free article] [PubMed] [Google Scholar]
- Zhang F, Vadakkan KI, Kim SS, Wu LJ, Shang Y, Zhuo M. Selective activation of microglia in spinal cord but not higher cortical regions following nerve injury in adult mouse. Mol Pain. 2008;4:15. doi: 10.1186/1744-8069-4-15. [DOI] [PMC free article] [PubMed] [Google Scholar]
- Zhao P, Waxman SG, Hains BC. Modulation of thalamic nociceptive processing after spinal cord injury through remote activation of thalamic microglia by cysteine cysteine chemokine ligand 21. J Neurosci. 2007;27:8893–8902. doi: 10.1523/JNEUROSCI.2209-07.2007. [DOI] [PMC free article] [PubMed] [Google Scholar]
- Zhou Z, Peng X, Hagshenas J, Insolera R, Fink DJ, Mata M. A novel cell-cell signaling by microglial transmembrane TNFalpha with implications for neuropathic pain. Pain. 2010;151:296–306. doi: 10.1016/j.pain.2010.06.017. [DOI] [PMC free article] [PubMed] [Google Scholar]
- Zinck ND, Rafuse VF, Downie JW. Sprouting of CGRP primary afferents in lumbosacral spinal cord precedes emergence of bladder activity after spinal injury. Exp Neurol. 2007;204:777–790. doi: 10.1016/j.expneurol.2007.01.011. [DOI] [PubMed] [Google Scholar]