

Abstract
Nonviral vector systems are used increasingly in gene targeting and gene transfer applications. The piggyBac transposon represents an alternative integrating vector for in vivo gene transfer. We hypothesized that this system could achieve persistent gene transfer to the liver when administered systemically. We report that a novel hyperactive transposase generated higher transposition efficiency than a codon-optimized transposase in a human liver cell line. Hyperactive transposase-mediated reporter gene expression persisted at levels twice that of codon-optimized transposase in the livers of mice for the 6-month study. Of note, expression persisted in mice following partial hepatectomy, consistent with expression from an integrated transgene. We also used the hyperactive transposase to deliver the human α1-antitrypsin gene and achieved stable expression in serum. To determine the integration pattern of insertions, we performed large-scale mapping in human cells and recovered 60,685 unique hyperactive transposase-mediated insertions. We found that a hyperactive piggyBac transposase conferred an altered pattern of integration from that of insect piggyBac transposase, with a decreased frequency of integration near transcription start sites than previously reported. Our results support that the piggyBac transposon combined with the hyperactive transposase is an efficient integrating vector system for in vitro and in vivo applications.
Keywords: hepatocyte, liver, mouse, transposase, transposon
Introduction
Integrating vector systems show great potential in treating genetic diseases. Viral vectors can achieve stable, persistent transgene expression and functional correction of disease. However, oncoretroviral integration is increased near transcriptional start sites (TSS), increasing the risk of genotoxicity by insertional mutagenesis.1,2
An alternative to viral gene transfer is use of nonviral integrating vectors.3,4 The well-studied DNA transposon Sleeping Beauty (SB) supports sufficient gene transfer for functional correction in several therapeutic applications.4,5,6,7,8 Moreover, the integration site preference of the SB transposon appears to be very different from retroviral vectors and exhibits no preferential integration into genes.9,10 Modifications to the SB transposase created a hyperactive protein that catalyzes significantly higher transposition in mammalian cells.11,12,13,14
SB can achieve therapeutically relevant gene transfer to the liver,6 supporting the development of transposons for therapeutic gene transfer. The piggyBac DNA transposon (PB), originally isolated from the cabbage looper moth Trichoplusia ni, encodes a transposase (iPB) that is highly active in mammalian cells and integrates at the conserved TTAA tetranucleotide sequence.15,16,17,18 Furthermore, Bradley and Cadiñanos developed a murine codon-optimized PB transposase (mPB) that was 20 times more efficient than iPB in mouse embryonic stem cells.19 Recently, a hyperactive form of PB transposase (hypPB) with seven amino acid substitutions (I30V, S103P, G165S, M282V, S509G, N570S, N538K on mPB) was developed and screened for transposition in yeast and subsequently in mouse embryonic stem cells. The hypPB increased relative integration frequency by nine times over mPB in mouse embryonic stem cells.20 Hyperactive PBs present an alternative to SB for use in gene transfer investigations.
Here we report that iPB with these seven amino acid substitutions (iPB7) generated higher transposition efficiency than mPB transposase in in vitro transposition assays in a human liver cell line. Furthermore, following hydrodynamic delivery in mice, firefly luciferase expression driven by the murine albumin enhancer/human α1 antitrypsin promoter in a PB transposon delivered by mPB persisted at least 8 months (duration of the study). In addition, animals transfected with iPB7 showed higher expression than those transfected with mPB for at least 6 months (duration of study). The human α1 antitrypsin (hAAT) gene under the control of a liver-specific promoter delivered with iPB7 to murine liver achieved stable and persistent hAAT expression. Additionally, we carried out large-scale mapping studies of transposon insertion patterns in human cells. We found an altered pattern of integration from that reported previously for iPB,17,21,22 including a reduced frequency of integration near transcription start sites.
Results
iPB7 efficiently transposes in human hepatoma cells
In mammalian cells, iPB with these seven amino acid substitutions (iPB7) transposes with greater efficiency than the mPB (Figure 1 and Supplementary Figure S1, Supplementary Materials and Methods). To determine the activity of iPB7 in a human liver cell line, Huh-7 cells were co-transfected with a PB transposon cassette carrying the puromycin-resistant gene driven by the cytomegalovirus promoter (pXLBacII_GFPPuro) and the iPB7 transposase (Figure 2). The transposon cassette was transfected alone or with mPB as controls. iPB7 supported twice the transposition efficiency as mPB in Huh-7 cells (Figure 1a). These data indicate iPB7 is active in a human liver cell line.
Figure 1.

Hyperactive piggyBac transposase is active in a human liver cell line. (a) The hepatoma cell line Huh-7 was co-transfected with piggyBac transposon carrying the GFP-puromycin resistance cassette under the control of the CMV promoter and either mPB or iPB7 piggyBac transposase plasmids (1:1 ratio). (b) Transposon and hyperactive transposase constructs were co-transfected in varying ratios (5:1, 2:1, 1:1, 1:2, 1:5 transposon:transposase) in Huh-7 cells. Control cultures were either mock-transfected or transfected with the transposon cassette only. Cells were selected for 3 weeks under puromycin pressure, fixed, stained with methylene blue, and colonies counted. n = 3 for each condition; bars indicate mean ± standard error. *indicates P < 0.05. CMV, cytomegalovirus.
Figure 2.

Schematic representation of constructs used in the study. (a) piggyBac transposon constructs were developed to express CMV-driven GFP together with the puromycin resistance gene (pXLBacII_GFPPuro) and either firefly luciferase or human α1 antitrypsin under the control of the liver-specific murine albumin enhancer/human α1 antitrypsin hybrid promoter. The promoter and transgene are flanked by identical 13-bp inverted terminal repeats which are shaded gray. (b) piggyBac transposase constructs. The murine codon-optimized (mPB) hyperactive (iPB7) or inactive (mPBD268L) were inserted into the mammalian expression vector pcDNA3.1. Asterisks indicate sites of amino acid substitutions; black bars indicate catalytic residues D268, D346, and D447.23,24,25 PB, piggyBac transposase; CMV, cytomegalovirus.
iPB7 exhibits efficient transposition at various ratios
To delineate the effect of varying the abundance of transposon and transposase on gene transfer efficiency, we transfected Huh-7 cells with a fixed concentration of transposon donor plasmid pXLBacII_GFPPuro (100 ng) and varied the amount of iPB7 transposase plasmid to obtain ratios of 1:5, 1:2, 1:1, 2:1, and 5:1 of transposon:transposase plasmids, pXLBacII_GFPPuro:iPB7, respectively. As a control, the transposon cassette alone was transfected. The number of puromycin-resistant colonies at each of 1:5, 1:2, 1:1, and 5:1 transposon:transposase ratios was similar. However, when transposon was added at two times the concentration of iPB7, the number of resistant colonies increased significantly compared to the other ratios tested (P < 0.05) (Figure 1b).
piggyBac-mediated gene transfer persists in vivo
To determine the efficiency and persistence of transgene expression supported by the PB transposases in vivo, 6-week-old Balb/c mice (n = 4 per condition) were transfected hydrodynamically with 25 µg of PB transposon plasmid encoding the firefly luciferase reporter gene driven by a liver-specific promoter and mPB (1:1). As controls, animals received Lactated Ringer's solution or the luciferase transgene PB cassette and a catalytically inactive transposase (mPBD268L). Bioluminescence was monitored at 1-month intervals for 8 months. After 1 month, luciferase expression in mice transfected with mPB was 10 times that of expression in mice transfected with the inactive transposase (Figure 3a,c,e). mPB-mediated expression was stable and persisted for the duration of the study (8 months). This difference was significant (P < 0.001) across all time points when compared to mice receiving inactive transposase. After partial hepatectomy at 5 and 1/2 months, luciferase activity in both groups decreased. When comparing the mean expression levels before (red bracket) and after (black bracket) liver resection, there was no change in expression in animals receiving mPB (P = 0.25). In contrast, there was a significant decrease in mean luciferase expression levels after partial hepatectomy in animals receiving the inactive control transposase (P < 0.005). Luciferase signal decreased tenfold in animals receiving the inactive transposase at the 6-month time point. We note that while there is an apparent increase in luciferase expression following partial hepatectomy in animals receiving the inactive transposase, this increase is not significant. These results are consistent with expression from integrated transgenes in the mPB-treated animals.
Figure 3.

piggyBac gene transfer persists in vivo for up to 8 months and iPB7 mediates increased and sustained expression in vivo. (a) and (b) Timelines of experiments. (c) and (d) Graphical representation of signal intensity from each condition at each time point. Black, blue, and open squares represent mean signal intensity from animals receiving mPB, iPB7, and inactive control transposase, respectively. Imaging data were analyzed, and signal intensity was quantified using Xenogen Living Image software. (c) 25 µg transposon with the liver-specific luciferase expression cassette in a 1:1 ratio with either active or inactive transposase were delivered hydrodynamically to 6-week-old BALB/c mice (month = 0) and luciferase expression monitored noninvasively using bioluminescence imaging. Animals underwent partial hepatectomies at 5 and 1/2 months (arrow). Mice transfected with mPB had significantly higher luciferase signals than mice transfected with the inactive transposase across all time points (*P < 0.001). When comparing the mean expression levels of all time points before liver resection (red brackets) with those after resection (black brackets), there was no change in expression in animals receiving mPB (P = 0.25). In contrast, there was a significant decrease in mean luciferase expression levels after partial hepatectomy in animals receiving the inactive transposase (P < 0.005). n = 4 for each condition; signals normalized to that from naive mice; points indicate mean ± standard error. (d) 5 µg transposon with the liver-specific luciferase expression cassette in a 1:1 ratio with either iPB7 or mPB was delivered hydrodynamically to 6-week-old BALB/c mice (month = 0) and luciferase expression monitored noninvasively using bioluminescence imaging. n = 3 for each condition; signals were normalized to that from naive mice; points indicate mean ± standard error. * indicates P < 0.05 as determined by Student's t-test. (e) and (f) Pseudo colors superimposed on black-and-white image represent signal intensity; max = 30,000 photons/second/cm2, min = 5,000 photons/second/cm2. (e) Representative image from each time point of animals receiving either mPB (top row) or inactive (bottom row) transposase. (f) Representative image from each time point of animals receiving either iPB7 (top row) or mPB (bottom row) transposase.
iPB7 transposase promotes higher expression and persistence than mPB transposase in vivo
To compare the activity of iPB7 to that of mPB in vivo we transfected, via hydrodynamic tail vein injection, 6-week-old Balb/c mice with transposon plasmid containing the firefly luciferase reporter (described previously) and transposase plasmid encoding either iPB7 or mPB. Luciferase expression in animals that received iPB7 was about twice that in animals receiving mPB (Figure 3b,d,f), which correlates well with our in vitro data. Expression persisted at these levels for the duration of the experiment (6 months). These results indicate for the first time that transgene expression from integrated PB transposon delivered with iPB7 transposase is persistent and higher than that of mPB in vivo.
iPB7 can direct secreted protein expression in vivo
As a proof-of-principle experiment to test the utility of iPB7 in stably expressing a therapeutically relevant protein, we delivered a transposon plasmid carrying the human α1 antitrypsin (hAAT) cDNA under the control of a liver-specific promoter with the iPB7 transposase plasmid hydrodynamically (Figure 4). As a negative control, we delivered Lactated Ringer's Solution alone. At periodic intervals, we analyzed serum hAAT concentration by enzyme-linked immunosorbent assay (ELISA). To determine the effect of PB dose in vivo, 5 µg (Figure 4a) or 25 µg (Figure 4b) of transposon plasmid was administered to mice along with varying amounts of iPB7 transposase plasmid (1:1, 2:1, and 5:1 transposon:transposase ratios). Overall, increasing the amount of transposon from 5 µg to 25 µg increased the expression level of hAAT by twofold (P = 0.008). The ratio did not significantly affect the amount of secreted protein (Figure 4c).
Figure 4.

Hyperactive piggyBac transposase-mediated secreted protein gene transfer persists in vivo. (a) 5 µg pXLBacII-albhaathAAT trasponson was given with varying quantities of pcDNA3.1-iPB7 to create an in vivo dose–response curve using ratios of 5:1(shaded triangle), 2:1(gray square), or 1:1(gray diamond) transposon:transposase. DNA was prepared in 2 ml Lactated Ringer's solution and delivered hydrodynamically to 8- to 10-week-old C57BL/6 mice. Serum hAAT concentrations were measured using ELISA. n = 4–6 for each condition; points indicate means plus standard error. (b) 25 µg pXLBacIIalbhaathAAT transposon was given with varying quantities of pcDNA3.1-iPB7 as described above. (c) Serum hAAT concentrations at 3 months. The transposon:iPB7 ratio is indicated just above the horizontal axis and the transposon dose (5 µg or 25 µg) above the ratios. n = 4–6 mice for each condition; points indicate means plus standard error. * indicates P < 0.01. LR, Lactated Ringer's.
Large scale iPB7-mediated integration analysis in human cells
To determine the overall integration pattern of iPB7, we isolated DNA from puromycin-selected HeLa cells containing PB chromosomal insertions and used ligation-mediated PCR to amplify transposon-genome junctions. Deep sequencing was performed using the Solexa Genome Analyzer II (Illumina). We mapped a total of 60,685 unique integrations in HeLa cells. Approximately 52.4% of integrations mapped to RefSeq genes (Table 1). We observed 11 and 13 percent of integration within 5 kb upstream or downstream of TSS and CpG islands, respectively, while 33.3% were found within repeat elements. As a control, we carried out large-scale mapping with wild-type insect PB transposase (17,214 unique integrations). The integration frequencies within genes (50.4%) and near TSS (10.4%) were slightly less than those of iPB7. These differences, though small, were significant (Chi-square test P = 2.97 × 10−06 and 2.78 × 10−04, respectively). iPB integration frequencies near CpG islands (11.5%) and within repeat elements (35.0%) were also significantly different from those of iPB7 (P = 1.30 × 10−04 and 4.60 × 10−05, respectively).
Table 1. Integration frequencies of PB transposase at TTAA target sites in HeLa cells (%).
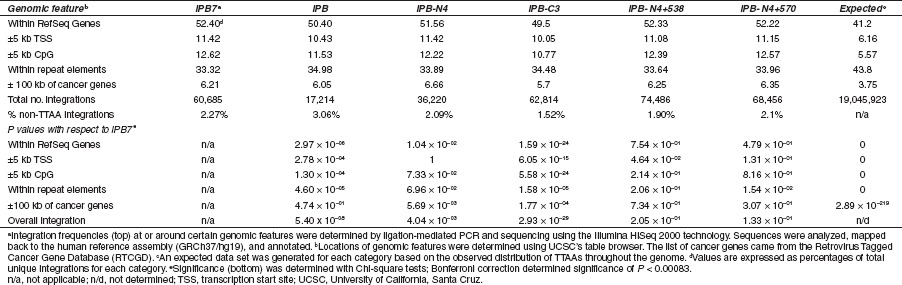
It seemed likely that the differences between iPB and iPB7 integration patterns reflected the amino acid changes in iPB7. To explore this, we carried out large-scale integration mapping studies with transposases containing various combinations of the seven amino acid substitutions in iPB7 (Figure 5). We evaluated a mutant with four N-terminal mutations (iPB-N4). Two of the N4 mutations (I30V and S103P) lie within a nonconserved amino terminal domain of unknown function while the third (G165S) is located in a conserved domain of unknown function. The fourth N-terminal substitution (M282V) occurs in the highly conserved DDE/DDD catalytic domain.23,24 We also tested a mutant with three C-terminal mutations (iPB-C3). Two of the C3 mutations (N570S, N538K) occur within a cysteine-rich domain well conserved among piggyBac family members hypothesized to be a novel zinc finger domain.23,25 We also investigated transposase mutants containing the four N-terminal mutations and each of the N538K and N570S mutations individually (iPB-N4 + 538 and iPB-N4 + 570, respectively). The results are summarized in Table 1. The integration patterns for each mutant were not significantly different with respect to iPB7 with the exception of iPB-C3. We recovered 62,814 integrations from cells treated with iPB-C3. The overall integration pattern for iPB-C3 differed significantly from that of iPB7 (P = 2.93 × 10⁻²⁹). In particular, the frequencies of integration within RefSeq genes, and near TSS and CpG islands were significantly lower than those of iPB7 (Table 1).
Figure 5.

Schematic representation of constructs used in integration study. piggyBac transposase constructs. The hyperactive (iPB7) and various mutant cDNAs were inserted into the mammalian expression vector pcDNA3.1. Asterisks indicate sites of amino acid substitutions; black bars indicate catalytic residues D268, D346, and D447.23,24,25 iPB originates from the looper moth Trichoplusia ni. PB, piggyBac transposase; CMV, cytomegalovirus.
Interestingly, when we relaxed the requirement for integrations recovered at TTAA sequences such that other genomic junction sequences were accepted, we recovered an additional 1,438 integrations (63,318 total) from the iPB7-treated HeLa cells. Thus, about 97.7% of the unique integration junctions were at TTAAs whereas 2.3% were in sequences other than TTAA (Table 1). Moreover, the most common non-TTAA junction sequences recovered were CTAA and TTTA, as well as their complementary sequences. Analysis of the iPB control and various mutants with the relaxed requirement yielded similar results to that of iPB7 (1.5–3% non-TTAA unique integrations). This indicates a preference for TTAA as the site of integration, but not an absolute requirement.
Discussion
Here we report in vivo gene transfer using iPB7 transposase containing seven amino acid substitutions that yield significantly increased integration efficiency when introduced onto the mammalian codon-optimized (mPB) background (hypPB).20 Use of nonviral integrating vector systems presents an attractive option for achieving long-term therapeutic gene transfer. Currently, the most commonly used DNA transposon in therapeutic gene transfer research is SB.4,5,7,8 Several groups reported the generation of SB hyperactive mutants that increased transposition efficiency in human cells over that of wild-type transposase.11,12,13,14 The size limit of SB previously reported11 can be increased about twofold by using the sandwich configuration presented by Zayed et al.14 These studies and others have established the utility of DNA transposons as gene therapy vectors, leading the way to employ other DNA transposons such as piggyBac. Others previously reported that the PB transposase has greater activity than SB transposase,18,19,26,27 which may prove advantageous in gene transfer applications. Recently, Doherty and colleagues demonstrated that hypPB had increased function compared to SB100X, currently the most active form of SB transposase.26 Studies show the efficient integration of cassettes up to 100 kb using PB with little to no decrease in integration efficiency.16,27,28 These differences as well as the persistent, stable in vivo expression supported by iPB7 indicate this transposon/transposase combination offers a useful alternative to other integrating vector systems for therapeutic applications and genome engineering.
Our mPB transposition activity in Huh-7 cells (Figure 1) agree with those previously reported for iPB activity in HepG2 cells.29 These in vitro data reveal that iPB7 transposase significantly increased the frequency of transposition (~twofold). We note the overall transposition efficiency represents ~0.1% of total cells transfected. This is likely due to the poor transfection efficiency of Huh7 cells, but similar to that obtained in previous liver cell line studies.29 These results correlate well with those in vivo in which we observed about twice the luciferase expression in animals receiving iPB7 compared to those receiving mPB. We investigated various ratios and doses of transposon:transposase plasmids in vitro and in vivo. With respect to native iPB transposase, there are conflicting reports concerning the overproduction inhibition phenomenon, in other words, decrease in integration with increased transposase expression.17,18,30 Wu et al. and Grabundzija et al. reported a decrease in efficiency with increasing amounts of transposase18,30 whereas Wilson and colleagues found no evidence of overproduction inhibition under similar conditions.17 Of note, Wu and colleagues reported the most efficient ratio as 2:1 transposon:transposase when using 200 ng transposon. Our results agree with Wu et al. when using 100 ng of transposon. However, we observed no difference in gene transfer efficiency at any ratio in vivo. When we delivered the transgene hAAT with the iPB7 transposase, we demonstrated that a 25 µg dose of PB transposon plasmid achieved twice the plasma levels of hAAT protein compared to the 5 µg dose. Manipulating the various ratios of transposon plasmid to transposase plasmid did not significantly affect the secreted protein abundance (Figure 4). These results correlate well with our in vitro data. Our observations highlight the utility of iPB7 for use in therapeutically relevant applications of a secreted protein.
After delivering a firefly luciferase cDNA to mouse hepatocytes using mPB and monitoring bioluminescence over 8 months, we observed stable expression as noted by others.29,31 At ~60 days post-transfection, Saridey and colleagues reported about fivefold greater luciferase gene expression.31 The lower expression levels in our studies are likely due to the use of a liver-specific promoter as opposed to a cytomegalovirus promoter.32 Additionally, expression levels remained stable over time in animals receiving mPB, even after partial resection of the liver. As liver tissue regeneration in the mouse occurs in 3–7 days,33 persistent reporter gene expression likely arises from integrated form of the transgene. This is important for achieving long-term therapeutic correction.
There are limited reports investigating the integration profile of PB transposase. Previous data suggest that PB has a much lower preference for integration into genes compared to retroviral and lentiviral vectors.34,35,36 To address this, we employed large-scale mapping using deep sequencing technology with iPB7 and native iPB for comparison. We were surprised to observe that the frequency of integration near transcription start sites of both iPB7 and iPB was lower than that reported in the literature. Previous reports indicate that iPB integrates within 5 kb of TSS at a frequency of 16–20% depending on cell type.17,21,22 While our data indicate a lower percentage than previously reported, we acknowledge that a preference for integration near TSS remains. We note that our study mapped integration events in HeLa cells while other reports used HeLa, HEK293T, and human T-cells.17,21,22 These differences could also be due to the methods used to sequence. Previous studies used plasmid recovery whereas we used ligation-mediated PCR followed by Illumina sequencing. The restriction sites used in our studies may have conferred some bias due to size constraints of amplicons generated for the Illumina sequencing platform. These previous data analyses included smaller numbers of unique integrations, thus the greater number of insertions that we analyzed may provide greater confidence in the insertion site preferences. The reduced frequency of PB insertion near transcription start sites suggests a safer profile for therapeutic applications, although further studies are warranted to investigate the safety profile of PB.
We observed significant differences in overall integration patterns between iPB and iPB7. Based on this observation, we hypothesized that the amino acid substitutions might contribute to target DNA integration specificity. Thus, we compared various transposase mutants in large-scale mapping studies. Interestingly, we found a significant difference in integration pattern between the iPB7 and the iPB-C3 mutant, whereas there were no significant differences between the other mutants (iPB-N4, iPB-N4 + 538, iPB-N4 + 570) and iPB7. The integration frequencies near TSS and within RefSeq genes may suggest a safer profile compared to iPB. Additionally, this result supports the observation that the three amino acid residues G509, N538, and N570 in the C-terminus might contribute to integration site preference. Indeed, the presence of a RING/PHD zinc finger domain in the C-terminus indicates that this domain may be involved in chromatin interactions.23,25 These changes are subtle yet statistically significant; it will be interesting to determine their biological relevance by confirming these changes in a different tissue/cell type or through subsequent biochemical assays in vitro. Interestingly, our data also reveal for the first time that PB transposase does not have an absolute requirement for TTAA sequences at the sites of integration. This differs from previous reports indicating that the TTAA tetranucleotide sequence is completely necessary for integration.16 We note that we cannot rule out the possibility that the non-TTAA junction sequences present in our analysis were recovered from transposase-independent integrations. Although given that the majority of such sequences differed in only one nucleotide, this explanation seems unlikely. We propose that these sequences represent activity similar to the nonspecific “star” activity exhibited by some restriction endonucleases.
While PB offers advantages, the reported integration preference near transcription start sites poses a potential hurdle to overcome in adopting this vector system for therapeutic gene transfer applications. Even though it has not been shown, the potential for genotoxicity from integration of the PB transposon near proto-oncogenes remains. It would be beneficial to develop methods of directing integration to a “safe” site(s) in the genome. To that end, it is encouraging that the PB transposase can be modified with DNA binding proteins to potentially redirect integration.37,38 The feasibility of achieving clinically relevant in vivo gene transfer with the iPB7 transposon system is unknown. Our data support the hypothesis that the activity of the iPB7 vector system is sufficiently robust to attain phenotypic correction. To deliver this plasmid-based system in vivo, it may be feasible to administer local hydrodynamic delivery to specific tissues and organs39,40 or pursue ex vivo applications.41 Additionally, packaging the transposon in a viral vector such as an integration-defective lentiviral vector is one option to increase the in vivo delivery efficiency,42,43,44,45 and this can be addressed in future studies. We propose the iPB7 vector system warrants further development for therapeutic applications.
Materials and Methods
Plasmid constructs. mPB was constructed by inserting murine codon-optimized piggyBac transposase cDNA (Gen Bank accession number: EF587698)19 into the EcoRI/XbaI sites of pcDNA3.1 (Invitrogen, Grand Island, NY). All primer sequences used in cloning are listed in Supplementary Table S1. mPBD268L was constructed by mutating two nucleotides in the mPB cDNA via site-directed mutagenesis (Quikchange Site-directed Mutagenesis Kit; Stratagene, Santa Clara, CA) using mPB as template. iPB7, iPB-N4, iPB-C3, iPB-N4 + 538, and iPB N4 + 570 were constructed as described previously.26 To clone pXLBacII_GFPPuro, pXLBacII-Luc, pXLBacII-hAAT a piggyBac transposon plasmid with a multiple cloning site (pXL-BacII-MCS) was constructed by inserting the overlapping oligos nondirectionally into the BclI/PmlI sites of the pXLBacII_cassette.18 The pXLBacII_cassette carries the minimal PB sequences of 308 bp and 238 bp of the 5′ and 3′ ends, respectively.46 pXLBacII_GFPPuro was constructed by inserting a BglII/AgeI fragment containing the cytomegalovirus promoter and GFP-Puromycin resistance gene from the pGIPZ vector (Invitrogen, Grand Island, NY) into the linearized pXLBacIIMCS. To construct pXLBacII-Luc, the EcoRV/XbaI fragment of a mammalian expression vector containing firefly luciferase cDNA driven by the murine albumin enhancer/human α1 antitrypsin hybrid promoter47 was cloned into the EcoRV/XbaI-linearized pXLBacIIMCS. To construct pXLBacII-hAAT, NcoI and AgeI flanking restriction sites were introduced into the human α1 antitrypsin cDNA by PCR amplification from p-T/hAAT, subcloned into pCR2.1-TOPO-TA (Invitrogen, Grand Island, NY). Subsequently, luciferase cDNA was replaced with the NcoI/AgeI fragment of the hAAT cDNA subclone by insertion into the NcoI/AgeI vector fragment of pXLBacII-Luc. As described in Mitra et al.,25 the yeast transposon donor plasmid contained a mini-piggyBac transposon composed of 328 bp of the piggyBac 5′ and 361 bp of the piggyBac 3′ ends flanking a kanamycin resistance gene. The transposase was supplied by a second plasmid containing the piggyBac transposase gene under the galactose-inducible control of the GALS promoter.48
In vitro transposition assay. 200 ng pXLBacII_GFPPuro alone or with 200 ng pcDNA3.1-mPB, pcDNA3.1-iPB7, or pcDNA3.1-mPBD268L was transfected into Huh-7 cells (2 × 10⁵ cells) using TransIT-LT1 reagent (Mirus, Madison, WI) according to the manufacturer's instructions and cultured under puromycin selection (2 µg/ml) for 3 weeks; 100 ng pXLBacII_GFPPuro alone or with varying amounts of pcDNA3.1-iPB7 were transfected into Huh-7 cells (2 × 10⁵ cells) using TransIT-LT1 reagent as above and cultured under puromycin selection (2 µg/ml) for 3 weeks. Investigated ratios (transposon:transposase) included 5:1, 2:1, 1:1, 1:2, and 1:5 in the Huh-7 cell line. Total DNA was normalized to 600 ng between experimental conditions. For each experiment, cells were fixed in 4% paraformaldehyde and counted following 1 hour methylene blue staining.
In vivo gene transfer. All mice for this study were housed at the University of Iowa Animal Care Facilities. All animal procedures were previously approved by the Institutional Animal Care and Use Committee (IACUC) and in accordance with National Institutes of Health guidelines.
Luciferase. 25 µg pXLBacII- Luc in a 1:1 ratio with either pcDNA3.1-mPB or pcDNA3.1-mPBD268L (Figure 3a,c,e) in Lactated Ringer's (2 ml) was delivered hydrodynamically, as previously described39 to 6-week-old Balb/c mice. 5 µg pXLBacII- Luc in a 1:1 ratio with either pcDNA3.1-mPB or pcDNA3.1-iPB7 (Figure 3b,d,f) in Lactated Ringer's (2 ml) was delivered hydrodynamically, as previously described39 to 6-week-old Balb/c mice. In brief, plasmid DNA was prepared in 2 ml of sterile Lactated Ringer's solution at room temperature. Mice (n = 4 in each group) were restrained, and the lateral tail vein was accessed using a 27 gauge needle (Becton Dickinson, Franklin Lakes, NJ). The solution was administrated over 5–8 seconds.
hAAT. Either 5 or 25 µg pXLBacII-hAAT transposon was given with varying quantities of pcDNA3.1-iPB7 to generate an in vivo dose–response curve using ratios of 5:1, 2:1, or 1:1 (triangle, square, or diamond respectfully) for each of the 5 µg and 25 µg amounts. DNA was prepared in 2 ml Lactated Ringer's solution and delivered hydrodynamically to 8- to 10-week-old C57Bl/6 mice (4–6 in each group) as described above.
In vivo bioluminescent imaging. Luciferase expression was monitored noninvasively using bioluminescence imaging. Animals were injected intraperitoneally with 100 µl/10 g of body weight of D-luciferin (Xenogen, Alemeda, CA) (15 mg/ml in phosphate-buffered saline) and anesthetized by isoflurane inhalation. Approximately 5 minutes after luciferin injection, the animals were imaged using a Xenogen IVIS200 CCD camera. Imaging data were analyzed, and signal intensity was quantified using Xenogen Living Image software. Expression levels were normalized by subtracting those from naive (untreated) mice.
Partial hepatectomy. To verify luciferase expression was due to integrated transgenes, partial hepatectomies were performed 5 and 1/2 months after PB luciferase injection. Mice were injected subcutaneously with 25 cc/kg mouse normal saline and 2.5 µg/gm mouse Flunixin prior to start of the procedure. Mice were anesthetized with 2.5–4% isoflurane throughout the procedure. The skin was sterilized with 1% povidone-iodine followed by alcohol. Approximately 50% of the liver including the left lateral and median lobes was resected after a midventral laparotomy. Incisions were closed with 4–0 silk sutures. Four total drops/mouse of bupivacaine were placed on the muscle and skin after closure. Animal mortality following partial hepatectomy was 0%.
In vivo detection of hAAT. Serum hAAT concentrations were measured using ELISA. Microtiter plates were coated with 100 µl of goat anti-hAAT (MP Biomedical, Solon, CA) antibody at a 1/200 dilution in Voller's Buffer and incubated overnight at 4 °C. Plates were blocked in 100 µl of a blocking buffer (1% bovine serum albumin solution) for 2 hours at room temperature. Duplicate standard curves and 100 µl diluted plasma samples (diluted 1:4 in ELISA-phosphate-buffered saline) were incubated for 2 hours at 37 °C. Following sample incubation, plates were incubated with peroxidase-conjugated goat anti-hAAT antibody (Abcam, Cambridge, MA) at a 1/10,000 dilution for 2 hours at 37 °C. The peroxidase activity was expressed by incubation with 100 µl tetramethyl benzidine peroxidase solution. After 3 minutes of development time, the reaction was stopped with 2N H2SO4. The color generated was quantified using a microplate reader (Molecular Devices, Sunnyvale, CA) at 450 nm. Plates were washed in between each reaction with phosphate-buffered saline.
Integration site recovery and illumina sequencing. Integration sites were recovered as described.49 Briefly, HeLa cells (5 × 10⁶) were transfected with 10 µg pXLBacIIGFP_Puro transposon and 2 µg each transposase and selected with puromycin (0.5 µg/ml) for 3 weeks. Genomic DNA from three separate transfections was extracted from the integration library using the DNeasy tissue kit (Qiagen, Valencia, CA). Pooled DNA (2 µg) was digested overnight with ApoI or BstYI at 50 °C and 60 °C, respectively; DNA fragments were purified with the QIAquick PCR purification kit (Qiagen, Valencia, CA) and ligated to ApoI and BstYI linkers overnight at 16 °C. Nested PCR was carried out under stringent conditions using transposon end-specific primers complementary to transposon sequences and linker-specific primers complementary to the DNA linker sequence. Primers and linkers used in this study are listed in Supplementary Table S2. DNA barcodes were included in the second-round PCR primers in order to track sample origin (Supplementary Table S3). The PCR products were gel purified, pooled, and sequenced using the Illumina HiSeq2000 sequencing platform.
Sequence analysis and annotation
Read identification and trimming. Sequences were analyzed using a modified version of the Integration Analysis System (IAS).50 The pipeline was run independently on each lane of sequencing with the following inputs, FASTA file with sequencing reads and a barcode file that contained the barcodes, sample IDs, and the expected flanking sequences. The sequences were split by barcode into sample-specific files. Crossmatch (P. Green, unpublished data) identifies the presence and location of the flanking sequences allowing for them to be trimmed leaving the genomic sequence present.
Mapping and sequence analysis. The samples were mapped back to the human genome reference assembly (GRCh37/HG19) using Bowtie.51 The methods for mapping and annotating are presented in Brett et al. 50 with the following addition. The final annotated sites were collapsed down ± 5 bp from the most frequently seen sites, removing errors in mapping or incorrect trimming of the adaptor sequence. To determine if an integration occurred at a non-TTAA, for each integration site we evaluated the most frequently observed non-TTAA sequence and required that sequence (1) be present in greater than 50% of the reads and (2) match the reference genome.
Comparison of integration rates in genomic features. The location of the genomic features was determined using UCSC's (University of California, Santa Cruz) table browser. Transcription start sites and transcribed regions, CpG islands, and repetitive elements were identified from the refGene, cpgIslandExt, and rmsk tables, respectively (http://genome.ucsc.edu).52 The list of cancer genes came from the Retrovirus Tagged Cancer Gene Database (RTCGD, http://RTCGD.ncifcrf.gov).53 The genomic location of these cancer genes was determined using the refFlat table to determine the transcribed region of the genes. The CpG Islands and transcription start sites were widened to include 5 kb to either side. For each feature, overlapping positions were merged to avoid double counting sites.
Each category of features was evaluated to determine if the rate of integrations differed from expected. The expected rated of integration was determined based upon the relative number of TTAA sites found within the category. The number of integrations in each category was determined using BEDTools54 by intersecting the set of integrations with the genomic loci for the category, as defined above. Only integration sites containing a TTAA were used. A Chi-squared test was used to determine if the integration rate of the samples differed from the expected integration rate. The samples were also compared to iPB7 using a Chi-squared test. A Bonferroni corrected P value of 0.00083 was used for significance.
SUPPLEMENTARY MATERIAL Figure S1. Relative excision frequency of iPB7. Table S1. Primer sequences used in cloning. Table S2. Primers and oligos used for integration library generation. Table S3. Barcodes used in library generation for Illumina sequencing. Materials and Methods.
Acknowledgments
We thank Kathy Keck and Anton McCaffrey (University of Iowa) for technical assistance. We are grateful for the contributions of Joseph Kaminski (NIH), Victor Keng (University of Minnesota), Marie-Ellen Sarvida, Kishore Nannapaneni, Adam Dupuy, and Kathryn Chaloner (University of Iowa). We thank Patrick Sinn (University of Iowa) for critical review of the manuscript. We acknowledge the assistance of the University of California Riverside Institute for Integrative Genome Biology as well as the University of Iowa DNA Sequencing and Central Microscopy Facilities. This work was supported by PO1 HL-51670 (P.B.M.), the Roy J. Carver Charitable Trust (P.B.M.), R44 HL-081976 (P.B.M.), the Bayer Healthcare Early Career Investigator Award (J.M.S.), and HL-007638 (E.R.B.). B.T.B. is funded by the University of Iowa Bioinformatics T32 (NIH GM082729). J.M.S. is funded by the Molecular and Cellular Research to Advance Child Health (NIH HD027748-19). We also acknowledge the support of the Cell Morphology Core at the University of Iowa, partially supported by the Center for Gene Therapy for Cystic Fibrosis (NIH P30 DK-54759) and the Cystic Fibrosis Foundation. N.L.C. is an investigator of the Howard Hughes Medical Institute. The authors declared no conflict of interest.
Supplementary Material
Relative excision frequency of iPB7.
Primer sequences used in cloning.
Primers and oligos used for integration library generation.
Barcodes used in library generation for Illumina sequencing.
REFERENCES
- Hacein-Bey-Abina S, Von Kalle C, Schmidt M, McCormack MP, Wulffraat N, Leboulch P.et al. (2003LMO2-associated clonal T cell proliferation in two patients after gene therapy for SCID-X1 Science 302415–419. [DOI] [PubMed] [Google Scholar]
- Wu X, Li Y, Crise B., and, Burgess SM. Transcription start regions in the human genome are favored targets for MLV integration. Science. 2003;300:1749–1751. doi: 10.1126/science.1083413. [DOI] [PubMed] [Google Scholar]
- Groth AC., and, Calos MP. Phage integrases: biology and applications. J Mol Biol. 2004;335:667–678. doi: 10.1016/j.jmb.2003.09.082. [DOI] [PubMed] [Google Scholar]
- Yant SR, Meuse L, Chiu W, Ivics Z, Izsvak Z., and, Kay MA. Somatic integration and long-term transgene expression in normal and haemophilic mice using a DNA transposon system. Nat Genet. 2000;25:35–41. doi: 10.1038/75568. [DOI] [PubMed] [Google Scholar]
- Aronovich EL, Bell JB, Belur LR, Gunther R, Koniar B, Erickson DC.et al. (2007Prolonged expression of a lysosomal enzyme in mouse liver after Sleeping Beauty transposon-mediated gene delivery: implications for non-viral gene therapy of mucopolysaccharidoses J Gene Med 9403–415. [DOI] [PMC free article] [PubMed] [Google Scholar]
- Hausl MA, Zhang W, Müther N, Rauschhuber C, Franck HG, Merricks EP.et al. (2010Hyperactive sleeping beauty transposase enables persistent phenotypic correction in mice and a canine model for hemophilia B. Mol Ther 181896–1906. [DOI] [PMC free article] [PubMed] [Google Scholar]
- Liu L, Mah C., and, Fletcher BS. Sustained FVIII expression and phenotypic correction of hemophilia A in neonatal mice using an endothelial-targeted sleeping beauty transposon. Mol Ther. 2006;13:1006–1015. doi: 10.1016/j.ymthe.2005.11.021. [DOI] [PubMed] [Google Scholar]
- Ohlfest JR, Demorest ZL, Motooka Y, Vengco I, Oh S, Chen E.et al. (2005Combinatorial antiangiogenic gene therapy by nonviral gene transfer using the sleeping beauty transposon causes tumor regression and improves survival in mice bearing intracranial human glioblastoma Mol Ther 12778–788. [DOI] [PubMed] [Google Scholar]
- Vigdal TJ, Kaufman CD, Izsvák Z, Voytas DF., and, Ivics Z. Common physical properties of DNA affecting target site selection of sleeping beauty and other Tc1/mariner transposable elements. J Mol Biol. 2002;323:441–452. doi: 10.1016/s0022-2836(02)00991-9. [DOI] [PubMed] [Google Scholar]
- Yant SR, Wu X, Huang Y, Garrison B, Burgess SM., and, Kay MA. High-resolution genome-wide mapping of transposon integration in mammals. Mol Cell Biol. 2005;25:2085–2094. doi: 10.1128/MCB.25.6.2085-2094.2005. [DOI] [PMC free article] [PubMed] [Google Scholar]
- Geurts AM, Yang Y, Clark KJ, Liu G, Cui Z, Dupuy AJ.et al. (2003Gene transfer into genomes of human cells by the sleeping beauty transposon system Mol Ther 8108–117. [DOI] [PubMed] [Google Scholar]
- Mátés L, Chuah MK, Belay E, Jerchow B, Manoj N, Acosta-Sanchez A.et al. (2009Molecular evolution of a novel hyperactive Sleeping Beauty transposase enables robust stable gene transfer in vertebrates Nat Genet 41753–761. [DOI] [PubMed] [Google Scholar]
- Yant SR, Park J, Huang Y, Mikkelsen JG., and, Kay MA. Mutational analysis of the N-terminal DNA-binding domain of sleeping beauty transposase: critical residues for DNA binding and hyperactivity in mammalian cells. Mol Cell Biol. 2004;24:9239–9247. doi: 10.1128/MCB.24.20.9239-9247.2004. [DOI] [PMC free article] [PubMed] [Google Scholar]
- Zayed H, Izsvák Z, Walisko O., and, Ivics Z. Development of hyperactive sleeping beauty transposon vectors by mutational analysis. Mol Ther. 2004;9:292–304. doi: 10.1016/j.ymthe.2003.11.024. [DOI] [PubMed] [Google Scholar]
- Cary LC, Goebel M, Corsaro BG, Wang HG, Rosen E., and, Fraser MJ. Transposon mutagenesis of baculoviruses: analysis of Trichoplusia ni transposon IFP2 insertions within the FP-locus of nuclear polyhedrosis viruses. Virology. 1989;172:156–169. doi: 10.1016/0042-6822(89)90117-7. [DOI] [PubMed] [Google Scholar]
- Ding S, Wu X, Li G, Han M, Zhuang Y., and, Xu T. Efficient transposition of the piggyBac (PB) transposon in mammalian cells and mice. Cell. 2005;122:473–483. doi: 10.1016/j.cell.2005.07.013. [DOI] [PubMed] [Google Scholar]
- Wilson MH, Coates CJ., and, George AL., Jr PiggyBac transposon-mediated gene transfer in human cells. Mol Ther. 2007;15:139–145. doi: 10.1038/sj.mt.6300028. [DOI] [PubMed] [Google Scholar]
- Wu SC, Meir YJ, Coates CJ, Handler AM, Pelczar P, Moisyadi S.et al. (2006piggyBac is a flexible and highly active transposon as compared to sleeping beauty, Tol2, and Mos1 in mammalian cells Proc Natl Acad Sci USA 10315008–15013. [DOI] [PMC free article] [PubMed] [Google Scholar]
- Cadiñanos J., and, Bradley A. Generation of an inducible and optimized piggyBac transposon system. Nucleic Acids Res. 2007;35:e87. doi: 10.1093/nar/gkm446. [DOI] [PMC free article] [PubMed] [Google Scholar]
- Yusa K, Zhou L, Li MA, Bradley A., and, Craig NL. A hyperactive piggyBac transposase for mammalian applications. Proc Natl Acad Sci USA. 2011;108:1531–1536. doi: 10.1073/pnas.1008322108. [DOI] [PMC free article] [PubMed] [Google Scholar]
- Galvan DL, Nakazawa Y, Kaja A, Kettlun C, Cooper LJ, Rooney CM.et al. (2009Genome-wide mapping of PiggyBac transposon integrations in primary human T cells J Immunother 32837–844. [DOI] [PMC free article] [PubMed] [Google Scholar]
- Huang X, Guo H, Tammana S, Jung YC, Mellgren E, Bassi P.et al. (2010Gene transfer efficiency and genome-wide integration profiling of Sleeping Beauty, Tol2, and piggyBac transposons in human primary T cells. Mol Ther 181803–1813. [DOI] [PMC free article] [PubMed] [Google Scholar]
- Keith JH, Schaeper CA, Fraser TS., and, Fraser MJ., Jr Mutational analysis of highly conserved aspartate residues essential to the catalytic core of the piggyBac transposase. BMC Mol Biol. 2008;9:73. doi: 10.1186/1471-2199-9-73. [DOI] [PMC free article] [PubMed] [Google Scholar]
- Sarkar A, Sim C, Hong YS, Hogan JR, Fraser MJ, Robertson HM.et al. (2003Molecular evolutionary analysis of the widespread piggyBac transposon family and related “domesticated” sequences Mol Genet Genomics 270173–180. [DOI] [PubMed] [Google Scholar]
- Mitra R, Fain-Thornton J., and, Craig NL. piggyBac can bypass DNA synthesis during cut and paste transposition. EMBO J. 2008;27:1097–1109. doi: 10.1038/emboj.2008.41. [DOI] [PMC free article] [PubMed] [Google Scholar]
- Doherty JE, Huye LE, Yusa K, Zhou L, Craig NL., and, Wilson MH. Hyperactive piggyBac gene transfer in human cells and in vivo. Hum Gene Ther. 2012;23:311–320. doi: 10.1089/hum.2011.138. [DOI] [PMC free article] [PubMed] [Google Scholar]
- Lacoste A, Berenshteyn F., and, Brivanlou AH. An efficient and reversible transposable system for gene delivery and lineage-specific differentiation in human embryonic stem cells. Cell Stem Cell. 2009;5:332–342. doi: 10.1016/j.stem.2009.07.011. [DOI] [PubMed] [Google Scholar]
- Li MA, Turner DJ, Ning Z, Yusa K, Liang Q, Eckert S.et al. (2011Mobilization of giant piggyBac transposons in the mouse genome Nucleic Acids Res 39e148. [DOI] [PMC free article] [PubMed] [Google Scholar]
- Nakanishi H, Higuchi Y, Kawakami S, Yamashita F., and, Hashida M. piggyBac transposon-mediated long-term gene expression in mice. Mol Ther. 2010;18:707–714. doi: 10.1038/mt.2009.302. [DOI] [PMC free article] [PubMed] [Google Scholar]
- Grabundzija I, Irgang M, Mátés L, Belay E, Matrai J, Gogol-Döring A.et al. (2010Comparative analysis of transposable element vector systems in human cells Mol Ther 181200–1209. [DOI] [PMC free article] [PubMed] [Google Scholar]
- Saridey SK, Liu L, Doherty JE, Kaja A, Galvan DL, Fletcher BS.et al. (2009PiggyBac transposon-based inducible gene expression in vivo after somatic cell gene transfer Mol Ther 172115–2120. [DOI] [PMC free article] [PubMed] [Google Scholar]
- Kramer MG, Barajas M, Razquin N, Berraondo P, Rodrigo M, Wu C.et al. (2003In vitro and in vivo comparative study of chimeric liver-specific promoters Mol Ther 7375–385. [DOI] [PubMed] [Google Scholar]
- Taub R. Liver regeneration: from myth to mechanism. Nat Rev Mol Cell Biol. 2004;5:836–847. doi: 10.1038/nrm1489. [DOI] [PubMed] [Google Scholar]
- Cattoglio C, Facchini G, Sartori D, Antonelli A, Miccio A, Cassani B.et al. (2007Hot spots of retroviral integration in human CD34+ hematopoietic cells Blood 1101770–1778. [DOI] [PubMed] [Google Scholar]
- Kang Y, Moressi CJ, Scheetz TE, Xie L, Tran DT, Casavant TL.et al. (2006Integration site choice of a feline immunodeficiency virus vector J Virol 808820–8823. [DOI] [PMC free article] [PubMed] [Google Scholar]
- Beard BC, Dickerson D, Beebe K, Gooch C, Fletcher J, Okbinoglu T.et al. (2007Comparison of HIV-derived lentiviral and MLV-based gammaretroviral vector integration sites in primate repopulating cells Mol Ther 151356–1365. [DOI] [PubMed] [Google Scholar]
- Kettlun C, Galvan DL, George AL, Jr, Kaja A., and, Wilson MH. Manipulating piggyBac transposon chromosomal integration site selection in human cells. Mol Ther. 2011;19:1636–1644. doi: 10.1038/mt.2011.129. [DOI] [PMC free article] [PubMed] [Google Scholar]
- Maragathavally KJ, Kaminski JM., and, Coates CJ. Chimeric Mos1 and piggyBac transposases result in site-directed integration. FASEB J. 2006;20:1880–1882. doi: 10.1096/fj.05-5485fje. [DOI] [PubMed] [Google Scholar]
- Bell JB, Podetz-Pedersen KM, Aronovich EL, Belur LR, McIvor RS., and, Hackett PB. Preferential delivery of the Sleeping Beauty transposon system to livers of mice by hydrodynamic injection. Nat Protoc. 2007;2:3153–3165. doi: 10.1038/nprot.2007.471. [DOI] [PMC free article] [PubMed] [Google Scholar]
- Qiao C, Li J, Zheng H, Bogan J, Li J, Yuan Z.et al. (2009Hydrodynamic limb vein injection of adeno-associated virus serotype 8 vector carrying canine myostatin propeptide gene into normal dogs enhances muscle growth Hum Gene Ther 201–10. [DOI] [PMC free article] [PubMed] [Google Scholar]
- Manuri PV, Wilson MH, Maiti SN, Mi T, Singh H, Olivares S.et al. (2010piggyBac transposon/transposase system to generate CD19-specific T cells for the treatment of B-lineage malignancies Hum Gene Ther 21427–437. [DOI] [PMC free article] [PubMed] [Google Scholar]
- Bayer M, Kantor B, Cockrell A, Ma H, Zeithaml B, Li X.et al. (2008A large U3 deletion causes increased in vivo expression from a nonintegrating lentiviral vector Mol Ther 161968–1976. [DOI] [PMC free article] [PubMed] [Google Scholar]
- Drake DM, Keswani RK., and, Pack DW. Effect of serum on transfection by polyethylenimine/virus-like particle hybrid gene delivery vectors. Pharm Res. 2010;27:2457–2465. doi: 10.1007/s11095-010-0238-z. [DOI] [PubMed] [Google Scholar]
- Mátrai J, Cantore A, Bartholomae CC, Annoni A, Wang W, Acosta-Sanchez A.et al. (2011Hepatocyte-targeted expression by integrase-defective lentiviral vectors induces antigen-specific tolerance in mice with low genotoxic risk Hepatology 531696–1707. [DOI] [PMC free article] [PubMed] [Google Scholar]
- Qasim W, Vink CA., and, Thrasher AJ. Hybrid lentiviral vectors. Mol Ther. 2010;18:1263–1267. doi: 10.1038/mt.2010.76. [DOI] [PMC free article] [PubMed] [Google Scholar]
- Li X, Lobo N, Bauser CA., and, Fraser MJ., Jr The minimum internal and external sequence requirements for transposition of the eukaryotic transformation vector piggyBac. Mol Genet Genomics. 2001;266:190–198. doi: 10.1007/s004380100525. [DOI] [PubMed] [Google Scholar]
- Kang Y, Xie L, Tran DT, Stein CS, Hickey M, Davidson BL.et al. (2005Persistent expression of factor VIII in vivo following nonprimate lentiviral gene transfer Blood 1061552–1558. [DOI] [PMC free article] [PubMed] [Google Scholar]
- Mumberg D, Müller R., and, Funk M. Regulatable promoters of Saccharomyces cerevisiae: comparison of transcriptional activity and their use for heterologous expression. Nucleic Acids Res. 1994;22:5767–5768. doi: 10.1093/nar/22.25.5767. [DOI] [PMC free article] [PubMed] [Google Scholar]
- Wang GP, Ciuffi A, Leipzig J, Berry CC., and, Bushman FD. HIV integration site selection: analysis by massively parallel pyrosequencing reveals association with epigenetic modifications. Genome Res. 2007;17:1186–1194. doi: 10.1101/gr.6286907. [DOI] [PMC free article] [PubMed] [Google Scholar]
- Brett BT, Berquam-Vrieze KE, Nannapaneni K, Huang J, Scheetz TE., and, Dupuy AJ. Novel molecular and computational methods improve the accuracy of insertion site analysis in Sleeping Beauty-induced tumors. PLoS ONE. 2011;6:e24668. doi: 10.1371/journal.pone.0024668. [DOI] [PMC free article] [PubMed] [Google Scholar]
- Langmead B, Trapnell C, Pop M., and, Salzberg SL. Ultrafast and memory-efficient alignment of short DNA sequences to the human genome. Genome Biol. 2009;10:R25. doi: 10.1186/gb-2009-10-3-r25. [DOI] [PMC free article] [PubMed] [Google Scholar]
- Karolchik D, Hinrichs AS, Furey TS, Roskin KM, Sugnet CW, Haussler D.et al. (2004The UCSC Table Browser data retrieval tool Nucleic Acids Res 32Database issueD493–D496. [DOI] [PMC free article] [PubMed] [Google Scholar]
- Akagi K, Suzuki T, Stephens RM, Jenkins NA., and, Copeland NG. RTCGD: retroviral tagged cancer gene database. Nucleic Acids Res. 2004;32 Database issue:D523–D527. doi: 10.1093/nar/gkh013. [DOI] [PMC free article] [PubMed] [Google Scholar]
- Quinlan AR., and, Hall IM. BEDTools: a flexible suite of utilities for comparing genomic features. Bioinformatics. 2010;26:841–842. doi: 10.1093/bioinformatics/btq033. [DOI] [PMC free article] [PubMed] [Google Scholar]
Associated Data
This section collects any data citations, data availability statements, or supplementary materials included in this article.
Supplementary Materials
Relative excision frequency of iPB7.
Primer sequences used in cloning.
Primers and oligos used for integration library generation.
Barcodes used in library generation for Illumina sequencing.