Abstract
There are a number of psychological phenomena in which dramatic emotional responses are evoked by seemingly innocuous perceptual stimuli. A well known example is the ‘uncanny valley’ effect whereby a near human-looking artifact can trigger feelings of eeriness and repulsion. Although such phenomena are reasonably well documented, there is no quantitative explanation for the findings and no mathematical model that is capable of predicting such behavior. Here I show (using a Bayesian model of categorical perception) that differential perceptual distortion arising from stimuli containing conflicting cues can give rise to a perceptual tension at category boundaries that could account for these phenomena. The model is not only the first quantitative explanation of the uncanny valley effect, but it may also provide a mathematical explanation for a range of social situations in which conflicting cues give rise to negative, fearful or even violent reactions.
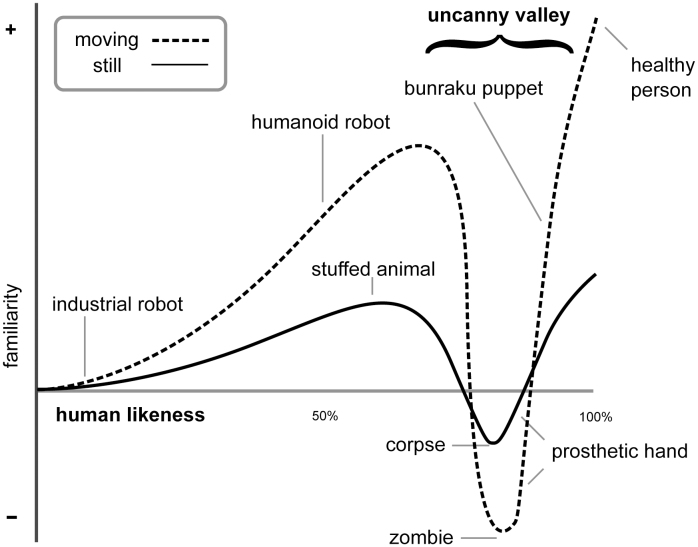
The term ‘uncanny valley’ was coined by Masahiro Mori in 1970 to describe the observation that near-human artifacts can engender strong negative emotions in an observer (Fig. 1)1. For example, Mori noted that viewing a prosthetic hand can trigger feelings of eeriness and repulsion, whereas seeing a genuine human hand or a simple mechanical hand does not. He also proposed that the uncanny valley effect can be stronger when near-human artifacts are moving rather than still (as illustrated by the difference between the two curves illustrated in Fig. 1). Mori's notion of the uncanny valley has entered into popular culture with lifelike artifacts (such as ‘Furby’ - the children's toy), animated films (such as the 2004 feature ‘Polar Express’ starring Tom Hanks), and humanlike robots (such as ‘Geminoid F’) often being described by observers as “strange” or “creepy”. In science and engineering the effect has become of increasing relevance to technical developments in the field of human-machine interaction as the fidelity of interface agents (either on-screen virtual agents or physical humanoid robots) reaches the point where feelings of repulsion could detract from the user experience and inhibit interaction2.
Figure 1. Mori's classic illustration of the uncanny valley effect.
MacDorman and Minato's simplified version34 of the figure appearing in Mori's original Energy article1 illustrating the perceived familiarity of different artifacts ranging in human likeness from an industrial robot to a healthy human being. The ‘uncanny valley’ is shown as a dip in the curves for both still and moving artifacts, with moving artifacts depicted as being judged not only more familiar than still artifacts, but also more uncanny.
Notwithstanding the widespread interest in the uncanny valley hypothesis, only a few studies have provided empirical evidence for its existence3,4,5,6, and several have failed to find the effect at all7,8,9,10. This lack of clear evidence one way or the other maybe due, in part, to some confusion over the precise nature of Mori's dimension of ‘familiarity’11,2,3. In fact, the term Mori used originally to describe his vertical axis - “shinwa-kan” - is a neologism in Japanese, and some authors have suggested that a more accurate translation would be ‘affinity’ rather than ‘familiarity’12 – a proposal that fits well with the results reported here.
A number of accounts have been put forward, both for the effect itself and for why it is sometimes not apparent13,14,15. For example, some studies have suggested a link between ‘eeriness’ and emotional responses associated with fear (particularly of death)3, and this may explain how a potentially universal effect can be obscured by systematic differences between subjects' responses as a function of their personality type and emotional stability16. Other studies have suggested that the effect might arise from a mismatch between different sensory cues11,4, and recent results using fMRI scanning of the brain appear to support this hypothesis17 (as do the results reported here). Overall, the majority of explanations of the uncanny valley effect are based on empirical studies and, apart from a suggestion that it could be characterized using lateral inhibition18, no mathematical model of the core result has been proposed hitherto.
It is hypothesized here that the uncanny valley effect is a particular manifestation of a more general psychological phenomenon in which perception is distorted by categorization19,20. This so-called ‘perceptual magnet effect’21, in which stimuli close to a category boundary are judged by observers to be more dissimilar than stimuli that are away from a category boundary, has recently been characterized mathematically by Feldman et al22 using a Bayesian model of optimal statistical inference. It is proposed here that such an approach could provide the basis for a quantitative account of the uncanny valley effect. However, while Feldman et al's model of categorical perception explains why observers are more sensitive to distinctions at category boundaries, it does not in itself account for why particular stimuli might be perceived as uncanny.
The key, therefore, is the realization that, in the situation where there are multiple perceptual cues to category membership, there is the possibility that the multidimensional perceptual distortions induced at category boundaries could be misaligned. It is thus hypothesized that conflicting perceptual cues can give rise to differential distortion in the region of a category boundary, and that such distortion would be manifest as a form of perceptual ‘tension’. The idea is that such tension may be experienced as physical or emotional discomfort, e.g. feelings of eeriness or creepiness.
Results
Feldman et al's Bayesian model of categorical perception22 has been extended to account for differential perceptual distortion across multiple cues, and the enhanced model confirms that localized perceptual tension can indeed arise from differences in the distributions associated with such cues. In particular, the model reveals that cue conflicts can be manifest as variations in the means and/or variances of their associated distributions or, more interestingly, from unequal levels of uncertainty associated with observing the different perceptual cues. The latter is a particularly compelling result, since it indicates that perceptual tension can arise when the reliability of information derived from alternative cues to category membership is not balanced across different observation dimensions. For example, a humanoid robot might appear to be fully human from the cues provided by the overall facial features, but small anomolous movements in the eyes might be sufficient to increase the uncertainty associated with the category membership of that particular cue, thereby giving rise to perceptual tension (and feelings of discomfort) in the viewer.
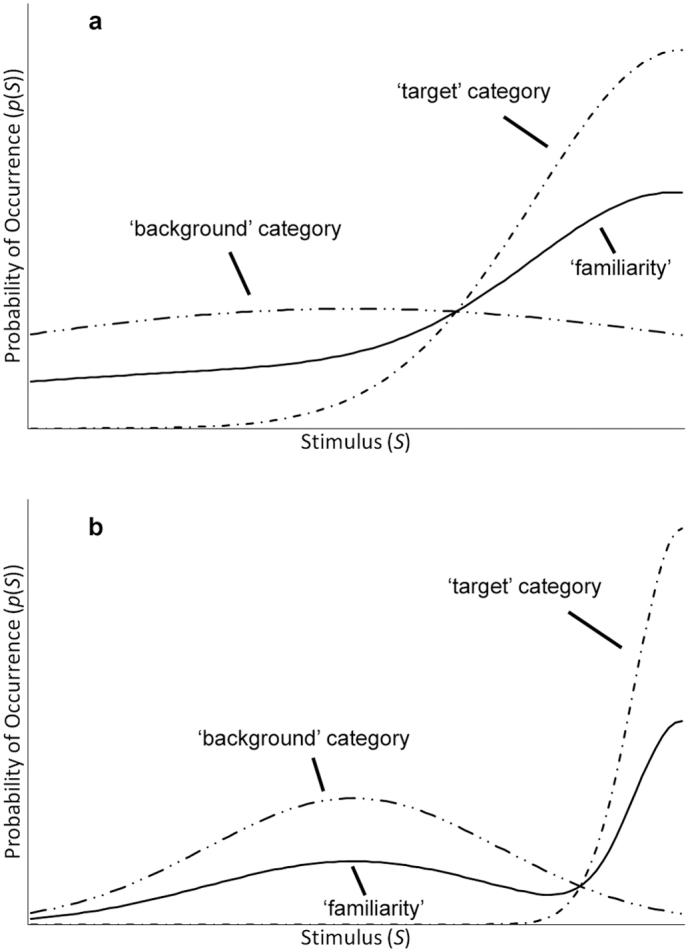
The model shows that, in order to obtain Mori's basic response curve (as illustrated in Fig. 1), it is necessary to posit a category representing a ‘target’ perception (e.g. human) with the mean of its distribution at one end of the stimulus continuum. Then, in order for categorical perception (and the associated distortion of perceptual space) to occur, it is necessary to posit a second category representing a ‘background’ perception (e.g. non-human) whose distribution overlaps that of the target. The model also shows that in order to preserve the more or less monotonic property of the basic response curve (i.e. a rising function that depicts low familiarity at low humanlikeness and high familiarity at high humanlikeness), the distribution for the background needs to be broader than that for the target – an intuitively satisfactory outcome (see Fig. 2a). The model shows that, if the overlap between the target and background categories is reduced, a dip in ‘familiarity’ can be observed at the class boundary (see Fig. 2b). This dip reflects a degree of unfamiliarity (and hence unpredictability) associated with the stimuli around the category boundary. However, such a dip cannot go negative (since the curve represents probability), and does not in itself represent uncannyness. In fact, this intermediate result does indeed capture the concept of ‘familiarity’ but, crucially, not Mori’s notion of ‘affinity’.
Figure 2. Probability of occurrence of different stimuli given a broad ‘background’ category and a narrower ‘target’ category.

a, A large overlap between target and background categories gives rise to a monotonic relationship between the value of a stimulus (horizontal axis) and the probability of occurrence of that stimulus (vertical axis). b, A smaller overlap between categories gives rise to a non-monotonic relationship.
Hence, the model reveals that there are two key variables that relate to Mori's vertical ‘affinity’ axis: (i) the overall probability of occurrence of a particular stimulus, and (ii) any perceptual tension that might arise from conflicting perceptual cues. Not only does this approach lead to the successful prediction of the uncanny valley response curves, it also provides an explanation for the confusion over the nomenclature for Mori's verical axis (as described above). In the model presented here, ‘familiarity’ is defined mathematically as the probability of occurrence of a stimulus, whereas ‘affinity’ (i.e. Mori's vertical axis) is defined as a function of both ‘familiarity’ and ‘perceptual tension’. In particular, it has been found that simply subtracting a weighted measure of perceptual tension from the probability of occurrence of a stimulus predicts the appropriate behaviors rather well. Interestingly, such a weighting factor effectively corresponds to the sensitivity of an observer to any perceived perceptual conflict. If the weighting factor is small or zero, then the implication is that the observer does not notice (or does not care) if perceptual cues are in conflict. If the weighting factor is large, then it indicates a strong sensitivity to differential cues on the part of an observer. The weighting is thus a key property of an observer, not of a stimulus.
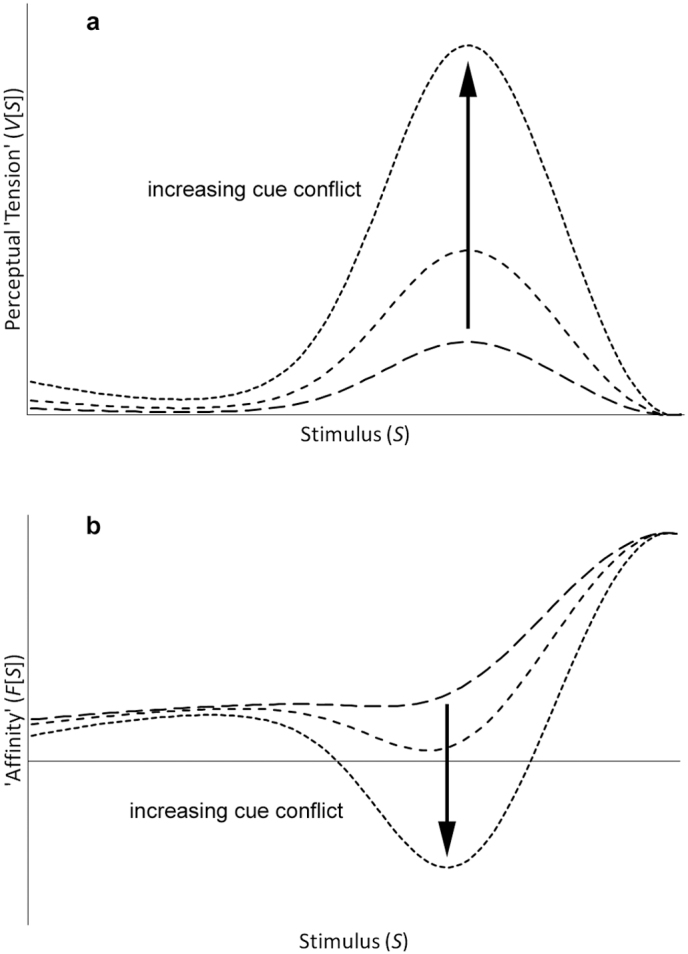
As an illustration of the output of the model, Fig. 3 shows how varying the differential uncertainty associated with cues along two perceptual dimensions (for the distributions illustrated in Fig. 2a) gives rise to different levels of localized perceptual tension (Fig. 3a) and hence to different curves for affinity/eeriness (Fig. 3b). As can be seen, increasing the differential degree of uncertainty between the two cues leads to an increase in perceptual tension and a decrease in the affinity function near the category boundary, with the highest level of differential uncertainty leading to negative affinity. Clearly the shapes of these curves are remarkably similar to those illustrated in Fig. 1, and the affinity measure does indeed appear to correspond to the notion of uncannyness as originally proposed by Mori.
Figure 3. Differential distortions arising from conflicting perceptual cues.

a, Perceptual ‘tension’ increases at the category boundary as a function of differences in the uncertainty associated with different perceptual cues. The degree of tension is proportional to the amount of differential distortion. b, Peaks in perceptual tension give rise to dips in ‘uncannyness’. The depth of the dip is determined by the degree of perceptual tension and the sensitivity of an observer to any perceived perceptual conflict k. In this illustration, k is fixed at a non-zero value.
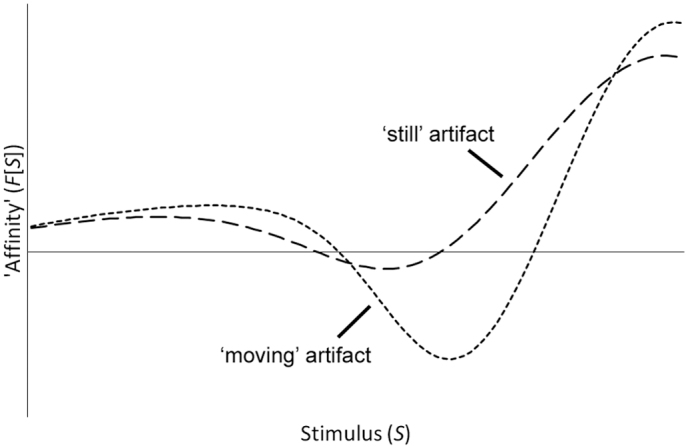
As mentioned above, the other key aspect of Mori's original uncanny valley hypothesis was that a moving humanlike artifact could be perceived as being more uncanny than the corresponding still humanlike artifact. Such a difference may be modeled in a number of different ways, but perhaps the simplest method is to regard a moving artifact as providing clearer information about its category membership, i.e. the distributions associated with a moving target category would be sharper (i.e. have lower variance) than those for a still target category. The output of the model for such a situation is shown in Fig. 4. With all of the other parameters held constant, a decrease in the variance for the target category leads to higher values of affinity either side of the category boundary and a deeper negative-going dip, precisely as predicted by Mori.
Figure 4. Prediction of the Mori curves.

An increase in clarity for the target category (implemented in the model as a reduction of the target variance) leads to a response curve which is higher at the category means and lower at the category boundary. This mimics the difference between ‘still’ and ‘moving’ artifacts illustrated in Mori's original diagram (Fig. 1).
Discussion
One of the core ideas presented here is that the perceptual tension arising from conflicting cues to category membership may be experienced by an observer as physical or emotional discomfort (e.g. ‘creepiness’) which, in turn, may induce the observer to take action in such a way as to reduce its effect. In other words, such perceptual tension could act as an internal control signal that drives an oberver to select one of a number of posssible behaviors: (i) withdraw from the offending article, (ii) attempt to remove it by attacking it, (iii) actively ignore one or more of the conflicting cues (i.e. turning a ‘blind eye’), or (iv) integrate the new information in such a way that the misalignment between category boundaries is reduced (a form of learning that would lead to habituation). Clearly, which of these behavioral strategies is adopted by an observer would depend not only on the characteristics of the stimulus, but also on the personality and drive of the observer.
Indeed, although Mori's original hypothesis (and much of the subsequent research into the uncanny valley effect) has been concerned with the response of human subjects to near-human artifacts such as avatars and humanoid robots, the model derived here provides a more general mathematical explanation (not necessarily unique to human behavior) for a range of real-world situations in which conflicting perceptual cues give rise to negative, fearful or even violent reactions. Possible responses to ambiguous stumuli range from feelings of disgust on encountering food that is off, negative reactions to individuals who are in some way different from the norm (such as ‘coulrophobia’ – fear of clowns), aggrievement at acts of blatant deception, amusement at sensory illusions, or physical illness as a result of sensory conflict23,24.
Such outcomes align well with contemporary theories of emotion such as ‘cognitive appraisal theory’25 in which stimuli are evaluated with respect to a series of evaluation checks26, and the model may also be of some relevance to social theories of group belonging such as social identity theory27 and self-categorization theory28 in which uncertainty associated with inter-group and intra-group categorizations can lead to discriminatory behavior29,30,31. The model may also provide an explanation for the opposite effect, i.e. why reactions to stimuli that are away from category boundaries may be judged as especially attractive32,33.
Methods
Following Feldman et al22, the distortion arising from the perceptual magnet effect along a single dimension can be modeled by a ‘displacement function’
where E[T|S] is the expected value of the perceptual target T given a physical stimulus S. The expected values are derived from the posterior probability of membership of a given category
for each category c, where μc is a category mean,  is a category variance and
  is a measure of the uncertainty associated with observing the signal. Using Bayes' theorem, the posterior probability is given by
which can be modeled using
where N is the normal distribution.
The displacement function D[S] represents a measure of perceptual distortion towards/away from the different categories along the dimension specified by the stimulus S. A non-zero value of D[S] indicates that the perceived position of a particular stimulus S is displaced with respect to its actual physical value; a positive value indicates a distortion in one direction along the stimulus axis, and a negative value indicates a distortion in the opposite direction along the stimulus axis. A D[S] value of zero indicates that no perceptual distortion is present. The derivative of E[T|S] with respect to S is the familiar ‘discrimination function’ – a measure of perceptual warping that corresponds to the enhanced sensitivity to stimuli differences that subjects exhibit at category boundaries.
In the situation where there are multiple dimensions along which stimuli are perceived (multiple cues), any differential perceptual distortion may be calculated using
This expression is essentially a measure of the variance between the distortions present in each individual dimension. Hence V[S] is an indication of the amount of perceptual ‘tension’ that would arise as a result of differential distortions between conflicting perceptual cues. If all perceptual cues are in agreement with respect to the shapes and positions of category boundaries, then V[S] would be zero for all S. If, on the other hand, V[S] is non-zero, then it implies that a particular stimulus S is not fully coherent in its support for the different categories.
Given that V[S] increases with greater perceptual conflict, it is hypothesized that subtracting V[S] from p(S) would provide a parsimonious combination function. In particular
where F[S] corresponds to the vertical ‘affinity’ axis in Mori’s original diagram (Fig. 1), and k is a weighting factor that reflects the sensitivity of an observer to any perceived perceptual conflict.
Acknowledgments
The author would like to thank Dr. Christopher Newell (from the University of Hull), Prof. Chris Melhuish, Prof. Alan Winfield, and Prof. Tony Pipe (from the Bristol Robotics Laboratory), and Dr. Peter Wallis and colleagues (from the Sheffield Centre for Robotics) for stimulating discussions in relation to the uncanny valley phenomenon. The research reported here was supported in part by the following grants: EU-FP6-507422-HUMAINE (Human-Machine Interaction Network on Emotion), EU-FP6-034434-COMPANIONS (Intelligent, Persistent, Personalised Multimodal Interfaces to the Internet), EU-FP7-231868-SERA (Social Engagement with Robots and Agents), EU-FP7-213850-SCALE (Speech Communication with Adaptive LEarning), and EP/I013512/1-CREST (The Creative Speech Technology Network).
References
- Mori M. Bukimi no tani (the uncanny valley). Energy 7, 33–35 (1970). [Google Scholar]
- MacDorman K. F. & Ishiguro H. Opening Pandora's uncanny box. Interaction Studies 7, 361–368 (2006). [Google Scholar]
- MacDorman K. & Ishiguro H. The uncanny advantage of using androids in cognitive and social science research. Interaction Studies 7(3), 297–337 (2006). [Google Scholar]
- Seyama J. The uncanny valley: effect of realism on the impression of artificial human faces. Presence 16(4), 337–351 (2007). [Google Scholar]
- Ho C.-C., MacDorman K. F. & Pramono Z. A. D. (2008).Human emotion and the uncanny valley: A GLM, MDS and isomap analysis of robot video ratings, ACM/IEEE International Conference on Human-Robot Interaction. Amsterdam. [Google Scholar]
- Mitchell W. J. et al. A mismatch in the human realism of face and voice produces an uncanny valley. i-Perception 2(1), 10–12 (2011). [DOI] [PMC free article] [PubMed] [Google Scholar]
- Hanson D., Olney A., Pereira I. A. & Zielke M. Upending the uncanny valley, 20th National Conference on Artificial Intelligence (Vol. 4, pp. 1728–1729). Pittsburgh, PA, USA. (2005). [Google Scholar]
- MacDorman K. F. Subjective ratings of robot video clips for human likeness, familiarity, and eeriness: an exploration of the uncanny valley, CCS/CogSci-2006 Long Symposium: Toward Social Mechanisms of Android Science (pp. 26–29). Vancouver, Canada. (2006). [Google Scholar]
- Bartneck C., Kanda T., Ishiguro H. & Hagita N. My robotic doppelgänger - A critical look at the uncanny valley, The 18th IEEE International Symposium on Robot and Human Interactive Communication (pp. 269–276). Toyama, Japan. (2009). [Google Scholar]
- Thompson J. C., Trafton J. G. & McKnight P. The perception of humanness from the movements of synthetic agents. Perception 40(6), 695–704 (2011). [DOI] [PubMed] [Google Scholar]
- Brenton H., Gillies M., Ballin D. & Chattin D. The uncanny valley: does it exist? 19th British HCI Group Annual Conference: Workshop on Human Animated Character Interaction. Edinburgh, UK. (2005). [Google Scholar]
- Bartneck C., Kanda T., Ishiguro H. & Hagita N. Is the uncanny valley an uncanny cliff?, 16th IEEE International Symposium on Robot and Human Interactive Communication (pp. 368–373). Jeju, Korea. (2007). [Google Scholar]
- Misselhorn C. Empathy with inanimate objects and the uncanny valley. Minds and Machines 19(3), 345–359 (2009). [Google Scholar]
- MacDorman K. F., Green R. D., Ho C.-C. & Koch C. (2009).Too real for comfort: Uncanny responses to computer generated faces. Computers in Human Behavior 25, 695–710. [DOI] [PMC free article] [PubMed] [Google Scholar]
- Pollick F. E. In search of the uncanny valley. In Daras, P. & Ibarra, O. M. (Eds.), User Centric Media (pp. 69– 78). Berlin Heidelberg: Springer. (2010). [Google Scholar]
- Walters M. L., Syrdal D. S., Dautenhahn K., Boekhorst R. T. & Koay K. L. Avoiding the uncanny valley: robot appearance, personality and consistency of behavior in an attention-seeking home scenario for a robot companion. Autonomous Robots 24(2). (2008). [Google Scholar]
- Saygin A. P., Chaminade T., Ishiguro H., Driver J. & Frith C. The thing that should not be: Predictive coding and the uncanny valley in perceiving human and humanoid robot actions. Social Cognitive and Affective Neuroscience 7(4), 413–422. (2011). [DOI] [PMC free article] [PubMed] [Google Scholar]
- Shimada M., Minato T., Itakura S. & lshiguro H. Uncanny valley of androids and its lateral inhibition hypothesis, Robot and Human Interactive Communication (pp. 374–379). Jeju, Korea. (2007). [Google Scholar]
- Liberman A. M., Harris K. S., Hoffman H. S. & Griffith B. C. The discrimination of speech sounds within and across phoneme boundaries. Exp. Psych. 54, 358–368 (1957). [DOI] [PubMed] [Google Scholar]
- Harnad S. (Ed.). Categorical Perception: The Groundwork of Cognition. New York: Cambridge University Press. (1987). [Google Scholar]
- Kuhl P. K. Human adults and human infants show a “perceptual magnet effect” for the prototypes of speech categories, monkeys do not. Percept. Psychophys. 50(2), 93–107 (1991). [DOI] [PubMed] [Google Scholar]
- Feldman N. H., Griffiths T. L. & Morgan J. L. The influence of categories on perception: explaining the perceptual magnet effect as optimal statistical inference. Psychological Review 116(4), 752–782 (2009). [DOI] [PMC free article] [PubMed] [Google Scholar]
- Bles W. et al. (1998). Motion sickness: only one provocative conflict? Brain Research Bulletin 47(5), 481–487. [DOI] [PubMed] [Google Scholar]
- Warwick-Evans L. A., Symons N., Fitch T. & Burrows L. Evaluating sensory conflict and postural instability. Theories of motion sickness. Brain Res. Bull. 47(5), 465–469 (1998). [DOI] [PubMed] [Google Scholar]
- Smith C. A. & Lazarus R. Emotion and adaptation. In L. A. Pervin (Ed.), Handbook of Personality: theory and research (pp. 609–637). New York: Guildford Press. (1990).
- Scherer K. R., Schorr A. & Johnstone T. (Eds.). Appraisal Processes in Emotion: Theory, Methods, Research. New York and Oxford: Oxford University Press. (2001). [Google Scholar]
- Tajfel H. & Turner J. C. The social identity theory of intergroup behavior. In S. Worchel & W. G. Austin (Eds.), Psychology of Intergroup Relations (pp. 7–24). Chicago, IL: Nelson-Hall. (1986).
- Turner J. C., Hogg M. A., Oakes P. J., Reicher S. D. & Wetherell M. S. Rediscovering the Social Group: A Self-Categorization Theory. Oxford: Blackwell. (1987). [Google Scholar]
- Tafjel H. & Turner J. C. An integrative theory of intergroup conflict. In W. G. Austin & S. Worchel (Eds.), The Social Psychology of Intergroup Relations (pp. 33–47). Monterey, CA: Brooks/Cole. (1979).
- Smith E. R. Social identity and social emotions: Toward a new conceptualization of prejudice. In Mackie, D. M. & Hamilton, D. L. (Eds.), Affect, Cognition, and Stereotyping (pp. 297–315). San Diego, CA: Academic Press. (1993).
- Grieve P. G. & Hogg M. A. Subjective uncertainty and intergroup discrimination in the minimal group situation. Personality and Social Psychology Bulletin 25, 926–940 (1999). [Google Scholar]
- Langlois J. H. & Roggman L. A. Attractive faces are only average. Psychol. Sci. 1, 115–121 (1990). [Google Scholar]
- Bruckert L. et al. Vocal attractiveness increases by averaging. Current Biology 26, 116–120 (2010). [DOI] [PubMed] [Google Scholar]
- MacDorman K. F., Minato T., Shimada M., Itakura S., Cowley S. J. & Ishiguro H. Assessing human likeness by eye contact in an android testbed. Proceedings of the XXVII Annual Meeting of the Cognitive Science Society. Stresa, Italy. (2005). [Google Scholar]


