Abstract
Many biological tissues are piezoelectric and pyroelectric with spontaneous polarization. Ferroelectricity, however, has not been reported in soft biological tissues yet. Using piezoresponse force microscopy, we discover that the porcine aortic walls are not only piezoelectric, but also ferroelectric, with the piezoelectric coefficient in the order of 1 pm/V and coercive voltage approximately 10 V. Through detailed switching spectroscopy mapping and relaxation studies, we also find that the polarization of the aortic walls is internally biased outward, and the inward polarization switched by a negative voltage is unstable, reversing spontaneously to the more stable outward orientation shortly after the switching voltage is removed. The discovery of ferroelectricity in soft biological tissues adds an important dimension to their biophysical properties, and could have physiological implications as well.
Piezoelectricity, where the electric field and mechanical deformation are linearly coupled, was first discovered in bones in 1957 [1–3], and was subsequently reported in many biological tissues and systems [4–10]. A subset of piezoelectrics is known as pyroelectric with spontaneous polarization, and such pyroelectricity was observed in bones and tendons in 1966 [11] and later in other biological tissues as well [12–15]. Inorganic and synthetic pyroelectric materials are often ferroelectric with spontaneous polarization switchable by electric field; however, five decades after the first report of pyroelectricity in bones and tendons, ferroelectricity in soft biological tissues has yet to be observed. Here we show that porcine aortic walls are not only piezoelectric but also ferroelectric, confirmed by their hysteresis and butterfly loops characteristic of polarization reversal. The discovery of ferroelectricity in soft biological tissues adds an important dimension to their biophysical properties and physiological functions [16], and could have far-reaching pathological implications in cardiovascular and other diseases as well.
The ability to switch the polarization of inorganic and synthetic ferroelectrics is essential to many technological applications, and the biological significances of piezoelectricity and pyroelectricity are widely recognized [15,17,18]. Given seemingly ubiquitous piezoelectricity in biological tissues, it is quite surprising that no ferroelectricity has been observed in soft biological tissues yet, though its potential biological significances have been postulated [16,19], and switching behavior has recently been reported in hard seashells [8]. Piezoresponse force microscopy (PFM) is a powerful tool to probe electromechanical coupling in piezoelectric and ferroelectric systems at nanoscale [20–23], and in recent years, it has been applied to study a variety of biological tissues and materials. These include human bones [24] and teeth [25], tooth dentin and enamel [26,27], collagen fibrils [28–30], and insulin and lysozyme amyloid fibrils, breast adenocar-cinoma cells, and bacteriorhodopsin [31], as summarized in a recent review [22]. While these studies unambiguously established piezoelectricity in biological tissues at nanoscale, biological ferroelectricity remains elusive. Switching PFM experiments have been attempted on single collagen fibrils, from which it was concluded that they are not ferroelectric, as neither PFM amplitude nor PFM phase varies with dc bias [26,27]. Since electromechanical coupling of collagens is believed to underpin the piezoelectricity observed in bones and other biological tissues [28,29], this seems explain the lack of ferroelectricity in soft biological tissues so far.
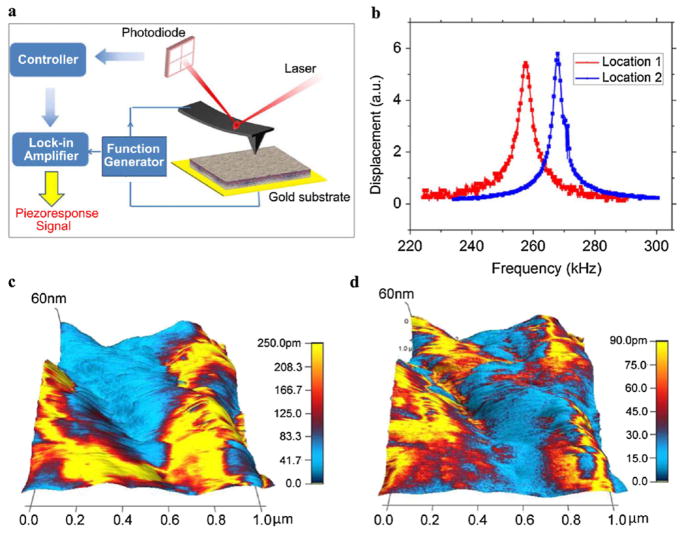
In order to search for ferroelectricity in soft biological tissues, we carried out piezoresponse force microscopy (PFM) studies on porcine aortic walls. Tissue samples were dried prior to PFM analysis, as seen in Fig. S1(a) in the supplementary information [32], with thickness of approximately 0.82 mm. The aortic wall consists of three layers of intima, media, and adventitia [33], as observed in the Movat pentachrome stained histology image in Fig. S1(b). The intima consists of a monolayer of endo-thelial cells; the media layer is composed of concentric rings of elastin fibers, collagen, and smooth muscle cells; and a network of collagen and fibroblast cells makes up the adventitia. Atomic force microscopy (AFM) topography mappings of the inner wall in Figs. S1(c) and S1(d) show the hierarchical fibrous structure composed of fine globular features, similar to previous observations [34]. Piezoresponse force microscopy (PFM) was used to measure the piezoelectric effect at the inner wall, by applying an ac voltage through the conductive AFM tip to excite the piezoelectric vibration of the sample, as schematically shown in Fig. 1(a). Since the piezoresponse for typical biological tissues is extremely small, we drove the ac voltage near the resonant frequency of the cantilever-sample system to enhance the sensitivity, and the corresponding piezoresponse versus driving frequency at two different locations are shown in Fig. 1(b), exhibiting clear resonance peaks at different frequencies. This allows us to magnify the piezoresponse by orders of magnitude, and using such a technique, both vertical response measuring normal strain and lateral response measuring shear strain were recorded [35]. Typical amplitude mappings of vertical and lateral PFM of aortic wall overlaid on three-dimensional (3D) topography are shown in Figs. 1(c) and 1(d), with vertical amplitude as high as 250 pm while lateral amplitude in the same area less than 90 pm, both acquired under a 3 Vac voltage. Higher lateral piezoresponse than vertical one has also been observed in other regions. This is distinct from previous PFM studies on collagens [28,29], where only lateral responses have been observed. It is also noted that the aortic wall is very soft, and contact scanning tends to modify the surface topography slightly, as shown by three consecutive scans in a same area in Fig. S2 of the supplementary information [32]. The phase contrasts in Fig. S2 is also observed to evolve during scanning, and this is the first indication that the aortic wall could be ferroelectric.
FIG. 1.
(color online). PFM of inner aortic wall; (a) schematics of PFM; (b) piezoresponse as a function of frequency at two different locations; and mappings of (c) vertical and (d) lateral PFM amplitude overlaid on 3D topography in a 1 × 1 μm2 area; the ac frequency was set to be 265.43 kHz for vertical PFM and 888.57 kHz for lateral PFM.
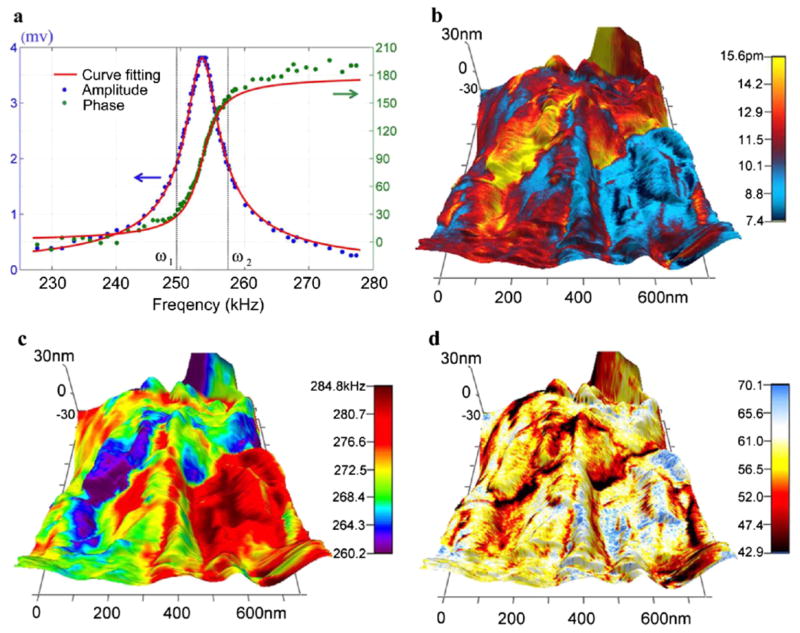
The large piezoresponse is impressive considering the modest driving voltage, yet it is not intrinsic since it is enhanced by resonance. Substantial variations in amplitude mapping are observed in both vertical and lateral PFM, and it is not clear whether such variation is due to the change in piezoelectricity or is caused by variation in resonance frequency instead. As seen in Fig. 1(b), the resonant frequency at different locations can be quite different, which can result in considerable reduction in piezoresponse magnification when the driving ac voltage is locked at a particular frequency. To avoid such a problem and enable quantitative piezoresponse analysis of aortic walls, we adopt a dual frequency resonance tracking (DFRT) technique [36], which measures the piezoresponse at two distinct frequencies across resonance, and use the amplitude difference at these two frequencies for feedback control, as illustrated in Fig. 2(a) using actual experimental data. This allows us to track the resonance frequency when it shifts during scanning. Furthermore, the cantilever-sample system can be regarded as a damped harmonic oscillator, with the amplitude and phase at a particular frequency given by [37]
FIG. 2.
(color online). Quantitative PFM of inner aortic wall by DFRT; (a) schematics of DFRT with actual experimental data; and mapping of PFM (b) amplitude, (c) resonant frequency, and (d) quality factor in a 700 × 700 nm2 area, all overlaid on 3D topography.
which is confirmed by fittings of experimental data shown in Fig. 2(a). As a result, measurements at two distinct frequencies allow us to solve for amplitude and phase at resonance, as well as the resonant frequency and quality factor. This makes it possible to determine the intrinsic piezoresponse mapping by correcting the resonance magnification using quality factor, as shown in Fig. 2(b), with the uncorrected amplitude mapping given in Fig. S3 [32]. It is evident that the intrinsic piezoresponse is substantially smaller after correction, with the maximum amplitude less than 16 pm, despite a relative large driving votage of 22 V. This leads to an estimate of piezoelectric coefficient in the order of 1 pm/V, 2 orders of magnitude larger than that reported by Fukada and Hara for blood vessel walls measured at macroscopic scale [10], yet is comparable with PFM measurement on other tissues [22]. Although variation in PFM amplitude is still observed in Fig. 2(b), the range of variation from 7 to 16 pm is much smaller because of the resonance tracking, suggesting that the large variation seen in Fig. 1(c) is not intrinsic. Such an ability to track the resonance is critical, since resonant frequency indeed varies from 260 to 285 kHz, as seen in Fig. 2(c), which reflects contact stiffness changes resulted from structure heterogeneity. Variation in quality factor ranging from 40 to 70 is also observed, as shown in Fig. 2(d), and this reflects difference in energy dissipation at different locations. For all these mappings, no correlation with topography is observed, and it appears that the high piezoresponse region tends to have smaller resonant frequency and quality factor, and thus is softer. Little variation in phase contrast mapping is observed, as shown in Fig. S3, suggesting that the polar distribution in the probed area shows little spatial variation and exhibits no domain structures, though large phase contrast is also observed in other areas, as shown in Fig. S2.
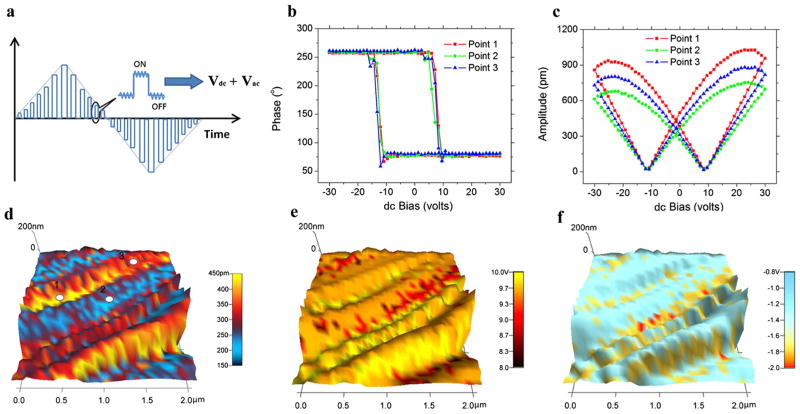
To verify the ferroelectricity in aortic walls, we applied a sequence of dc voltages in triangle sawtooth form to the sample in an attempt to switch its polarization, as shown in Fig. 3(a), with a 3 V ac voltage simultaneously applied to measure the corresponding piezoresponse. In order to minimize the effects of electrostatic interactions, the piezoresponse is measured during “off” state at each step, and phase-voltage hysteresis loop is evident, as shown in Fig. 3(b) for three representative loops measured at different points. Reversal in the piezoresponse phase occurs when a coercive voltage is exceeded, approximately 8.4 Von positive side and −10.8 V on negative side, which are rather modest considering the thickness of the sample, and the phase contrast is approximately 180º, a clear indication of polarization switching. Associated with the phase reversal, amplitude-voltage butterfly loops are also observed, as shown in Fig. 3(c), which saturates at a relatively high voltage, suggesting that the response is piezoelectric instead of electrostatic, and thus the phase reversal does signal polarization switching and ferroelectricity. This is also confirmed by the corresponding loops measured during “on” state, as shown in Fig. S4 of [32], where the coercive voltage is substantially smaller with the help of dc voltage, and the responses are more than 150% higher than those measured during off state and do not saturate at high voltage, due to strong contributions from electrostatic interactions. The differences between on and off states are evident, confirming the phase reversal observed during off state is indeed ferroelectric. While the effects of ionic dynamics, electrocapillary phenomena, or electret like behavior could not be completely excluded, we expect their contribution to be minimal, since the tissue is dry, and the hysteretic characteristics due to ionic dynamics observed in electrochemical system are quite different [38]. In addition, the ferroelectricity of aortic wall appears to be insensitive to the structure heterogeneity at the area probed, as revealed by switching spectroscopy piezoresponse force microscopy (SSPFM) studies [39]. Hysteresis and butterfly loops similar to those in Figs. 3(b) and 3(c) were obtained on a grid of 32 × 32 points over 2 × 2 um2 area, and the resulting mapping of piezoresponse amplitude at zero dc voltage is shown in Fig. 3(d), overlaid on a chainlike topographic structure consisting of fine globular features. Alternating fibrous chains with high and low piezoresponse are observed, with high response in the range of 280–430 pm and low response in the range of 170–220 pm. The mapping of coercive voltage is shown in Fig. 3(e), ranging from approximately 8 to 10 V with little variation, and the high response chains appear to have slightly higher coercive voltage. It is also observed from Figs. 3(b) and 3(c) that the hysteresis and butterfly loops are slightly asymmetric toward negative voltage, and the resulting piezoresponse amplitude is slightly higher at positive saturation voltage. Such switching asymmetry appears to be common in the area probed, as shown by the mapping of nucleation bias in Fig. 3(f), which is defined as the average of positive and negative coercive voltages obtained from SSPFM. For most of the grid points, the nucleation bias is around − 1.2 V.
FIG. 3.
(color online). Ferroelectric switching of inner aortic wall by PFM; (a) schematics of switching PFM; (b) phase-voltage hysteresis loop and (c) amplitude-voltage butterfly loop measured at three different points; SSPFM mapping of (d) remnant PFM amplitude, (e) coercive voltage, and (f) nucleation bias in a 2 × 2 μm2 area.
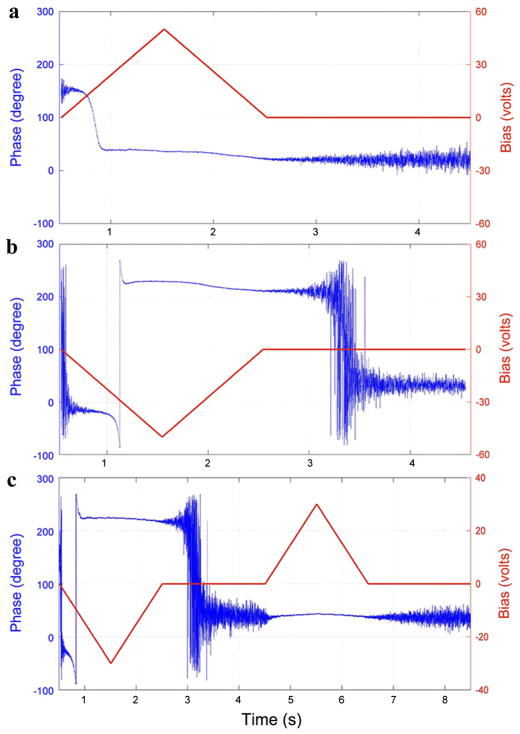
The asymmetry in nucleation bias during switching suggests that the polarization in aortic wall is internally biased outward, which is consistent with negative potential in the inner walls measured in vivo previously reported [40]. To verify this, we applied a sequence of triangle dc voltages as shown in Fig. 4, and measured the corresponding phase changes in the process, especially its relaxations after removal of the dc voltage. When a positive dc voltage is applied, as shown in Fig. 4(a), a phase change occurs when the coercive voltage is reached, and after removal of the dc voltage, no phase flip is observed, suggesting that the polarization switched by a positive voltage is stable. On the other hand, if a negative dc voltage is applied instead, as shown in Fig. 4(b), a phase change again occurs when the coercive voltage is reached, but shortly after removal of this dc voltage, a 180°phase flip is observed, suggesting that the polarization switched by a negative voltage is not stable, and reverses to more stable orientation spontaneously after removal of the negative voltage. If a positive dc voltage is applied after the negative voltage, as shown in Fig. 4(c), then this positive voltage will not change the phase after it is reversed spontaneously, confirming that the spontaneously reversed polarization is indeed stable. We expect such bias originates from asymmetries in underlying molecular structures, and similar polarity in amorphous inorganic oxide has also been reported [41].
FIG. 4.
(color online). Variation of PFM phase with respect to time under triangle dc voltages, showing relaxation and stability of polarization switched by (a) positive, (b) negative, and (c) negative and positive dc voltages.
It has been proposed that piezoelectric and pyroelectric effects are universal in all living organisms, and are closely related to their morphological and physiological properties [28]. Ferroelectricity in soft biological tissues, however, has not been observed until this study. Using PFM, we showed that porcine aortic wall is not only piezoelectric, but also ferroelectric with a modest coercive voltage. In addition, the polarization switched by a negative voltage is not stable, and will reverse spontaneously to a more stable orientation shortly after removal of the negative voltage, suggesting that the polarization in aortic wall is internally biased outward. Furthermore, it is worth pointing out that we also observed piezoelectricity and ferroelectricity in the outer aortic walls, and different moisture levels in dried tissues do not seem to change the qualitative observation of switching; more systematic study on the effects of hydration is currently undergoing. These phenomena could have important implications for blood vessel walls. For example, it has been shown that when a voltage is applied to reverse the potential of intima in viva, thrombosis of the vessels is often observed [40], suggesting a possible link between thrombosis and ferroelectrricity in blood vessel walls. It has also been hypothesized that ferroelectricity could play an important role in atherosclerosis [19], since cholesterol is polar, and their deposition on blood vessel walls could be regulated by different polarities of the wall. The discovery of ferroelectricity in blood vessel walls adds an important dimension to the biophysical properties of blood vessel wall, which could lead to the development of new methods in prevention and treatment of cardiovascular diseases as well as new considerations in tissue engineering for regenerative medicine. The underlying biomolecu-lar origin of ferroelectricity in aortic walls, though not yet clear, could also help to understand ubiquitous electromechanical coupling in biological systems.
Supplementary Material
Acknowledgments
J. Y. L. acknowledges the support from National Science Foundation (DMR 1006194 and CMMI 1100339) and Army Research Office (W911NF-07-1-0410). Y. M. L. acknowledges partial support of a UIF Fellowship from the Center for Nanotechnology, University of Washington. NQC acknowledges the support of NASA Space Technology Research Fellowship (11-NSTRF11-0323). Y. H. Z. acknowledges the support from National Science Foundation (CAREER 0954825 and CMMI 1100791) and National Institute of Health (HL098028).
References
- 1.Fukada E, Yasuda I. J Phys Soc Jpn. 1957;12:1158. [Google Scholar]
- 2.Bassett CAL, Becker RO. Science. 1962;137:1063. doi: 10.1126/science.137.3535.1063. [DOI] [PubMed] [Google Scholar]
- 3.Shamos MH, Shamos MI, Lavine LS. Nature (London) 1963;197:81. doi: 10.1038/197081a0. [DOI] [PubMed] [Google Scholar]
- 4.Braden M, et al. Nature (London) 1966;212:1565. doi: 10.1038/2121565a0. [DOI] [PubMed] [Google Scholar]
- 5.Athenstaedt H. Archives of Oral Biology. 1971;16:495. doi: 10.1016/0003-9969(71)90194-4. [DOI] [PubMed] [Google Scholar]
- 6.Fukada E, Ueda H. Jpn J Appl Phys. 1970;9:844. [Google Scholar]
- 7.Zilberst RM. Nature (London) 1972;235:174. [Google Scholar]
- 8.Li T, Zeng K. Acta Mater. 2011;59:3667. [Google Scholar]
- 9.Morris RW, Kittlema LR. Science. 1967;158:368. doi: 10.1126/science.158.3799.368. [DOI] [PubMed] [Google Scholar]
- 10.Fukada E, Hara K. J Phys Soc Jpn. 1969;26:777. [Google Scholar]
- 11.Lang SB. Nature (London) 1966;212:704. [Google Scholar]
- 12.Athenstaedt H. Nature (London) 1970;228:830. doi: 10.1038/228830a0. [DOI] [PubMed] [Google Scholar]
- 13.Lang SB, Athenstaedt H. Science. 1977;196:985. doi: 10.1126/science.196.4293.985. [DOI] [PubMed] [Google Scholar]
- 14.Athenstaedt H, Claussen H, Schaper D. Science. 1982;216:1018. doi: 10.1126/science.6177041. [DOI] [PubMed] [Google Scholar]
- 15.Athenstaedt H. Ann NY Acad Sci. 1974;238:68. doi: 10.1111/j.1749-6632.1974.tb26780.x. [DOI] [PubMed] [Google Scholar]
- 16.Lang SB. IEEE Trans Dielectr Electr Insul. 2000;7:466. doi: 10.1109/TDEI.2009.5293935. [DOI] [PMC free article] [PubMed] [Google Scholar]
- 17.Shamos MH, Lavine LS. Nature (London) 1967;213:267. doi: 10.1038/213267a0. [DOI] [PubMed] [Google Scholar]
- 18.Marino AA, Becker RO. Nature (London) 1970;228:473. doi: 10.1038/228473a0. [DOI] [PubMed] [Google Scholar]
- 19.Boldrini P. J Theor Biol. 1980;87:263. doi: 10.1016/0022-5193(80)90360-4. [DOI] [PubMed] [Google Scholar]
- 20.Kalinin SV, Rar A, Jesse S. IEEE Trans Ultrason Ferroelectr Freq Control. 2006;53:2226. doi: 10.1109/tuffc.2006.169. [DOI] [PubMed] [Google Scholar]
- 21.Gruverman A, Kalinin SV. J Mater Sci. 2006;41:107. [Google Scholar]
- 22.Kalinin SV, et al. Annu Rev Mater Res. 2007;37:189. [Google Scholar]
- 23.Bonnell DA, et al. MRS Bull. 2011;34:648. [Google Scholar]
- 24.Halperin C, et al. Nano Lett. 2004;4:1253. [Google Scholar]
- 25.Gruverman A, et al. Biochem Biophys Res Commun. 2007;352:142. doi: 10.1016/j.bbrc.2006.10.182. [DOI] [PubMed] [Google Scholar]
- 26.Kalinin SV, et al. Appl Phys Lett. 2005;87:053901. [Google Scholar]
- 27.Rodriguez BJ, et al. J Struct Biol. 2006;153:151. doi: 10.1016/j.jsb.2005.10.008. [DOI] [PubMed] [Google Scholar]
- 28.Minary-Jolandan M, Yu MF. ACS Nano. 2009;3:1859. doi: 10.1021/nn900472n. [DOI] [PubMed] [Google Scholar]
- 29.Harnagea C, et al. Biophys J. 2010;98:3070. doi: 10.1016/j.bpj.2010.02.047. [DOI] [PMC free article] [PubMed] [Google Scholar]
- 30.Minary-Jolandan M, Yu MF. Nanotechnology. 2009;20:085706. doi: 10.1088/0957-4484/20/8/085706. [DOI] [PubMed] [Google Scholar]
- 31.Kalinin SV, et al. Nanotechnology. 2007;18:424020. doi: 10.1088/0957-4484/18/42/424020. [DOI] [PubMed] [Google Scholar]
- 32.See Supplemental Material at http://link.aps.org/supplemental/10.1103/PhysRevLett.108.078103 for a description of experimental methods, and four supplementary figures.
- 33.Alford PW, Humphrey JD, Taber LA. Biomechanics and Modeling in Mechanobiology. 2008;7:245. doi: 10.1007/s10237-007-0101-2. [DOI] [PMC free article] [PubMed] [Google Scholar]
- 34.Raspanti M, et al. Micron. 2006;37:81. doi: 10.1016/j.micron.2005.06.002. [DOI] [PubMed] [Google Scholar]
- 35.Eng LM, et al. J Appl Phys. 1998;83:5973. [Google Scholar]
- 36.Rodriguez BJ, et al. Nanotechnology. 2007;18:475504. [Google Scholar]
- 37.Sader JE. J Appl Phys. 1998;84:64. [Google Scholar]
- 38.Balke N, et al. Nature Nanotech. 2010;5:749. doi: 10.1038/nnano.2010.174. [DOI] [PubMed] [Google Scholar]
- 39.Jesse S, Baddorf AP, Kalinin SV. Appl Phys Lett. 2006;88:062908. [Google Scholar]
- 40.Sawyer PN, Pate JW. Am J Physiol. 1953;175:103. doi: 10.1152/ajplegacy.1953.175.1.103. [DOI] [PubMed] [Google Scholar]
- 41.Frenkel AI, et al. Phys Rev Lett. 2007;99:215502. doi: 10.1103/PhysRevLett.99.215502. [DOI] [PubMed] [Google Scholar]
Associated Data
This section collects any data citations, data availability statements, or supplementary materials included in this article.


