

Abstract
The present experiments investigated how several different sources of stimulus variability within speech signals affect spoken-word recognition. The effects of varying talker characteristics, speaking rate, and overall amplitude on identification performance were assessed by comparing spoken-word recognition scores for contexts with and without variability along a specified stimulus dimension. Identification scores for word lists produced by single talkers were significantly better than for the identical items produced in multiple-talker contexts. Similarly, recognition scores for words produced at a single speaking rate were significantly better than for the corresponding mixed-rate condition. Simultaneous variations in both speaking rate and talker characteristics produced greater reductions in perceptual identification scores than variability along either dimension alone. In contrast, variability in the overall amplitude of test items over a 30-dB range did not significantly alter spoken-word recognition scores. The results provide evidence for one or more resource-demanding normalization processes which function to maintain perceptual constancy by compensating for acoustic–phonetic variability in speech signals that can affect phonetic identification.
INTRODUCTION
The spectral and temporal properties of speech signals that distinguish phonetic categories can be substantially altered by factors such as phonetic context (Liberman et al., 1967), stress (Klatt, 1976), vocal-tract size and shape (Fant, 1973; Joos, 1948; Peterson and Barney, 1952), and speaking rate (Miller, 1981, 1987a). Consequently, changes in one or more of these factors can alter the perception and categorization of speech signals (Johnson and Strange, 1982; Lade-foged and Broadbent, 1957; Peterson and Barney, 1952; Pickett and Decker, 1960; Port, 1976; Summerfield and Haggard, 1972; Verbrugge et al., 1976; Weenink, 1986). Lade-foged and Broadbent (1957), for example, reported that identification of a target vowel embedded in a carrier phrase could be altered by changing the perceived source characteristics (vocal-tract size and shape) of items immediately preceding it. Port (1976) provided evidence for a similar effect with speaking rate by demonstrating that distinctions between long and short vowels depended upon the prevailing articulation rate; at faster speaking rates, shorter overall stimulus durations were needed for listeners to perceive a long vowel. Summerfield (1981) extended these findings to consonantal distinctions by demonstrating that voiced–voiceless judgments for syllable-initial stops were also determined in a rate-dependent manner; the same voice-onset-time (VOT) value could signal a voiceless, rather than a voiced, stop at faster speaking rates.
Taken together, these studies illustrate one of the principal challenges facing any speech recognition system: Inherent variability in the acoustic realization of phonetic items, due to factors such as alterations in speaking rate and source characteristics, results in a many-to-one mapping between acoustic waveforms and phonetic categories (Liberman et al., 1967; Miller and Liberman, 1979; Repp, 1982). Human listeners, however, appear to have little or no difficulty in understanding speech produced at several different articulation rates or by many distinct talkers. Traditionally, theories of speech perception have accounted for this ability to maintain perceptual constancy despite differences in the acoustic waveform by positing a stage of perceptual normalization1 during which listeners compensate for acoustic–phonetic variability in the speech signal and derive a standardized abstract phonetic representation which can then be matched to canonical forms stored in long-term memory (Joos, 1948; Ladefoged and Broadbent, 1957; Lieberman, 1973).
Despite the importance of normalization processes for maintaining perceptual constancy, relatively few investigations have been directed at examining how resolving acoustic–phonetic variability might affect spoken-word recognition. Recently, however, several experiments (Martin et al., 1989; Mullennix et al., 1989; Mullennix and Pisoni, 1990) have been designed explicitly to evaluate the effects of increased acoustic–phonetic variability on perceptual processing. The rationale for such studies is that increasing acoustic–phonetic variability, by introducing variations in one or more stimulus dimensions (such as changing from single to multiple talkers), increases the processing resources required for spoken-word recognition by imposing greater demands on the perceptual normalization system. The increased processing requirements might be reflected in poorer performance on a number of speech-perception measures such as reduced identification scores, increased response latencies, or reduced memory capacities.
Several experiments examining vowel perception (Assmann et al., 1982; Ladefoged and Broadbent, 1957; Summerfield and Haggard, 1972) have demonstrated reduced identification scores and slower reaction times for stimuli produced by multiple, as opposed to single, talkers (however, see Verbrugge et al., 1976 for arguments against the significance of talker variability in vowel identification). More recent experiments have reported that trial-to-trial variations in talker characteristics resulted in poorer word recognition scores and longer response latencies relative to conditions in which the identical words were produced by a single talker (Martin et al., 1989; Mullennix et al., 1989; Mullennix and Pisoni, 1990). Mullennix et al. (1989) argued that because alterations in talker characteristics can affect phonetically important properties of the speech signal, such as formant frequencies, listeners must devote extra time and resources to compensate for the increased amounts of talker variability. As a result, identification performance was reduced because fewer processing resources were available for phonetic judgments.
The results of Mullennix et al. (1989) raise the possibility that variability along other dimensions of the speech signal might also affect perceptual identification. As noted earlier, one factor that has been demonstrated to influence phonetic categorization is speaking rate (Miller and Liberman, 1979; Port, 1976; Port and Dalby, 1982; Summerfield and Haggard, 1972). Miller and Liberman (1979), for example, synthesized a consonant-vowel (CV) continuum that ranged from /ba/ to /wa/ by systematically increasing the duration of the initial formant transitions; stimuli with shorter transition durations were perceived as /ba/ while those with longer transitions were perceived as /wa/. They found that the category boundary for the /ba/-/wa/ continuum could be altered by changing the duration (perceived rate) of the steady-state portion of the syllable. For members of the continuum near the category boundary, therefore, a specific transition duration could be perceived as either /ba/ or /wa/ depending on the duration of the stimulus. Given that changes in articulation rate during conversational speech can be quite substantial (Miller et al., 1984), the Miller and Liberman (1979) data suggest that listeners must actively compensate for acoustic–phonetic variations arising from changes in speaking rate.
In addition to studies demonstrating rate-dependent processing using measures of phonetic categorization, several experiments (Johnson and Strange, 1982; Verbrugge and Shankweiler, 1977) have examined the effects of speaking-rate variability on the perceptual identification of vowels. Johnson and Strange (1982), for example, found better identification performance for rapidly articulated long vowels when the stimuli were presented in sentences produced at the same (rapid) speaking rate as the vowel than when the vowel and sentence were spoken at different rates. Little or no evidence is available, however, regarding whether similar effects of speaking-rate variability would be observed for isolated word identification.
One goal of the present set of experiments, therefore, was to study how variability in articulation rate affects spoken-word recognition. In addition, we were interested in examining whether combining different sources of stimulus variability would reduce identification performance to a greater extent than if the stimuli varied along only a single dimension. If greater stimulus variability increases the processing requirements for perceptual normalization, then combining two different sources of variability might have a greater effect on word recognition than conditions in which either source is varied independently. Lastly, we wanted to establish whether variability along any stimulus dimensions would reduce identification performance. If all sources of stimulus variability have comparable effects on spoken-word identification, then variability-dependent decrements in identification scores may be due either to the effects of increased stimulus uncertainty or to changes in selective attention rather than to greater demands on perceptual normalization.
To address this last issue, experiment 2 examined the effects of varying overall amplitude on spoken-word recognition. Although no direct evidence is available regarding the perceptual consequences of absolute level differences on identification performance for suprathreshold stimulus presentations, varying overall amplitude does not alter properties of the speech signal that are important for distinguishing phonetic categories. Therefore, minimal, if any, processing resources should be devoted to normalizing for variability along phonetically irrelevant stimulus dimensions such as overall level and such variations would be expected to have only small effects on perceptual identification. In contrast, if the effects of stimulus variability are due primarily to increased attentional demands or greater stimulus uncertainty, then both speaking rate and overall amplitude variations would be expected to produce significant reductions in identification scores. Experiment 2 examined the importance of selective attention and stimulus uncertainty in accounting for poorer spoken-word recognition as a function of increased stimulus variability by comparing the effects of variability in speaking rate and overall amplitude on perceptual identification scores.
I. EXPERIMENT 1
The first part of experiment 1 was designed to replicate the findings of Mullennix et al. (1989) using a different set of stimulus materials. Mullennix et al. investigated the effects of talker variability on spoken-word recognition using stimulus items from the modified rhyme test (MRT) (House et al., 1965). The present study was designed to determine whether their findings would generalize to stimulus materials with a more varied syllable structure. In addition, the results obtained with talker variability provided a basis for quantitative comparisons with the second part of the experiment, which examined the effects of speaking-rate variability on identification performance. Finally, the last part of experiment 1 investigated whether the combined effects of speaking-rate and talker variability would produce greater decrements in word recognition scores than variations along either dimension alone.
A. Methods
1. Subjects
198 students from the Psychology Department at Indiana University served as subjects. Ten of the subjects recorded the stimulus material and the remainder participated in the perceptual experiments. All subjects were native speakers of English and reported no history of a speech or hearing disorder at the time of testing. Subjects received course credit for participating.
2. Stimulus materials
The stimuli used in experiment 1 consisted of 100 words taken from two 50-item phonetically balanced (PB) word lists (ANSI, 1971). All 100 words were embedded in the carrier phrase “Please say the word ____ .” The sentences were presented to subjects on a CRT screen located in a sound-attenuated booth (IAC 401 A).
Ten different talkers (six males and four females) produced each of the 100 sentences at three different speaking rates. At the beginning of each session, subjects were told that they would have to produce sentences at three separate speaking rates (fast, medium, and slow). Other than indicating that the different rates should be distinct, no additional instructions regarding speaking rate were given. Sentences were recorded in blocks of 100 with speaking rate remaining constant within a block. The order in which the sentences were produced within a block was determined randomly. Ten practice sentences were presented at the beginning of each block to allow subjects to become accustomed to producing items at the rate specified for that block. The order in which subjects recorded the different rates was determined randomly. Productions were monitored via a speaker located outside the recording booth and if mispronunciations occurred, the sentence was rerecorded.
The stimuli were transduced with a Shure (SM98) microphone, digitized on-line [12-bit analog-to-digital converter (DT2801) at a sampling rate of 10 kHz], low-pass filtered at 4.8 kHz, and stored digitally on disk. Target words were edited from the carrier phrase and the rms amplitude levels of all stimuli were equated using a signal-processing software package (Luce and Carrell, 1981). Average durations for the isolated words were 905, 533, and 375 ms for the slow, medium, and fast items, respectively.
3. Procedure
a. General identification paradigm
Subjects were tested in groups of five or fewer in a sound treated room. On each trial, subjects sat facing a CRT terminal and a warning signal (“GET READY FOR NEXT TRIAL”) was presented in the center of the screen. The warning signal remained on for 500 ms. A 500-ms silent interval occurred between the end of the warning signal and stimulus presentation. Stimuli were presented binaurally over matched and calibrated TDH-39 headphones at approximately 80 dB SPL. Subjects were instructed to type the word they thought they heard onto the CRT screen using a keyboard. No feedback was given to subjects following a response. A 2-s ISI began after the last person had responded. Only exact phonetic matches to the item presented were counted as correct responses. Stimulus output and data collection were controlled on-line by a PDP-ll/34a computer. Stimuli were output via a 12-bit D/A converter at a 10-kHz sampling rate and were low-pass filtered at 4.8 kHz.
b. Intelligibility measures
To ensure comparable intelligibility of items across both talkers and speaking rates, 30 groups of four to five listeners each were asked to identify all 100 words produced by one of the ten talkers at a single speaking rate. Thus, each of the 100 productions by a single talker at a given speaking rate were identified in quiet by four to five different listeners. The intelligibility measures were obtained using the general perceptual identification paradigm outlined above. The fast-rate items from one female talker were excluded from the database2 because average intelligibility scores for these items were greater than two standard deviations below the mean for fast-rate words produced by the other nine talkers. Analyses of all remaining scores indicated that intelligibility measures did not differ significantly as a function of either speaking rate or individual talker.
c. Perception of speaking-rate differences
To determine whether listeners perceived three distinct speaking rates for each talker, a separate group of 50 subjects was asked to judge the speaking rate of the 300 stimuli (100 items × 3 speaking rates) produced by individual talkers (five subjects judged the speaking rate of stimuli produced by each of the ten talkers). Items were presented in quiet and subjects were instructed to press one of three buttons indicating whether they thought the word was produced at a fast, medium, or slow speaking rate. Correct rate judgments (i.e., judgments matching the speaking rate designated during stimulus recording) averaged 82%, 81%, and 76% for the slow, medium, and fast items, respectively. Correct rate judgments did not differ significantly as a function of either speaking rate or talker.
d. Stimulus variability along a single dimension
All perceptual tests measuring the effects of stimulus variability on spoken-word recognition were conducted in a background of white noise to avoid ceiling effects on identification performance. Four signal-to-noise (S/N) ratios (+5, 0, −5, and −10) were tested in each condition. The noise was generated using a noise generator (Grason Stadler, 901B) and was gated on and off coincident with presentation of the speech stimuli.
In the single-talker condition, 19 subjects were tested using four different voices (two male and two female). Ten of the subjects heard words produced by male voices (five subjects for each male talker) and nine listeners heard items produced by female talkers. Nineteen subjects were also tested in the mixed-talker condition. These listeners heard the same words as subjects in the single-talker condition but the voice of the talker or any given trial was selected randomly from among the ten different voices (six male and four female). Four of the voices used in the mixed-talker condition were the ones presented to subjects in the single-talker context. In both the single- and mixed-talker conditions, all of the words were presented at the medium speaking rate.
In the single speaking-rate condition, three groups of 15 subjects were tested. Seven subjects in each group heard 100 items produced at a single rate (fast, medium, or slow) by a male talker and eight subjects heard the items produced by a female talker. For the mixed-rate condition, there were a total of 45 subjects3 and speaking rate was varied randomly from trial to trial. Stimulus sets were constructed such that a given word was presented at one of the three speaking rates to one-third of the subjects. In addition, half the listeners heard words produced at given rate by a male talker and half heard the same items produced by a female talker.
e. Combined effects of rate and talker variability
In the final part of experiment 1, an additional 60 subjects were recruited to compare identification performance when word lists varied along a single dimension (either speaking rate or talker characteristics) to conditions in which items varied along both dimensions simultaneously. Twenty subjects were tested in each of the three conditions (mixed talker, mixed rate, or mixed talker and mixed rate). The mixed-talker and mixed-rate conditions were identical to those described previously. In the last condition (combined variability), both speaking rate and talker varied randomly from trial to trial. Thus words could be presented at any one of the three speaking rates and by any one of the ten talkers.4
B. Results and discussion
Identification scores for all conditions tested in experiment 1 are shown in Fig. 1. Scores for the −10 S/N ratio were consistently below 10% and in most instances averaged less than 5%. Data from this S/N ratio were therefore excluded from subsequent analyses since they almost certainly reflect floor effects due to excessive masking of the stimulus items.
FIG. 1.
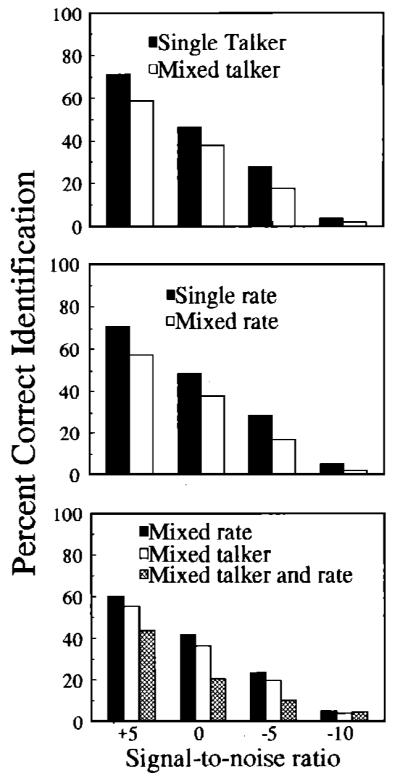
(top) Percent correct identification as a function of signal-to-noise ratio for single-talker (solid bars) and mixed-talker (open bars) word lists, (middle) Same as above except bars are for single- and mixed-rate word lists, (bottom) Solid and open bars are for mixed-rate and mixed-talker lists, respectively. Hatched bars arc for conditions in which rate and talker varied simultaneously.
The top panel of Fig. 1 compares identification scores for the single- and mixed-talker conditions as a function of S/N ratio. A mixed-design ANOVA with voice (male versus female talker) as a between-subjects factor and S/N ratio (+5, 0, −5) as a within-subjects factor was performed on the data from the single-talker condition. No significant main effect or interaction was observed for voice. Therefore, the data for the single-talker condition have been collapsed across male and female talkers. A second mixed-design ANOVA with stimulus variability (single versus mixed talker) as a between-subjects factor and S/N ratio ( +5, 0, −5) as a within-subjects factor revealed a significant main effect of variability [F(l, 36)=164.46, p<0.001]; identification scores were poorer for words presented in mixed-talker lists than for the same words presented in single-talker contexts. There was also a significant main effect of S/N ratio [F(2, 72) = 377.1 66, p<0.001 ]; words presented at higher S/N ratios were recognized more accurately than words presented at lower S/N ratios. The interaction of variability and S/N ratio was not significant.
The middle panel of Fig. 1 compares identification performance for word lists produced with single- and mixed-speaking rates. Separate analyses of the single- and mixed-rate conditions revealed no significant main effect or interactions of speaking rate;5 for both the single- and mixed-rate contexts, identification scores did not differ significantly as a function of speaking rate at any of the S/N ratios tested. Therefore, the data at each S/N ratio have been combined across speaking rates. A three-way ANOVA was conducted on the data with between-subjects factors of stimulus variability (single- versus mixed-speaking rates) and voice (male versus female) and within-subjects factor of S/N ratio ( +5, 0, −5). The results have been collapsed across male and female talkers because no significant main effect or interactions were found for voice. Significant main effects were obtained for stimulus variability [F(l, 88) = 28.83, p<0.005] and S/N ratio [F( 2, 176) = 192.573, p<0.001]. Thus words presented in mixed-rate lists were identified less accurately than the same words presented in single-rate lists and words presented at lower signal-to-noise ratios were correctly identified less often than items presented at higher S/N ratios. None of the remaining interactions reached significant levels.
The bottom panel of Fig. 1 contrasts the effects of combined talker and rate variability with the effects of independent variations in each dimension. A mixed-design ANOVA with between-subjects factor of stimulus variability (mixed talker, mixed rate, combined talker, and rate variability) and within-subjects factor of S/N ratio ( +5, 0, −5) was conducted on the data. For the mixed-rate and combined variability conditions, the data at each S/N ratio have been averaged across the three speaking rates. For all three conditions, the data have been averaged across male and female talkers. A significant main effect of stimulus variability was observed [F(2, 57) = 47.21, p<0.001], Tukey HSD post hoc analyses revealed a significant difference between the mixed-talker and combined variability condition and between the mixed-rate and combined variability condition (p <0.001 for both comparisons). The differences between the mixed-talker and mixed-rate conditions did not reach significance. A significant main effect of S/N was also observed [F(2, 114)= 153.32, p<0.001], No other significant effects were obtained.
The findings from experiment 1 replicate and extend earlier work on the effects of stimulus variability on spoken-word recognition (Creelman, 1957; Mullennix et al., 1989). Mullennix et al. (1989) found poorer identification performance in noise for a subset of stimulus items taken from the modified rhyme test when the words were produced by multiple talkers compared to when the same words were spoken by a single talker. The present study demonstrated comparable declines in identification scores due to talker variability for stimuli with a more varied syllable structure (phonetically balanced word lists) than those found in the MRT. More importantly, the present results demonstrated that variability in speaking rate can also reduce identification performance for isolated words presented in noise. In addition, the final part of experiment 1 found that spoken-word recognition was significantly worse when items varied simultaneously along two perceptual dimensions—speaking rate and talker characteristics—than when either source was varied independently.
Taken together, the findings of the first experiment are consistent with the proposal (Goldinger et al., 1991; Mullennix et al., 1989; Mullennix and Pisoni, 1990) that listeners use a set of resource-demanding processes to normalize or compensate for acoustic–phonetic variability that results from differences in talker characteristics or speaking rate. As additional demands are placed on the perceptual normalization system (e.g., varying both rate and talker simultaneously), more processing resources must be devoted to compensating for the increased acoustic–phonetic variability. Consequently, fewer perceptual resources are available for phonetic identification and spoken-word recognition scores are reduced accordingly.
An alternative explanation for the effects of stimulus variability on identification performance, however, is that introducing variability into the speech signal simply diverts attention from the phonetic content of the stimuli. That is, trial-to-trial changes in speaking rate or talker characteristics may cause listeners to pay greater attention to the variable stimulus dimensions and less to the actual phonetic content of the message. According to this proposal, any source of variability in the speech signal should reduce identification scores if it is perceptually salient. In contrast, theoretical accounts suggesting that variability-related decrements in spoken-word recognition are due to greater demands on the perceptual normalization system would predict that sources of variability which do not directly affect phonetic identification, and therefore may require little or no normalization, should have significantly less effect on recognition performance than variability along stimulus dimensions that have direct phonetic consequences. Experiment 2 was designed to distinguish these two explanations (selective attention versus perceptual normalization) in accounting for the effects of stimulus variability on identification performance.
II. EXPERIMENT 2
Experiment 2 compared the effects of introducing variability along two different stimulus dimensions, speaking rate and overall amplitude, on spoken-word recognition. Speaking rate is both perceptually salient—as demonstrated by the 75%–80% correct speaking-rate judgments obtained for the stimuli used in experiment 1—and can have direct effects on phonetic identification (Miller and Liberman, 1979). Therefore, both attention- and normalization-based accounts of reduced identification performance as a function of increased stimulus variability would predict that trial-to-trial variations in speaking rate should reduce word recognition scores. In contrast, as noted above, although no direct evidence is available regarding the effects of absolute amplitude changes on identification performance for suprathresh-old presentations of isolated words, overall level variations do not affect stimulus properties that are important for phonetic identification. According to the normalization hypothesis, therefore, variations in overall amplitude should have less of an effect on identification performance than trial-to-trial changes in speaking rate because listeners would be required to devote few, if any, processing resources to compensate for variations in stimulus dimensions, such as overall amplitude, that do not directly alter phonetic judgments.6 At-tentional accounts of reduced word recognition scores due to increased stimulus variability, on the other hand, would predict similar effects of amplitude and speaking-rate variability since both perceptual dimensions are salient to listeners and both should divert attention from the phonetic content of items. Experiment 2 tested these two hypotheses.
A. Methods
1. Subjects
180 undergraduate students at Indiana University served as subjects. All subjects were native speakers of English and reported no history of speech or hearing disorders at the time of testing. Each subject participated in a 1-h test session and received partial course credit.
2. Stimulus materials
The stimuli for experiment 2 consisted of the 300 words (100 PB words × 3 speaking rates) produced by one male and one female talker in the first study. The effects of overall amplitude variability on spoken-word recognition were evaluated using the 100 medium-rate items from these two talkers. Overall amplitude levels were controlled with a signal-processing program that adjusted the rms amplitude of digital files to specified values (Luce and Carrell, 1981). Three rms amplitude levels were used in this experiment: 35, 50, and 65 dB. Thus a given stimulus item could be presented at any one of three overall amplitudes spanning a 30-dB range.
In addition to comparing the effects of variations in speaking rate and overall amplitude on spoken-word recognition, experiment 2 was designed to determine whether the effects of speaking-rate variability that were observed in the first study were due, at least in part, to the use of masking noise as a means of reducing overall performance levels. Similar results with an alternative means of reducing absolute recognition performance would increase the generality of the findings. Therefore, the stimuli in experiment 2 were degraded using a signal-processing software package that switched the amplitude sign bits (from positive to negative or vice versa) in digital stimulus files at randomly determined points over a specified portion of Ihe waveform (see Mullennix et al., 1989). A stimulus with a 10% degradation level, for example, consisted of the original waveform with a randomly selected 10% of the amplitude sign bits reversed from those found in the original digital file. Perceptually, listeners described the stimuli as either “noisy” or “distorted.” Four levels of stimulus degradation, 10%, 15%, 20%, and 30%, were used for the perceptual experiments reported below.
3. Procedure
a. General identification paradigm
The design and procedures for experiment 2 were similar to those used in the first study. Isolated words were presented over headphones and subjects were required to type the word they heard onto a CRT terminal. The temporal parameters of the procedure were identical to those of experiment 1.
Stimulus items were presented to listeners in five different conditions: (1) single rate (all tokens produced at one speaking rate), (2) mixed rate (one third of the items presented at each of the three speaking rates), (3) single amplitude (all words presented at a single amplitude, (4) mixed amplitude (one third of the stimuli presented at each of the three overall amplitudes), and (5) combined amplitude and rate variability (stimuli presented at all three amplitudes and all three speaking rates).
Thirty subjects were tested in both the single-rate and single-amplitude conditions (ten subjects were assigned to each of the three rates and to each of the three overall amplitude levels). Thirty subjects were also tested in the corresponding mixed-rate and mixed-amplitude condilions. A total of 60 subjects, 20 in each of the three variability contexts (mixed-rate, mixed-amplitude, combined amplitude and rate variability) were tested in condition 5. Stimulus lists for the mixed-rate and mixed-amplitude conditions were constructed such that a given word was presented at one of the three speaking rates or one of the three overall amplitudes to one third of the subjects. Only items produced at the medium speaking rate were tested in the single- and mixed-amplitude conditions (conditions 3 and 4). In all conditions, half of the subjects heard items produced by a male talker and half heard the words spoken by a female talker.
In the single- and mixed-rate conditions, stimuli were presented at approximately 80-dB SPL. For the single- and mixed-amplitude conditions, as well as the combined variability context (condition 5), words were presented at 65−, 80−, or 95-dB SPL, for the low, medium, and high presentation levels, respectively. Across all conditions, subjects received equal numbers of stimuli at each of the four degradation levels.
b. Perception of overall amplitude differences
To evaluate the effectiveness of the amplitude manipulation in getting listeners to perceive three distinct overall presentation levels, an additional 90 subjects were recruited to make loudness judgments on the stimuli for experiment 2. Eighteen groups of five subjects heard the 100 words from a single talker at a single speaking rate produced at all three overall amplitude levels. Subjects were asked to indicate whether they thought the words were spoken in a loud, medium, or soft voice. Correct amplitude judgments averaged across the male and female talker were 88.6%, 89.8%, and 81.9% for the low, medium and high amplitude stimuli, respectively. These values are similar to the ones obtained for judging speaking rate in experiment 1 and indicate that listeners perceived three distinct overall levels for the stimuli.
B. Results and discussion
Figure 2 displays results from all conditions tested in experiment 2. In each panel, percent correct identification is plotted as a function of percent stimulus degradation. Overall performance levels were comparable to those observed for the four S/N ratios tested in experiment 1. Data from the 30% degradation levels have been excluded from the analyses because this degree of digital distortion resulted in extremely low overall performance levels in most of the conditions tested.
FIG. 2.
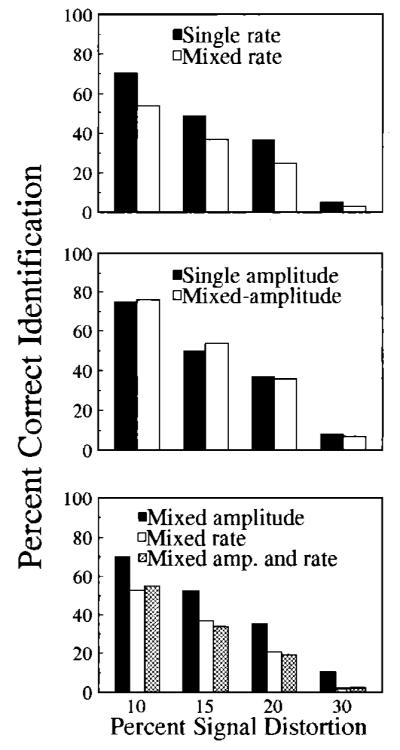
(top) Percent correct identification as a function of degradation percent for single-rate (solid bars) and mixed-rate (open bars) word lists, (middle) Same as above except bars are for single- and mixed-amplitude word lists, (bottom) Solid and open bars are for mixed-rate and mixed-amplitude lists, respectively. Hatched bars are for conditions in which rate and amplitude varied simultaneously.
The top panel in Fig. 2 compares identification performance in the single- and mixed-rate conditions using digital distortion, rather than white noise, as a means of degrading the stimuli. Separate analyses of the single- and mixed-rate conditions (see footnote 5) revealed no significant main effects or interactions of speaking rate. Therefore, the data shown in the figure have been averaged across the three speaking rates. A mixed-design ANOVA was conducted with between-subjects factors of stimulus variability (single versus mixed rate) and voice (male versus female) and a within-subjects factor of degradation percentage (10, 15, 20). No main effects or interactions were observed for voice. Identification scores for the male and female talkers have therefore been combined. Significant main effects were observed for stimulus variability [F(l, 58) = 98.02, p<0.001] and degradation percentage [F(2, 116) = 251.968, p<0.001]; identification accuracy in the single-rate condition was significantly better than in the mixed-rate context and, as expected, word recognition scores decreased with increasing amounts of stimulus degradation. None of the remaining interactions reached statistical significance. These findings suggest that reductions in identification performance for items presented in mixed-, as opposed to single-rate, contexts are not restricted to a specific method of stimulus degradation (either masking noise or digital distortion) but reflect some fundamental aspect of spoken-word recognition when listeners are exposed to increased amounts of variability in speaking rate.
The middle panel of Fig. 2 displays identification scores for the single- and mixed-amplitude conditions. Separate analyses of the single- and mixed-amplitude data7 revealed no significant main effect or interaction of overall presentation level. Therefore, the results have been averaged across the three overall amplitude levels. A three-way ANOVA with between-subjects factors of stimulus variability (single amplitude versus mixed amplitude) and voice (male versus female) and a within-subjects factor of degradation percent (10, 15, 20) failed to show a significant main effect or any interactions for the voice factor. Data for male and female voices have therefore been combined. The only significant main effect observed was for degradation level [F(2, 116) = 35.95, p<0.001]; identification scores decreased with greater percentages of stimulus degradation. None of the interactions were statistically reliable. Thus, in contrast to the detrimental effects of variability in speaking rate and talker characteristics that were observed in this and the previous experiment, trial-to-trial variations in overall amplitude did not produce significant decrements in identification performance [F(l, 58) = 0.036, p>0.1].
The bottom panel of Fig. 2 compares identification scores for conditions in which speaking rate and overall amplitude were varied independently with the effects of simultaneous variations along both dimensions.8 The ANOVA with stimulus variability (mixed-rate, mixed-amplitude, and combined rate and amplitude variability) as a between-subjects factor and degradation percent (10, 15, 20) as a within-subjects factor revealed a significant main effect of variability [F(2, 57) = 38.57, p<0.001]. Tukey HSD post hoc analyses indicated that identification scores in the mixed-amplitude condition were significantly better than those in the mixed-rate and combined rate and amplitude conditions (p<0.001 for both comparisons). Differences between the mixed-rate and combined mixed-rate and mixed-amplitude contexts did not reach statistical significance. The only other statistically reliable effect was for degradation level [F(2, 114) = 83.25, p<0.001], Thus, in contrast to experiment 1, in which simultaneous variations in speaking rate and talker characteristics produced greater decrements in identification scores than either source of variability alone, combining amplitude and rate variability did not result in greater reductions in identification performance relative to conditions in which only speaking rate was varied.
Taken together, the results of experiment 2 are consistent with the hypothesis that perceptual normalization for acoustic–phonetic variability in dimensions of the speech signal that distinguish phonetic categories is a resource-demanding process that can impact significantly on spoken-word recognition. In contrast, the effects of variability along stimulus dimensions, such as overall amplitude, that do not have direct effects on phonetic identification, are significantly attenuated. These results argue against any generalized attention-based explanation for the effects of stimulus variability on spoken-word recognition. Specifically, it is not the case that any source of variability in the speech signal will reduce identification performance. Rather, certain types of variability, such as overall amplitude, are either ignored or are more easily accommodated by the speech-perception system, perhaps at very early stages of perceptual analysis.
III. GENERAL DISCUSSION
The results of the present experiments extend previous findings on the effects of stimulus variability on spoken-word recognition (Mullennix et al., 1989; Mullennix and Pisoni, 1990) in several ways. First, experiment 1 demonstrated that, in addition to variability in talker characteristics, trial-to-trial changes in speaking rate can also reduce identification scores for isolated words. Second, the results showed that simultaneous variations along two phonetically relevant stimulus dimensions, speaking rate and talker characteristics, produced greater decrements in word identification scores than variability along either dimension alone. Third, similar identification scores for single- and mixed-amplitude conditions indicated that all sources of variability within speech signals do not produce equivalent reductions in spoken-word recognition.
These findings are consistent with recent proposals suggesting that the process of maintaining perceptual constancy by compensating for acoustic–phonetic variability, is an integral part of the speech-perception system that can have a considerable influence on the ability to accurately recognize spoken words (Martin et al., 1989; Mullennix et al., 1989; Mullennix and Pisoni, 1990). According to these arguments, the poorer identification performance for mixed-rate and mixed-talker conditions (compared to the corresponding single-dimension contexts) was the result of diverting limited processing resources from phonetic identification to accommodate the increased amounts of acoustic–phonetic variability in the speech signals. Uchanski et al. (1992) have also provided empirical support for the proposal that greater normalization requirements can result in reduced phonetic processing capabilities. They had talkers produce 16 different utterances of ten English vowels and then presented degraded versions of these stimuli to listeners for identification. In one condition, the single-token context, only one of the sixteen tokens was presented. In a second condition, the mixed-token context, all sixteen different tokens from one talker were presented. Identification accuracy was significantly greater for the single-token than for the mixed-token condition. These findings suggest that intrasubject variability in the acoustic–phonetic realization of vowels was sufficient to require additional processing resources to maintain perceptual constancy.
Johnson and Strange (1982), however, have argued against the role of perceptual normalization in accounting for reduced identification scores with variations in speaking rate. In their study, identification performance for long vowels in rate-consistent conditions (both precursor and target produced at a fast speaking rate) was better than for rate-inconsistent contexts (precursor produced at a medium speaking rate and target produced at a fast rate). According to Johnson and Strange, the reduction in vowel identification performance for the inconsistent-rate condition occurred because subjects were not able to derive accurate information about speaking rate from intrinsic syllable duration. They argued that correct information about articulation rate is essential to compensate for the incomplete acoustic specification of vowels, such as formant-frequency undershoot (Lind-blom, 1963), that can result from faster articulation rates. Thus, Johnson and Strange proposed that one reason for the poorer identification performance in rate-inconsistent, compared to the rate-consistent, conditions was that the former lacked appropriate extrasyllabic rate information to allow listeners to compensate for the incomplete acoustic specification of vowels typically observed at faster speaking rates.
Several findings, however, argue against such an explanation for the results of the present study. First, in both of the current experiments, identification accuracy in the mixed-rate condition did not differ significantly as a function of speaking rate. If the detrimental effects of increased stimulus variability on spoken-word recognition were due to listeners failing to compensate for incomplete acoustic specification at faster articulation rates, then fast items within the mixed-rate conditions should have been identified less accurately than either the slow- or medium-rate words. However, no significant effects of speaking rate were observed in the mixed-rate contexts in either experiment. Second, several acoustic analyses (Engstrand, 1988; Gay, 1978; van Son and Pols, 1990) have shown that changes in speaking rate do not necessarily alter the acoustic properties used for vowel identification. Gay (1978), for example, found that formant frequencies for vowels produced at normal and fast speaking rates were generally within 25 Hz, which was the limit of measurement accuracy in his experiment. Third, Gottfried et al. (1990) have recently demonstrated that changes in vowel identification as a function of speaking rate cannot be completely attributed to listeners compensating for undershoot of formant frequencies. They found significant rate-dependent effects on identification performance for a vowel contrast, /e/ vs /as/, in which neither stimulus was more centralized in the F1–F2 vowel space; at faster speaking rates, a greater proportion of items from the synthetic vowel continuum were identified as /æ/ rather than /e/. However, because /æ/ and /e/ are approximately equally centralized in the F1–F2 vowel space, the changes in vowel identification that occurred with increased speaking rate could not have been due exclusively to listeners compensating for expected vowel reductions in rapid speech. Taken together, these results suggest that reduced identification performance with increased speaking-rate variability cannot be completely attributed to listeners failing to compensate for formant-frequency undershoot in rapid speech.
A second alternative explanation for poorer spoken-word recognition scores with increased stimulus variability, namely, that greater variability simply diverts attention from the phonetic content of words, is also not supported by the present findings. The differential effects of variability in speaking rate and overall amplitude that were observed in experiment 2 indicate that reductions in identification performance with increased stimulus variability are not due entirely to changes in selective attention brought about by greater amounts of stimulus uncertainty. Instead, the results of several experiments on changes in vowel (Gottfried et al., 1990), stop-consonant (Miller, 1987a; Miller and Liberman, 1979), and word (present study) recognition as a function of speaking rate and speaking-rate variability argue that alterations in phonetic identification can result from a perceptually based, resource-demanding processing mechanism that rapidly adjusts for acoustic–phonetic variability arising from differences in articulation rate.
It should be noted, however, that studies comparing the perceptual consequences of variations along different stimulus dimensions must be interpreted with caution. Differences in the saliency of each dimension, the range over which variations are introduced, and the number of stimulus properties affected by changes in the different stimulus dimensions may have a significant influence on how different sources of variability affect spoken-word recognition. Although the differences in talker characteristics, speaking rate, and overall amplitude were clearly perceptible to listeners in the present investigation, it remains uncertain whether the range over which the three dimensions varied were perceptually equivalent. Future studies, therefore, should include methodologies, such as multidimensional scaling, which allow for more direct comparisons of perceived similarity among different stimulus dimensions.
One finding from the present investigation that stands in contrast to previous results (Diehl et al., 1980) are the additive effects of rate and talker variability on spoken-word identification. Experiment 1 demonstrated that combining variability in speaking rate and talker characteristics produced greater decrements in identification performance than either source alone. However, in a series of experiments investigating the effects of changes in perceived source characteristics on speaking-rate normalization, Diehl et al. (1980) observed reduced amounts of speaking-rate normalization when a change in perceived talker characteristics occurred between a precursor phrase and a target syllable. The reduced speaking-rate normalization was observed for changes in source characteristics that were cued by increasing fundamental frequency, rescaling formant frequencies, or both.9 Diehl et al. explained these findings by suggesting that when listeners encounter speech signals from a new talker, they disregard previous rate information and reinitiate the rate normalization process. According to this proposal, simultaneous variations in talker characteristics and speaking rate would not necessarily produce greater decrements in spoken-word recognition than conditions in which only speaking rate was varied.
Methodological differences in the way speaking rate was altered in the present study and the Diehl et al. (1980) investigation may partially account for the discrepant findings. Diehl et al. (1980) used synthetic stimuli in which variations in speaking rate were achieved through proportional reductions in the duration of all acoustic segments. Naturally produced rate alterations, such as those employed in the present experiments, do not contain such proportional differences in segment duration (see Gay, 1978; and also Miller, 1981 for a review). Thus the changes in speaking rate may have sounded rather artificial or unnatural to listeners in the Diehl et al. investigation. This factor may partially explain their unexpected finding of reverse normalization—a shift toward longer VOT category boundaries with increased speaking rate—for formant and fundamental frequencies characteristic of smaller vocal-tract sizes. Reverse normalization for syllable-initial voicing distinctions cued by VOT has not been replicated in other studies of speaking-rate normalization (see Miller, 1987a).10 The procedure that Diehl et al. (1980) used to alter speaking rate may also account for the discrepancy between their findings and those of Summerfield (1975). Summerfield (1975) did not find a reduction in speaking-rate normalization as a result of shifting formant frequencies between precursor and target. In contrast to the proportional reduction in all segment durations that Diehl et al. (1980) employed, Summerfield only reduced the duration of steady-state portions of the stimuli. This procedure more closely approximates the rate-dependent changes observed in natural speech. Due to these methodological differences, it may not be possible to generalize the findings from Diehl et al. (1980) to other studies of speaking-rate normalization.
The reduction in identification scores with increased variation in talker characteristics and speaking rate and the absence of such effects from variability in overall amplitude suggests that different dimensions of the speech signal are processed in fundamentally different ways. Changes in speaking rate and talker characteristics can both have direct effects on phoneme identification (Ladefoged and Broadbent, 1957; Miller, 1987a). Therefore, variability in these two dimensions may be processed in an obligatory manner by resource-demanding perceptual mechanisms (see Miller, 1987b for arguments on mandatory processing of speaking rate). Alterations in overall amplitude, in contrast, do not have direct effects on phonetic identification and, as a result, the obligatory processing demands for this dimension may be either absent or considerably attenuated. In general, these arguments suggest that listeners are required to normalize or compensate only for those dimensions of the speech signal that can have direct effects on the perception of a given phonetic contrast.
Consistent with this proposal is evidence from a number of studies demonstrating mandatory processing of speaking-rate information for phonetic contrasts which can be altered by changes in the perceived rate of articulation. For example, in an extension of her earlier work on rate-dependent processing of speech (Miller and Liberman, 1979), Miller (1981) asked subjects to label stimuli that varied along a /ba/-/wa/ continuum as quickly as possible. As in the previous study, the duration of the steady-state portion of the stimuli was systematically varied as a means of altering perceived speaking rate. Miller argued that under experimental conditions emphasizing speed of responding, subjects could minimize response latencies by ignoring the vowel portion of the stimuli. If listeners adopted this strategy, rate-dependent changes in category boundaries should not be observed since the duration of the initial phoneme was the same for /ba/ and /wa/. However, if subjects were required to listen to the vowel portion of the stimuli to obtain information about speaking rate prior to making phonetic decisions, then the typical rate-dependent shifts in category boundaries should be observed. Miller (1981) reported that despite explicit instructions to respond as quickly as possible, subjects still demonstrated rate-dependent category boundary shifts. This result suggests that for phonetic decisions that can be affected by speaking rate, listeners are required to process information within the syllable that indicates the prevailing rate of articulation. Tomiak et al. (1991) also found evidence to support mandatory processing of rate information using a speeded classification task (Garner, 1974). They reported that listeners could not ignore irrelevant variations in speaking rate when performing a phonetic classification, /bi/ vs /pi/, task that was signaled primarily by temporal (VOT) differences.
In contrast to their findings with speaking-rate variability, Tomiak et al. (1991) found that changes in talker characteristics, which were based largely on spectral distinctions, did not affect processing of the temporally based /bi/—/pi/ contrast. Gottfried et al. (1990) obtained comparable results for vowel distinctions that were cued primarily by either spectral information or by both spectral and temporal properties. Specifically, Gottfried et al. failed to find rate-dependent category boundary shifts for stimuli lying along an /e/-/I/ continuum but did find such changes for both an /e/-æ/ and an /I/-/i/ contrast. In natural speech, the /e/—/æ/ and /I/-/i/ distinctions can be cued by either temporal or spectral changes while the /e/-/I/ distinction is signaled primarily by spectral differences. When considered with the results of the present study, the results of Tomiak et al. (1991) and Gottfried et al. (1990) support the proposal that when alterations in a given stimulus dimension do not have direct consequences for acoustic–phonetic encoding, little or no perceptual normalization is required to accommodate variability in that dimension.
Studies examining the effects of variability along several different stimulus dimensions, both in isolation and in combination, on spoken-word recognition reflect a significant departure from traditional approaches used to investigate speech perception. While previous accounts of spoken-word recognition have tended to treat variability along perceptual dimensions such as speaking rate and talker characteristics as “noise” which is simply removed prior to phonetic identification (Joos, 1948; Liberman, 1973; also see Pisoni, 1992 for a review), the present findings, along with other perceptual experiments Mullennix et al., 1989; Mullennix and Pisoni, 1990), clearly demonstrate that perceptual normalization is an integral component of the speech-perception system that can have significant consequences for the identification of spoken words. Models of spoken-language processing will therefore be required to propose accounts of perceptual normalization which specify how normalization processes can affect spoken-word recognition. Towards this end, future studies should be directed at extending the present findings to spoken-word recognition in more natural contexts such as sentences. Evidence suggesting that the detrimental effects of rate and talker variability that were demonstrated in the current studies also obtain in sentence context would provide additional evidence for the importance of perceptual normalization as a fundamental component of spoken-word recognition. Additionally, future research efforts should be directed toward identifying the acoustic bases and perceptual mechanisms that mediate the normalization process.
IV. CONCLUSIONS
The results of the present experiments support the following conclusions:
Increased variability in both speaking rate and talker characteristics can reduce identification scores for words degraded by masking noise or digital distortion.
Simultaneous variations in speaking rate and talker characteristics reduces spoken-word recognition to a greater extent than variability along either dimension alone.
Trial-to-trial variations in overall amplitude do not reduce spoken-word identification scores.
Simultaneous variations iri overall amplitude and speaking rate do not produce greater decrements in identification performance than conditions in which only speaking rate is varied.
These findings support the existence of one or more resource-demanding perceptual mechanisms that function to normalize or compensate for variability in phonetically important dimensions of the speech signal. Furthermore, the results indicate that increased demands on the normalization system can have a significant impact on spoken-word recognition.
ACKNOWLEDGMENTS
This research was supported by Grants No. DC-00111-16 and No. DC-00012-13 to Indiana University. The authors wish to thank Sieb Nooteboom and an anonymous reviewer for suggestions that were extremely helpful in improving the original manuscript. We also wish to thank Luis Hernandez for his help with computer programming and systems analysis.
Footnotes
Portions of these data were presented at the 123rd meeting of the Acoustical Society of America, Salt Lake City, Utah.
Throughout the manuscript, the term "normalization" is used to refer to the process by which acoustic–phonetic variability is resolved to arrive at a phonetic representation that can be used in spoken-word recognition. Although no implications are made regarding the form of this representation, recent evidence indicates that the traditional view of normalization, which suggests that item-specific information such as talker characteristics or speaking rate are removed prior to arriving at phonetic decisions, may be incorrect (see Goldinger el al., 1991; Nygaard el al., 1992; Pisoni, 1992).
Only slow- and medium-rate items from this talker were used in the perceptual experiments.
Since each subject in the mixed-rate condition heard only one third of the words produced at a given rate, we needed to have three times as many subjects, relative to a given single-rate condition, to ensure that identification scores in the single- and mixed-rate conditions were based on an equivalent number of presentations at each rate.
Fast-rate words from the female speaker whose productions at this articulation rate were excluded from the database were not included in the stimulus sets.
Speaking rate was treated as a between-subjects variable for the single-rate condition and a within-subjects variable for the mixed-rate condition.
Although this proposal argues that fewer processing resources are required to compensate for overall amplitude differences, it does not preclude some type of normalization mechanism for overall level. One possibility, for example, is that overall amplitude differences are more efficiently processed through an automatic gain control mechanism very early in spoken-word recognition at the level of the peripheral auditory system.
Overall level was treated as a between-subjects factor for the single-amplitude condition and a within-subjects factor for the mixed-amplitude condition.
The data in the mixed-rate and combined rate and amplitude variability conditions have been averaged across speaking rate. The dala in the mixed-amplitude and combined variability conditions have been averaged across overall level. The results for all three conditions have been averaged across male and female talkers.
A recent investigation (Green el al., 1994) demonstrated that changes in perceived talker characteristics would prevent intrasyllabic rate normalization when the change was produced by altering fundamental frequency but not when the source change was signaled by altering formant frequencies. However, as Green el al. pointed out, it is not clear whether the same mechanisms are used for normalizing speaking rate both within (as was studied by Green el al.) and across (as occurred in both the Diehl el al. study and in the present investigations) syllables. The applicability of the Green et al. (1994) data to studies of normalization processes and word recognition must therefore await further investigation.
Dorman et al. (1976) found that the category boundary for a fricative-affricate distinction cued by duration of silence before the frication noise was shifted to longer, not shorter, silence durations with increased speaking rate. However, whether this represents a case of reverse normalization has been disputed (Repp, 1982).
PACS numbers: 43.71.Es, 43.71.Bp
References
- ANSI Method for measurement of monosyllabic word intelligibility. Am. Nat. Stand. S3.2-1960 (R1971) 1971 [Google Scholar]
- Assmann PF, Nearey TM, Hogan JT. Vowel identification: Orthographic perceptual and acoustic aspects. J. Acoust. Soc. Am. 1982;71:975–989. doi: 10.1121/1.387579. [DOI] [PubMed] [Google Scholar]
- Creelman CD. Case of the unknown talker. J. Acoust. Soc. Am. 1957;29:655. [Google Scholar]
- Diehl RL, Souther AF, Convis CL. Conditions on rate normalization in speech perception. Percept. Psychophys. 1980;27:435–443. doi: 10.3758/bf03204461. [DOI] [PubMed] [Google Scholar]
- Dorman MF, Raphael LJ, Liberman AM. Further observations on the role of silence in the perception of stop consonants. J. Acoust. Soc. Am. Suppl. 1. 1976;59:S40. [Google Scholar]
- Engstrand O. Articulatory correlates of stress and speaking rate in Swedish VCV utterances. J. Acoust. Soc. Am. 1988;83:1863–1875. doi: 10.1121/1.396522. [DOI] [PubMed] [Google Scholar]
- Fant G. Speech Sounds and Features. MIT; Cambridge, MA: 1973. [Google Scholar]
- Garner WR. The Processing of Information and Structure. Erlbaum; Potomac, MD: 1974. [Google Scholar]
- Gay T. Effects of speaking rate on vowel formant transitions. J. Acoust. Soc. Am. 1978;63:223–230. doi: 10.1121/1.381717. [DOI] [PubMed] [Google Scholar]
- Goldinger SD, Pisoni DB, Logan JS. On the nature of talker variability effects on serial recall of spoken word lists. J. Exp. Psychol.: Learn, Mem. Cog. 1991;17:152–162. doi: 10.1037//0278-7393.17.1.152. [DOI] [PMC free article] [PubMed] [Google Scholar]
- Gottfried TL, Miller JL, Payton PE. Effect of speaking rate on the perception of vowels. Phonetica. 1990;47:155–172. doi: 10.1159/000261860. [DOI] [PubMed] [Google Scholar]
- Green KP, Stevens EB, Kuhl PK. Talker continuity and the use of rate information during phonetic perception. Percept. Psycho-phys. 1994;55:249–260. doi: 10.3758/bf03207596. [DOI] [PubMed] [Google Scholar]
- House AS, Williams CE, Hecker MH, Kryter KD. Articulation-testing methods: Consonantal differentiation with a closed-response set. J. Acoust. Soc. Am. 1965;37:158–166. doi: 10.1121/1.1909295. [DOI] [PubMed] [Google Scholar]
- Johnson TL, Strange W. Perceptual constancy of vowels in rapid speech. J. Acoust. Soc. Am. 1982;72:1761–1770. doi: 10.1121/1.388649. [DOI] [PubMed] [Google Scholar]
- Joos MA. Acoustic phonetics. Language. 1948;24(Suppl. 2):1–136. [Google Scholar]
- Klatt DH. Linguistic uses of segmental duration in English: Acoustic and perceptual evidence. J. Acoust. Soc. Am. 1976;59:1208–1221. doi: 10.1121/1.380986. [DOI] [PubMed] [Google Scholar]
- Ladefoged P, Broadbent DE. Information conveyed by vowels. J. Acoust. Soc. Am. 1957;29:98–104. doi: 10.1121/1.397821. [DOI] [PubMed] [Google Scholar]
- Liberman AM, Cooper FS, Shankweiler DP, Studdert-Kennedy M. Perception of the Speech Code. Psychol. Rev. 1967;74:431–461. doi: 10.1037/h0020279. [DOI] [PubMed] [Google Scholar]
- Lieberman P. On the evolution of language: A unified view. Cognition. 1973;2:59–94. [Google Scholar]
- Lindblom BEF. Spectrographic study of vowel reduction. J. Acoust. Soc. Am. 1963;35:1773–1781. [Google Scholar]
- Luce PA, Carrell TD. Research in Speech Perception, Prog. Rep. No. 7. Indiana University Speech Research Laboratory; Bloomington: 1981. Creating and editing waveforms using WAVES. [Google Scholar]
- Martin CS, Mullennix JW, Pisoni DB, Summers WV. Effects of talker variability on recall of spoken word lists. Percept. Psychophys. 1989;15:676–684. doi: 10.1037//0278-7393.15.4.676. [DOI] [PMC free article] [PubMed] [Google Scholar]
- Miller JL, Liberman AM. Some effects of later-occurring information on the perception of stop consonant and semivowel. Percept. Psychophys. 1979;25:457–465. doi: 10.3758/bf03213823. [DOI] [PubMed] [Google Scholar]
- Miller JL. Effects of speaking rate on segmental distinctions. In: Eimas PD, Miller JL, editors. Perspectives on the Study of Speech. Erlbaum; Hillsdale, NJ: 1981. [Google Scholar]
- Miller JL. Rate-dependent processing in speech perception. In: Ellis A, editor. Progress in the Psychology of Language. Erlbaum; Hillsdale, NJ: 1987a. [Google Scholar]
- Miller JL. Mandatory processing in speech perception: A case study. In: Garfield JL, editor. Modularity in Knowledge Representation and Natural-Language Understanding. MIT; Cambridge, MA: 1987b. [Google Scholar]
- Miller JL, Grosjean F, Lomanto C. Articulation rate and its variability in spontaneous speech: A reanalysis and some implications. Phonetica. 1984;41:215–225. doi: 10.1159/000261728. [DOI] [PubMed] [Google Scholar]
- Mullennix JW, Pisoni DB. Stimulus variability and processing dependencies in speech perception. Percept. Psychophys. 1990;47:379–390. doi: 10.3758/bf03210878. [DOI] [PMC free article] [PubMed] [Google Scholar]
- Mullennix JW, Pisoni DB, Martin CS. Some effects of talker variability on spoken-word recognition. J. Acoust. Soc. Am. 1989;85:365–378. doi: 10.1121/1.397688. [DOI] [PMC free article] [PubMed] [Google Scholar]
- Nygaard LC, Sommcrs MS, Pisoni DB. Effects of speaking rate and talker variability on the representation of spoken words in memory; Proceedings of the 1992 International Conference on Spoken Language Processing; University of Alberta, Alberta. 1992. [Google Scholar]
- Peterson GE, Barney HL. Control methods used in a study of the vowels. J. Acoust. Soc. Am. 1952;24:175–184. [Google Scholar]
- Pickett JM, Decker LR. Time factors in perception of a double consonant. Lang. Speech. 1960;3:11–17. [Google Scholar]
- Pisoni DB. Long-term memory in speech perception: Some new findings on talker variability, speaking rate and perceptual learning. Speech Commun. 1992;13:109–125. doi: 10.1016/0167-6393(93)90063-q. [DOI] [PMC free article] [PubMed] [Google Scholar]
- Port RF. unpublished Doctoral dissertation. University of Connecticut; Storrs, CT: 1976. The influence of speaking tempo on the duration of stressed vowel and medial stop in English Trochee words. [Google Scholar]
- Port RF, Dalby J. Consonant/vowel ratio as a cue for voicing in English. Percept. Psychophys. 1982;32:141–152. doi: 10.3758/bf03204273. [DOI] [PubMed] [Google Scholar]
- Repp B. Phonetic trading relations and contcxt effccts: New experimental evidence for a speech mode of perception. Psychol. Bull. 1982;92:81–110. [PubMed] [Google Scholar]
- Summerfield Q, Haggard MP. Speech Synth. Percept. Rep. No. 6. University of Cambridge; 1972. Speech rate effects in the perception of voicing. [Google Scholar]
- Summerfield Q. Speech Perccpt. Rep. No. 3. Queen’s University; Belfast: 1975. Towards a detailed model for the perception of voicing contrasts. [Google Scholar]
- Summerfield Q. On articulatory rate and perceptual constancy in phonetic perception. J. Exp. Psychol.: Hum. Percept. Perform. 1981;7:1074–1095. doi: 10.1037//0096-1523.7.5.1074. [DOI] [PubMed] [Google Scholar]
- Tomiak GR, Green KP, Kuhl PK. Phonetic coding and its relationship to talker and rate normalization. J. Acoust. Soc. Am. 1991;90:2363. [Google Scholar]
- Uchanski RM, Miller KM, Reed CM, Braida LD, Schouten MEH. The Auditory Processing of Speech: From Sounds to Words. Mouton de Gruyter; New York: 1992. Effects of token variability on resolution for vowel sounds. [Google Scholar]
- van Son RJH, Pols LC. Formant frequencies of Dutch vowels in a text read at normal and fast rate. J. Acoust. Soc. Am. 1990;88:1683–1693. doi: 10.1121/1.404277. [DOI] [PubMed] [Google Scholar]
- Verbrugge RR, Shankweiler D. Prosodic information for vowel identity. J. Acoust. Soc. Am. Suppl. 1. 1977;61:S39. [Google Scholar]
- Verbrugge RR, Strange W, Shankweiler DP, Edman TR. What information enables a listener to map a talker’s vowel space? J. Acoust. Soc. Am. 1976;60:198–212. doi: 10.1121/1.381065. [DOI] [PubMed] [Google Scholar]
- Weenink DJM. The identification of vowel stimuli from men, women and children; Proceedings 10 from the Institute of Phonetic Sciences of the University of Amsterdam; 1986.pp. 41–54. [Google Scholar]