Abstract
Background/Aim:
Non-alcoholic fatty liver disease (NAFLD) is an increasingly prevalent cause of chronic liver disease worldwide. A number of these patients progress to nonalcoholic steatohepatitis (NASH) which carries significant morbidity and mortality. The aim of this study is to evaluate the diagnostic value of serum levels of transforming growth factor beta-1 (TGF-β1) matrix metalloproteinase-1 (MMP-1), and insulin resistance as predictors of fibrosis in Egyptian NAFLD patients.
Patients and Methods:
Fifty patients with NAFLD and different stages of fibrosis were studied. Serum levels of TGF-β1, MMP-1, and fasting serum insulin were measured; calculation of the homeostasis model assessment for insulin resistance (HOMA-IR) was done.
Results:
TGF-β1 gives a sensitivity of 100% and specificity of 94.4% for stage 1 fibrosis, 100% and 93.9%, respectively, for stage 2 fibrosis, and 97.7% and 100%, respectively, for stage 3 fibrosis. MMP-1 showed sensitivity and specificity of 88% and 81.8%, respectively, for stage 2 fibrosis, 90.9% and 55.56%, respectively, for stage 3 fibrosis, but it is of no diagnostic value in stage 1 fibrosis.
Conclusion:
Serum TGF-β1, MMP-1, and insulin resistance (HOMA-IR) proved to be potentially useful noninvasive markers in predicting fibrosis in NASH patients.
Keywords: HOMA- IR, insulin resistance, matrix metalloproteinase-1, nonalcoholic fatty liver disease, nonalcoholic steatohepatitis, noninvasive markers, transforming growth factor beta-1
Non-alcoholic fatty liver disease (NAFLD) is a common cause of chronic liver disease. NAFLD is probably the most common liver disease in many countries affecting 10% to 24% of the general population and its incidence is rising worldwide. Amongst the obese persons, the prevalence rises to 57-74% and 25-75% amongst obese diabetics. Non-alcoholic steatohepatitis (NASH) can be considered as the 3rd most common cause of liver disease after hepatitis C and alcohol abuse.[1] Histologically, NAFLD is a spectrum of disease from steatosis, steatohepatitis, to periportal and/or perisinusoidal fibrosis, to cirrhosis. The natural history is a dynamic one which may be stable, progressive, or regressive. Liver biopsy is the “gold standard” for grading, staging and documenting or excluding the presence and relative contribution of other causes to liver pathology, which has a prognostic value and aids in tailoring management strategies. However limitations to biopsy are many; pain, bleeding, representing only 1/50000th of liver, sampling error, inter- and intra-observer error and imposing of categorical variables in an ordinal scale on a process that is a continuous variable. Lastly, it may be refused by patients, contraindicated and it is not possible to conduct biopsy on every patient with NAFLD. Furthermore, transaminases, clinical and anthropometric parameters may underestimate significant disease justifying liver biopsy.[2–4]
Non-invasive predictors of liver fibrosis include direct and indirect fibrosis biomarkers. The direct markers are pathophysiologically derived from extra cellular matrix turnover and/or from changes of the fibro genic cell types, in particular hepatic stellate cells and myofibroblasts. They reflect the fibrogenic and/or the fibrolytic process, and their selection, therefore, is hypothesis driven.[5] The indirect biomarkers include a rapidly increasing, wide variety of biochemical scores and multi-parameter combinations or panels selected by various statistical models and mathematical algorithms. The parameters included in more than 20 scores have no pathophysiological relation to fibrogenesis but may have an indirect relation to it and their selection is, therefore, empiric. Compared to liver biopsy, 40% of results were correct, a fraction of about 50-70% was inaccurate and a small fraction was even incorrect.[6] Transient elastography (TE) has limitations in NASH patients due to the high prevalence of obesity, considering that a BMI > or = 28 is independently associated with failure of TE examination and the inter-observer agreement was found to be lower in the presence of moderate or severe steatosis.[7]
Transforming growth factor beta-1 (TGF-β1) mediates the transformation of quiescent hepatic stellate cells (HSCs) into myofibroblast-like cells with an increased production of extra cellular matrix proteins including type I collagen. TGF-β1 is secreted by activated Kupffer cells (KCs) and by Hepatic stellate cells (HSCs). Its plasma concentration is elevated in NASH patients compared to patients with hepatic steatosis and healthy subjects, suggesting that this cytokine is involved in fibrogenesis in NASH.[8] Matrix metalloproteinase 1 (MMP-1) is another attractive candidate marker to be studied in NAFLD as it has been shown to affect the course of HCV virus infection and other chronic liver disease by interfering with adequate matrix turnover.[9] The variables most commonly associated with increased risk of fibrosis in NASH are: the presence of diabetes, increasing age, increased homeostasis model assessment for insulin resistance (HOMA-IR), increased AST/ALT ratio, decreased platelets, hyaluronic acid, and increased body mass index.[10] This study was conducted to evaluate the diagnostic value of serum levels of TGF-β1, matrix metalloproteinase-1 (MMP-1), and insulin resistance, as non-invasive markers of fibrosis in Egyptian NAFLD patients.
PATIENTS AND METHODS
This study was conducted on one hundred and fifty patients with NAFLD, recruited from the Hepatology Clinic, Ain Shams University Hospitals. This study was approved by the local ethical committee and a written informed consent was obtained from each individual before participation in the study. Diagnosis of NAFLD was based on clinical, biochemical, sonographic findings and histopathological examination of liver biopsy specimens. Patients with cirrhosis, diabetes, schistosomiasis, viral, autoimmune, metabolic and alcohol- related liver disease were excluded. Fifty out of 150 patients examined showed liver fibrosis in different stages, TGF-β1, MMP-1, and HOMA-IR were studied in that cohort of patients.
Serum level of human MMP- 1 was assayed by Enzyme-Linked Immunosorbent Assay (ELIZA) technique using a kit from RayBiotech, Inc. Serum level of TGF-β1 was assayed by ELISA using TGF-β1 ELISA kit provided by DRG, NJ, USA, with reference number EIA-1864. Fasting serum insulin (FSI) was assayed by Insulin Microplate ELISA technique using a kit used for the quantitative determination of insulin levels in human serum supplied from Monobind, Inc. Fasting blood glucose was determined by ordinary method and the HOMA-IR was calculated.
Liver biopsy was done under ultrasound guidance using Baxer true cut needle (G14). The length of liver specimens was 1 cm or longer. The specimens were fixed with 10% formaldehyde, embedded in paraffin and stained with following stains: haematoxylin-eosin, Periodic- acid Schiff with diastase (PAS-d) stain for the necro-inflammatory grading and the Masson's trichrome stain for fibrosis and architectural changes. Only biopsy specimens with more than 6 intact portal tracts were considered as eligible for evaluation. The slides were evaluated by two expert pathologist blinded to the clinical data with grading of steatosis, lobular inflammation, hepatocyte ballooning, NAFLD activity scoring, and fibrosis staging according to internationally agreed parameters.[11] Steatosis in the liver specimens was arbitrarily graded and scored by the percentage of hepatocytes containing fat deposits as follows: grade 0 < 5%, grade 1; 5-33%, grade 2; 34- 66%, and grade 3 > 66%. Lobular inflammation: was graded on a 4-point scale as follows: grade 0; no foci, grade 1; <2 foci, grade 2; 2-4 foci, and grade 3; >4 foci. Hepatocyte ballooning was graded as follows: grade 0; none, grade 1; rare ballooned hepatocytes, and grade 2; many ballooned hepatocytes. From the above scores, calculation of NAFLD activity score (NAS) was done and then patients expressed as follows: Not NASH: score from 0 - 2, Border line NASH: score from 3 - 5, and Definitive NASH: score above 5. Staging of fibrosis in the examined slides was done as follows: F0; no fibrosis, F1; pericentral or sinusoidal fibrosis (zone 3), F2; sinusoidal (zone 3) and periportal fibrosis (zone 1), F3; bridging fibrosis between zone 3 and zone 1, and F4; cirrhosis.
Correlations between histopathological parameters and mean TGF-β1, MMP-1, and HOMA-IR using pearson correlation, multivariate analysis was performed, and receiver operating characteristic (ROC) curves for the best sensitivity and specificity for predicting fibrosis were studied for each marker. Analysis was performed by using the Statistical Package for the Social Sciences (SPSS, version 15, Chicago, IL, USA). A P < 0.05 was considered statistically significant.
RESULTS
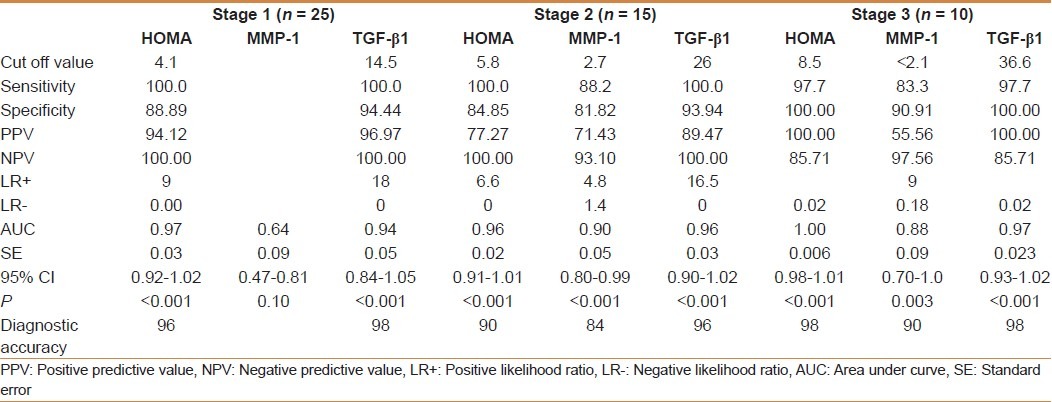
TGF-β1 showed a significant positive correlation with the grade of steatosis (r = 0.64 and P < 0.001) and stage of fibrosis (r = 0.74 and P < 0.001) [Table 1]. On multivariate analysis, serum level of TGF-β1 was an independent predictor of fibrosis (95% CI = 3.48-15.55, and P = 0.003) but not for the degree of steatosis [Table 2]. TGF-β1 at a cut off value of 14.5 ng/ml gives an area under the ROC (AUROC) curve, sensitivity, specificity, positive predictive value (PPV), negative predictive value (NPV), and diagnostic accuracy of 0.94, 100%, 94.4%, 96.97%, 100% and 96% respectively for the diagnosis of stage 1 fibrosis, and at a cut off value of 26 ng/ml, 0.96, 100%, 93.9%, 89.47%, 100%, and 96%, respectively for the diagnosis of stage 2 fibrosis, but at a cut off value of 36.6 ng/ml, 0.97, 97.7%, 100%, 100%, 85.7%, and 98%, respectively for the diagnosis of stage 3 fibrosis [Figures 1–3].
Table 1.
Correlations between histopathological parameters and mean TGFβ1 serum level (ng/ml) using Pearson correlation (r)

Table 2.
Multivariate analysis between histopathological parameters according to mean TGFβ1 (ng/ml)

Figure 1.
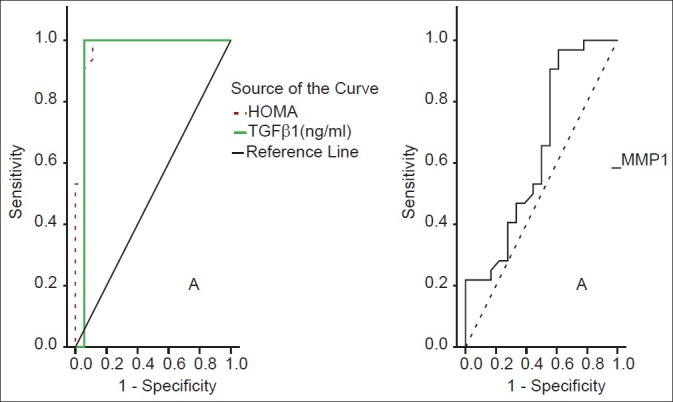
ROC curves for HOMA-IR, MMP-1 and TGFβ1 for stage 1 fibrosis
Figure 3.
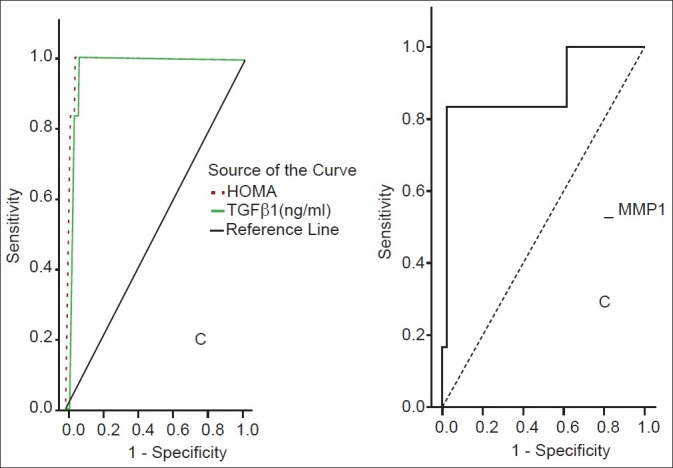
ROC curves for HOMA-IR, MMP-1, TGFβ1 for stage 3 fibrosis
Figure 2.
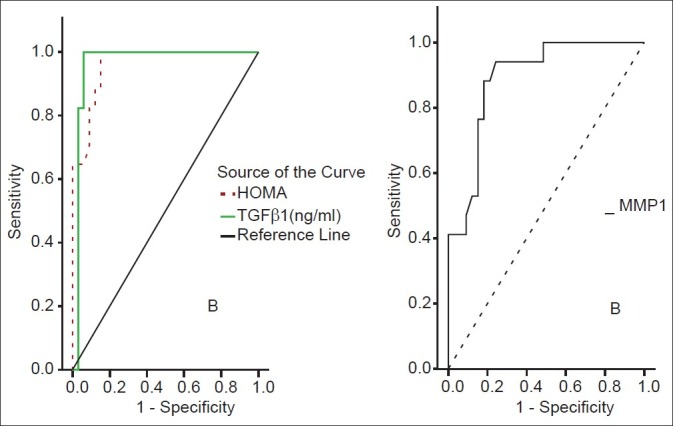
ROC curves for HOMA-IR, MMP-1 and TGFβ1 for stage 2 fibrosis
MMP-1 showed a positive correlation with the degree of steatosis (r = 0.55 and P < 0.001) but a significant negative correlation with the stage of fibrosis (r = -0.54 and P < 0.001) [Table 3]. On multivariate analysis, MMP-1 serum level was an independent determining variable for the degree of steatosis and the stage of fibrosis (95% CI -10.02 to -0.03, and P = 0.001), (95% CI = 0.26-0.88 and P = 0.001), respectively [Table 4]. MMP-1 at a cut off value of 2.7 ng/ml showed an AUROC, sensitivity, specificity, PPV, NPV, and diagnostic accuracy of 0.90, 88%, 81.8%, 71.4%, 93% and 84% respectively for the diagnosis of stage 2 fibrosis, while at a cut off value less than 2.1 ng/ml, 0.88, 83%, 90.9%, 55.56%, 97.56% and 90% respectively for the diagnosis of stage 3 fibrosis, but it is of no diagnostic value in stage 1 fibrosis giving an AUROC of 0.64 or less at any cutoff value in this group [Figures 1–3].
Table 3.
Correlations between histopathological parameters and mean MMP-1 serum level (ng/ml) using pearson correlation (r)
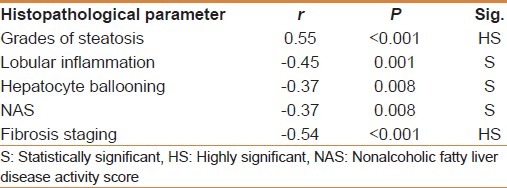
Table 4.
On multivariate analysis between histopathological parameters according to mean MMP-1 (ng/ml)

HOMA-IR positively correlated with the degree of steatosis and stage of fibrosis (r = 0.87 and P < 0.001 and r = 0.88 and P < 0.001, respectively) [Table 5]. HOMA-IR was a significant independent predictor of the grade of steatosis and stage of fibrosis (95% CI 0.09- 10.13 and P = 0.022 and 95% CI 0.71-193 and P < 0.001, respectively) [Table 6]. HOMA-IR at a cut off value of 4.1 showed an AUROC, sensitivity, specificity, PPV, NPV, and diagnostic accuracy of 0.97, 100%, 88.89%, 94%, 100%, and 96%, respectively for the diagnosis of stage 1 fibrosis, at a cut off value of 5.8 showed, 0.96, 100%, 84.85%, 77.27%, 100%, and 90% respectively for stage 2 fibrosis, but at a cut off value of 8.5 showed 1.0, 97.7%, 100%, 100%, 85.7%, and 98% respectively for stage 3 fibrosis [Table 7] [Figures 1–3].
Table 5.
Correlations between histopathological parameters according to mean HOMA-IR using pearson correlation (r)

Table 6.
On multivariate analysis between histopathological parameters and mean HOMA-IR

Table 7.
Diagnostic accuracy of HOMA-IR, serum MMP-1 (ng/ml) and serum TGFβ1 (ng/ml) in quantifying extent of fibrosis (staging) in patients
DISCUSSION
TGF-β serum level correlated positively with the stage of fibrosis [Table 1], significant independent predictor of the stage of fibrosis [Table 2], and at a cut off value of 14.5 ng/ml or more showed an adequate diagnostic value for mild stage 1 fibrosis, i.e. the presence or the absence of fibrosis, with an AUC of 0.94, sensitivity, specificity, PPV, NPV and accuracy of 100%, 94.4%, 96.97%, 100% and 96%, respectively. Also, at a cut off value of 26 ng/ml it showed adequate diagnostic value for stage 2 fibrosis with AUC of 0.96 with sensitivity, specificity, PPV, NPV, and diagnostic accuracy of 100%, 93.9%, 89.47%, 100%, and 96%, respectively. Moreover, at a cut off value of 36.6 ng/ml it showed an adequate diagnostic value for the severe advanced stage 3 fibrosis with an AUC of 0.97, sensitivity, specificity, PPV, NPV and diagnostic accuracy of 97.7%, 100%, 100%, 85.7%, and 98%, respectively [Table 7 and Figures 1–3]. Hence, it is suggested as a non-invasive marker to differentiate NAFLD from NASH, to stage the severity of fibrosis in NASH patients, to follow the course of NASH, and to monitor the treatment efficacy of NASH.
Liver injury in NASH can be encapsulated in the ‘two hit’ hypothesis i.e. accumulation of fat followed by oxidative injury.[12] Liver cell injury, oxidative stress signals, apoptototic bodies, lipopolysaccharides and paracrine stimuli from hepatocytes causes initiation of activation of HSC (Kupffer cells and sinusoidal endothelial cells) via rapid changes in gene expression and cell phenotype with subsequent recruitment of inflammatory cells, increased synthesis and production of TGF-β with subsequent fibro genic actions via very complex pathophysiological mechanisms: 1. Increased production of connective tissue growth factor (CTGF/CCN2) from both hepatocytes and HSC with, 2. Production of type I collagen instead of type IV collagen and matrix glycoprotiens from HSC 3. Inhibition of DNA synthesis of the hepatocyte and may serve as terminator of regenerative cell proliferation 4. Inhibition of expression of metalloprotease genes 5. Inhibition of metalloproteinases via activation of their inhibitors 6. Negative regulation of inflammation preventing the necessary actions of inflammatory cells in removing potentially toxic debris, 7. Activation and stimulation of HSC setting a positive feedback vicious circle 8. A pro-survival, anti-apoptotic action on myofibroblast via activation of the phosphatidylinositol 3-kinase (PI3K)-AKT pathway and 9. Regulation of fibronectin in hepatic stem cell, which may be an important cell in liver fibrosis, via cAMP and Smad pathways.[13–17]
The value of serum TGF-β1 has some limitations related to the contamination of the sample by TGF-β from platelets, the interference with plasmin activity in the plasma that increases the amount of TGF-β1 through opening LAP-TGF-β complex, the binding of TGF-β at the sites of injury to ECM and to vascular endothelium, the sequestration by soluble proteins and the complicated clearance of TGF-β1. These factors explain why plasma levels of TGF-β1 are unlikely to be of diagnostic value.[18]
However, some studies showed a good correlation between serum levels of total TGF-β1, and Knodell histological scores and also a correlation with the rate of fibrosis progression.[19] Moreover, some authors established cut-off values with prognostic significance for patients with no progression of fibrosis and those with progressive disease. A TGF-β1 level below 75 ng/ml was predictive for stable disease, 115 ng/ml ±20 was predictive of progressive one, and 59 ng/ml ± 20 was predictive of non-progressive disease.[20]
The difference between the values in our study and in that study, even that predictive of non-progressive disease, may be due to the different cause of chronic liver disease in the two studies (which may suggest that extrapolation of results of studies on one cause to other causes of liver disease may be incorrect), different genetic background between Egyptian and German patients or to different methods of TGF-β1 measurement being measured by both ELISA and bioassay in the German study compared to ELISA only in our study, which may suggest different cutoff values for different methods of assessment.
MMP-1 serum level showed a significant negative correlation with the stage of fibrosis [Table 3]. On multivariate analysis the stage of fibrosis was a significant independent determining variable for its serum level [Table 4]. MMP-1 at a cut off value of 2.7 ng/ml showed an AUROC, sensitivity, specificity, PPV, NPV, and diagnostic accuracy of 0.90, 88%, 81.8%, 71.4%, 93% and 84% respectively for the diagnosis of stage 2 fibrosis, while at a cut off value less than 2.1: 88, 83%, 90.9%, 55.56%, 97.56%, and 90% respectively for the diagnosis of stage 3 fibrosis, but it is of no diagnostic value in stage 1 fibrosis. These results suggest the potential utility of serum MMP-1 as a non-invasive marker for diagnosing significant fibrosis in NASH patients, and segregating them from NAFLD.
Our results could be explained by the fact that HSC is the main source of interstitial collagenase MMP-1, and the decrease of serum level with progression of fibrosis may be due to decreased synthesis which help in fibrosis progression.[21]
Many studies demonstrated that serum level of MMP-1 was negatively correlated with fibrosis stage in chronic viral liver disease. However, different cutoff values were suggested which suggest that there is no best cutoff value yet to be applied to all people of different ethnic background or with a different etiology for the chronic liver disease. In one study, MMP-1 at a cutoff value of 13.96 ng/ml gave a sensitivity of 90.5% and specificity of 52% in differentiating stage 2 from stage 1 fibrosis and at a cutoff value of 6.86 ng/ml gave a sensitivity of 70.7% and specificity of 80.9% in differentiating stage 3 fibrosis from stage 4 cirrhosis.[22] In another study a cutoff value of 7.49 ng/ml gave a sensitivity of 47% and a specificity of 69% for diagnosis of significant fibrosis in chronic viral hepatitis.[23] Those cutoff values are quite higher than our cutoff values with lower sensitivity and specificity which raise the question of standardizing the measurement kits references and may be the mistake of extrapolating results on one cause of liver disease to another cause(s).
HOMA-IR was significantly positively correlated with the grade of steatosis and stage of fibrosis and independently predictive of stage of fibrosis. HOMA-IR at a cut off value of 4.1 showed a sensitivity, specificity, PPV, NPV, and diagnostic accuracy of 100%, 88.89%, 94%, 100%, and 96%, respectively for the diagnosis of stage 1 fibrosis, at a cut off value of 5.8 showed 100%, 84.85%, 77.27%, 100%, and 90% respectively for stage 2 fibrosis, but at a cut off value of 8.5 showed, 97.7%, 100%, 100%, 85.7% and 98% respectively for stage 3 fibrosis. These results suggest that HOMA-IR determination in patients with NAFLD can be utilized as a non-invasive tool to predict fibrosis and diagnose NASH. This can be explained by the fact that insulin resistance triggers fibrosis through fatty acid mobilization, generation of reactive oxygen species, production of fibro genic growth factors including connective tissue growth factor, hyperleptinaemia and increased TNF-β which activate HSC.[24,25]
HOMA-IR > 2.7 and platelet < 200 × 103 in HCV patients are diagnostic of severe fibrosis [F3 and F4] in one study.[26] HOMA-IR > 8 was an independent predictor of worsening fibrosis in an Italian study in NASH patients.[27] In another study in HIV/HCV co-infected patients HOMA-IR was not associated with fibrosis stage or fibrosis progression.[28]
The lower HOMA-IR in HCV patients and the lack of association of HOMA-IR with fibrosis stage in HCV/HIV co-infected patients, raise again the question of extrapolating results of one cause of chronic liver disease to another and extrapolating results in certain population of ethnic background to another with different ethnic background.
Footnotes
Source of Support: Nil
Conflict of Interest: None declared.
REFERENCES
- 1.Dowman JK, Tomlinson JW, Newsome PN. Systematic review: The diagnosis and staging of non-alcoholic fatty liver disease and non-alcoholic steatohepatitis. Aliment Pharmacol Ther. 2011;33:525–40. doi: 10.1111/j.1365-2036.2010.04556.x. [DOI] [PMC free article] [PubMed] [Google Scholar]
- 2.Ratziu V, Charlotte F, Heurtier A. Sampling variability of liver biopsy in nonalcoholic fatty liver disease. Gastroenterology. 2005;128:1898–906. doi: 10.1053/j.gastro.2005.03.084. [DOI] [PubMed] [Google Scholar]
- 3.Adams LA, Lymp JF, St Sauver J. The natural history of nonalcoholic fatty liver disease: A population-based cohort study. Gastroenterology. 2005;129:113–21. doi: 10.1053/j.gastro.2005.04.014. [DOI] [PubMed] [Google Scholar]
- 4.Adams LA, Sanderson S, Lindor KD. The histological course of nonalcoholic fatty liver disease: A longitudinal study of 103 patients with sequential liver biopsies. J Hepatol. 2005;42:132–8. doi: 10.1016/j.jhep.2004.09.012. [DOI] [PubMed] [Google Scholar]
- 5.Gressner AM, Weiskirchen R. Modern pathogenetic concepts of liver fibrosis suggest stellate cells and TGF-β as major players and therapeutic targets. J Cell Mol Med. 2006;10:76–99. doi: 10.1111/j.1582-4934.2006.tb00292.x. [DOI] [PMC free article] [PubMed] [Google Scholar]
- 6.Parkes J, Guha IN, Roderick P, Rosenberg W. Performance of serum marker panels for liver fibrosis in chronic hepatitis C. J Hepatol. 2006;44:462–74. doi: 10.1016/j.jhep.2005.10.019. [DOI] [PubMed] [Google Scholar]
- 7.Foucher J, Chanteloup E, Vergniol J, LeBail B, Adhoute X. Diagnosis of cirrhosis by transient elastography [fibroscan]: A prospective study. Gut. 2006;55:403–8. doi: 10.1136/gut.2005.069153. [DOI] [PMC free article] [PubMed] [Google Scholar]
- 8.Hasegawa T, Yoneda M, Nakamura K. Plasma transforming growth factor-beta1 level and efficacy of alpha- tocopherol in patients with non- alcoholic steatohepatitis: A pilot study. Aliment Pharmacol Ther. 2001;15:1667–72. doi: 10.1046/j.1365-2036.2001.01083.x. [DOI] [PubMed] [Google Scholar]
- 9.Ulrike WD, Stefan L. Non-invasive diagnosis and monitoring of liver fibrosis and cirrhosis. Best Pract Res Clin Gastroenterol. 2009;23:453–60. doi: 10.1016/j.bpg.2009.03.002. [DOI] [PubMed] [Google Scholar]
- 10.Guha IN, Parkes J, Roderick PR, Harris S, Rosenberg WM. Non-invasive markers associated with liver fibrosis in non-alcoholic fatty liver disease. Gut. 2006;55:1650–60. doi: 10.1136/gut.2006.091454. [DOI] [PMC free article] [PubMed] [Google Scholar]
- 11.Kleiner DE, Brunt EM, van Natta M. Design and validation of a histological scoring system for nonalcoholic fatty liver disease. Hepatology. 2005;41:1313–21. doi: 10.1002/hep.20701. [DOI] [PubMed] [Google Scholar]
- 12.Day CP, James OFW. Steatohepatitis. A tale of two hits. Gastroenterology. 1998;114:842–5. doi: 10.1016/s0016-5085(98)70599-2. [DOI] [PubMed] [Google Scholar]
- 13.Guicciardi ME, Gores GJ. Apoptosis: A mechanism of acute and chronic liver injury. Gut. 2005;54:1024–33. doi: 10.1136/gut.2004.053850. [DOI] [PMC free article] [PubMed] [Google Scholar]
- 14.Roberts AB, Sporn MB. Physiological actions and clinical applications of transforming growth factor-beta (TGF-β) Growth Factors. 1993;8:1–9. doi: 10.3109/08977199309029129. [DOI] [PubMed] [Google Scholar]
- 15.Soo HC, Hwan SB. Modulation of the transforming growth factor- signal transduction pathway by hepatitis C virus nonstructural 5A protein. J Biol Chem. 2006;281:7468–78. doi: 10.1074/jbc.M512438200. [DOI] [PubMed] [Google Scholar]
- 16.Cui W, Jin HB, Li ZW. Mechanism of the transforming growth factor-beta induction of fibronectin expression in hepatic stem-like cells. Braz J Med Biol Res. 2010;43:36–42. doi: 10.1590/s0100-879x2009007500017. [DOI] [PubMed] [Google Scholar]
- 17.Kulasekaran P, Scavone CA, Rgers DS, Arenberg DA, Thannickal VJ, Horowitz JC. Endothelin-1 and transforming growth factor–beta independently induce fibroblast resistance to apoptosis via AKT activation. Am J Respir Cell Mol Biol. 2009;41:484–93. doi: 10.1165/rcmb.2008-0447OC. [DOI] [PMC free article] [PubMed] [Google Scholar]
- 18.Zhang BB, Min Cai W, Weng HL, Hu ZR, Lu J, Zheng M, et al. Diagnostic value of platelet derived growth factor-BB, transforming growth factor-b1, matrix metalloproteinase-1 in serum and peripheral blood mononuclear cells for hepatic fibrosis. World J Gastroenterol. 2003;9:2490–6. doi: 10.3748/wjg.v9.i11.2490. [DOI] [PMC free article] [PubMed] [Google Scholar]
- 19.Wahl S, Wen J, Moutsopoulos N. “TGF-β: A mobile purveyor of immune privilege”. Immunol Rev. 2006;213:213–27. doi: 10.1111/j.1600-065X.2006.00437.x. [DOI] [PubMed] [Google Scholar]
- 20.Kanzler S, Baumann M, Schimacher P, Dries V, Bayer E, Gerken G, et al. Prediction of progressive liver fibrosis in hepatitis C infection by serum and tissue levels of transforming growth factor-beta. J Viral Hepat. 2001;8:430–7. doi: 10.1046/j.1365-2893.2001.00314.x. [DOI] [PubMed] [Google Scholar]
- 21.Murawaki Y, Ikuta Y, Idobe Y. Serum matrix metalloproteinase-1 in patients with chronic viral hepatitis. J Gastroenterol Hepatol. 1999;14:138–45. doi: 10.1046/j.1440-1746.1999.01821.x. [DOI] [PubMed] [Google Scholar]
- 22.Yin SS, Li XM, Wang TL, Jia JD, Qian LX. The relationship of serum metalloproteinase with the severity of liver fibrosis and inflammation. Zhonghua Gan Zang Bing Za Zhi. 2004;12:666–8. [PubMed] [Google Scholar]
- 23.Abdel-Moneim SS, Mostafa EF, Osama A. Circulating matrix metalloproteinase-1 [MMP-1] and tissue inhibitor metalloproteinase-1 [TIMP-1] as serum markers of liver fibrosis in patients with chronic viral hepatitis. Arab J Gastroenterol. 2008;9:39–43. [Google Scholar]
- 24.Paradis V, Perlemuter G, Bonvoust F. High glucose and hyperinsulinemia stimulate connective tissue growth factor expression: A potential mechanism involved in progression to fibrosis in nonalcoholic steatohepatitis. Hepatology. 2001;34:738–44. doi: 10.1053/jhep.2001.28055. [DOI] [PubMed] [Google Scholar]
- 25.Ding X, Saxena NK, Lin S. The role of leptin and adiponectin: A novel paradigm in adipocytokine regulation of liver fibrosis and stellate cell biology. Am J Pathol. 2005;166:1655–69. doi: 10.1016/S0002-9440(10)62476-5. [DOI] [PMC free article] [PubMed] [Google Scholar]
- 26.Petta S, Camma C, DiMarco V. Insulin resistance is a major determinant of liver stiffness in non-diabetic patients with HCV genotype 1 chronic hepatitis. Aliment Pharmacol Ther. 2009;30:603–13. doi: 10.1111/j.1365-2036.2009.04079.x. [DOI] [PubMed] [Google Scholar]
- 27.Sorrentino P, Terrecciano L, D’Angelo S, Ferbo U, Bracigliano A, Vecchione R. Predicting fibrosis worsening in obese patients with NASH through parenchymal fibronectin, HOMA-IR, and hypertension. Am J Gastroenterol. 2010;105:336–44. doi: 10.1038/ajg.2009.587. [DOI] [PubMed] [Google Scholar]
- 28.Merchante N, Macias J, Ramayo E, Vergara S, Garcia-Garcia JA, Mira JA, et al. Insulin resistance is not associated with liver fibrosis progression in HIV/hepatitis C virus-co-infected patients. J Viral Hepat. 2006;13:449–56. doi: 10.1111/j.1365-2893.2005.00708.x. [DOI] [PubMed] [Google Scholar]


