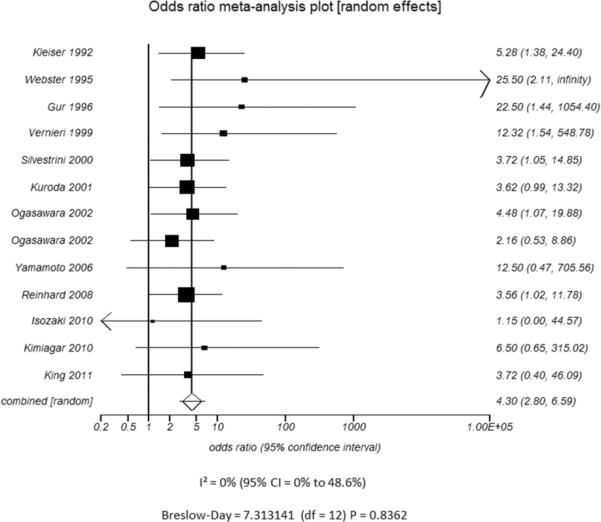
Figure 2.

Meta-analysis of the association between cerebrovascular reserve (CVR) and stroke/TIA. Studies are listed by date. Squares indicate point estimates for effect size (OR), with the size proportional to the inverse variance of the estimate. Diamonds indicate pooled estimates. Lines represent 95% CIs. Vertical line indicates the null effect. I2 and Breslow-Day heterogeneity statistic listed below the forest plot.
