

Abstract
Recent studies of haplotype diversity in a number of genomic regions have suggested that long stretches of DNA are preserved in the same chromosome, with little evidence of recombination events. The knowledge of the extent and strength of these haplotypes could become a powerful tool for future genetic analysis of complex traits. Different patterns of linkage disequilibrium (LD) have been found when comparing individuals of African and European descent, but there is scarce knowledge about the worldwide population stratification. Thus, the study of haplotype composition and the pattern of LD from a global perspective are relevant for elucidating their geographical stratification, as it may have implications in the future analysis of complex traits. We have typed 12 single nucleotide polymorphisms in a chromosome 22 region--previously described as having high LD levels in European populations -- in 39 different world populations. Haplotype structure has a clear continental structure with marked heterogeneity within some continents (Africa, America). The pattern of LD among neighbouring markers exhibits a strong clustering of all East Asian populations on the one hand and of Western Eurasian populations (including Europe) on the other, revealing only two major LD patterns, but with some very specific outliers due to specific demographic histories. Moreover, it should be taken into account that African populations are highly heterogeneous. The present results support the existence of a wide (but not total) communality in LD patterns in human populations from different continental regions, despite differences in their demographic histories, as population factors seem to be less relevant compared with genomic forces in shaping the patterns of LD.
Keywords: linkage disequilibrium, single nucleotide polymorphism (SNP), haplotype, chromosome 22, population diversity
Introduction
Future genetic analysis using single nucleotide polymorphisms (SNPs) will take advantage of the structure of the human genome in regions with high linkage disequilibrium (LD) and low haplotype number, in order to hasten and optimise gene mapping based on genetic association; find relatively frequent genetic variants associated with complex diseases; and define individual responses to drugs.
For these purposes, extensive knowledge of the patterns of LD in the human genome is required. It has been suggested that LD in humans could be organised as a pattern of blocks of variable length within which limited diversity is found, separated by regions with low LD. This structure could have been produced by a number of possible mechanisms, one of which is recombination hotspots [1-3]. The HapMap International Genome Project intends to create a map of haplotypes in four different populations in order to define sets of highly informative tag SNPs for future use. It is still unclear, however, to what extent a unique and general genome haplotype map exists or whether population structure is a main modifier of a putative human-wide pattern. The level of population structure affecting LD is also unclear: it could range fromdifferences between large continental groups to specificities of single populations with particular demographic histories. In fact, variable population stratification of LD for single loci has been found[4-6] and it is consistently observed that LD in non-African populations extends over longer physical distances than in Africans.
Here, we present a worldwide study of LD and haplotype structure in a region of chromosome 22, including 12 SNPs (Table 1), spanning 1.78 megabases (Mb), in which strong LD has been described in some European populations[8] (English, Centre d'Étude du Polymorphisme Humain [CEPH] families, Estonians). Although it may seem that the distance between SNPs is beyond the usual range of LD and haplotype structure, this study focuses on the regions with the highest LD described along the entire length of chromosome 22. The analysis was performed on a total of 1,110 unrelated individuals from 39 different populations across the world. Our results contribute to the understanding of the differences in LD patterns that exist among populations, mainly defining wide regional areas with very high similarities, and the recognition of specific populations that might demonstrate special features.
Table 1.
List of markers analysed in the present study.
| aSNP name | bPosition | cDistance | Polymorphism |
|---|---|---|---|
| rs139433 | 39847691 | 30773 | G/C |
| rs139495 | 39878464 | 87439 | C/T |
| rs3927 | 39965903 | 54236 | T/C |
| rs738499 | 40020139 | 126713 | T/G |
| rs137831 | 40146852 | 365815 | C/A |
| rs133291 | 40512667 | 25622 | C/T |
| rs713881 | 40538289 | 73607 | G/C |
| rs739292 | 40611896 | 188003 | G/A |
| rs714002 | 40799899 | 92186 | T/C |
| rs134874 | 40892085 | 529673 | G/A |
| rs2013730 | 41421758 | 206746 | C/T |
| rs737782 | 41628504 | C/G | |
a Name according to the National Center for Biotechnology Information database (dbNCBI; dbSNP Build 120).
b Position in pair of bases according to the dbNCBI Build 34.
c Distance to next single nucleotide polymorphism in pair of bases.
Materials and methods
SNP selection
We have selected 12 SNPs, previously ascertained and typed by Dawson et al., [8] in European (English and Estonian) populations in a high LD region in chromosome 22 (National Center for Biotechnology Information [NCBI] Build 34; 3,984,769 base pairs (bp) to 41,628,504 bp) (Table 1). The SNPs were identified through previous discovery efforts[9] and are available on the Wellcome Trust Sanger Center Institute website (http://www.sanger.ac.uk). These SNPs cannot be considered as tag SNPs, but are markers flanking groups of SNPs with the highest LD in the region [8].
Human subjects
The analysis was performed on a total of 1,110 unrelated individuals: 1,063 worldwide purified genomic DNA samples from the Human Genome Diversity Project-CEPH Human Genome Diversity Cell Line Panel[10] and 47 purified genomic DNA samples from Catalan individuals. The set of populations under study covered most of the complete human genetic diversity, as reported by Rosenberg et al.[11] As some original population samples were small, some of the geographically closest populations were pooled. Tuscans and North Italians were grouped as Continental Italians (CIT); Dai, Lahu, Miaozu, Naxi, She, Tujia and Yiku populations were combined as South Chinese (SCH); and Daur, Hezhen, Mongolian, Orogen, Tu, Uygur and Xibo populations were grouped as North Chinese (NCH). The total number of populations studied was thus 39 (see Table 2). Genotyping data for 70 unrelated English individuals, performed by Dawson et al.[8] and available on the Wellcome Trust Sanger Center Institute website, were also included in the present analysis for the selected markers.
Table 2.
Population-descriptive parameters grouped by continental region.
| Continental region | Population | aN | bDh | cKh | dKmax | eFNF | fKh shared | g% shared | hS fixed | i% fixed |
|---|---|---|---|---|---|---|---|---|---|---|
| Sub-Saharan Africa: | ||||||||||
| Bantu (BAN) | 40 | 0.9628 ± 0.0144 | 24 | 34 | 0.31 | 11 | 45.83 | - | - | |
| Mandenka (MAN) | 48 | 0.9344 ± 0.0247 | 26 | 39 | 0.35 | 11 | 42.31 | - | - | |
| Yoruba (YOR) | 50 | 0. 8555 ± 0.0491 | 27 | 40 | 0.34 | 11 | 40.74 | - | - | |
| San (SAN) | 14 | 0.8681 ± 0.0594 | 7 | 12 | 0. 50 | 5 | 71.43 | 5 | 41.67 | |
| Mbuti Pygmies (MBU) | 28 | 0.9524 ± 0.0242 | 18 | 24 | 0.27 | 8 | 44.44 | 1 | 8.33 | |
| Biaka Pygmies (BIA) | 72 | 0. 8 975 ± 0.0242 | 26 | 44 | 0.43 | 18 | 69.23 | - | - | |
| Average | 42 | 0.9117 | 21 | 32 | 0.36 | 11 | 52.33 | |||
| Europe: | ||||||||||
| Orcadian (ORC) | 32 | 0.9355 ± 0.0240 | 17 | 31 | 0. 48 | 15 | 88.24 | - | - | |
| English (ENG)j | 140 | 0.9581 ± 0.0071 | 51 | 117 | 0.57 | 41 | 80.39 | - | - | |
| Adygei (ADY) | 34 | 0.9340 ± 0.0264 | 19 | 33 | 0.45 | 13 | 68.42 | - | - | |
| Russian (RUS) | 50 | 0.9567 ± 0.0178 | 31 | 48 | 0.37 | 18 | 58.06 | - | - | |
| French Basque (FRB) | 48 | 0.9371 ± 0.0215 | 24 | 46 | 0. 50 | 19 | 79.17 | - | - | |
| French (FRE) | 58 | 0.9383 ± 0.0222 | 33 | 56 | 0. 43 | 22 | 66.67 | - | - | |
| Catalan (CAT) | 94 | 0.9526 ± 0.0114 | 41 | 87 | 0. 54 | 31 | 75.61 | - | - | |
| Continental Italian (CIT) | 44 | 0.9440 ± 0.0177 | 22 | 43 | 0. 51 | 14 | 63.64 | - | - | |
| Sardinian (SAR) | 56 | 0.9325 ± 0.0186 | 26 | 54 | 0.54 | 19 | 73.08 | - | - | |
| Average | 62 | 0.9432 | 29 | 57 | 0. 51 | 21 | 72.59 | |||
| Middle East/North Africa: | ||||||||||
| Mozabite (MOZ) | 60 | 0.9384 ± 0.0183 | 28 | 54 | 0.50 | 16 | 57.14 | - | ||
| Bedouin (BED) | 98 | 0.9552 ± 0.0115 | 46 | 92 | 0. 51 | 33 | 71.74 | - | ||
| Druze (DRU) | 96 | 0.9575 ± 0.0090 | 41 | 90 | 0. 56 | 31 | 75.61 | - | ||
| Palestinian (PAL) | 102 | 0.9639 ± 0.0081 | 48 | 96 | 0.51 | 27 | 56.25 | - | ||
| Average | 89 | 0.9537 | 41 | 83 | 0. 52 | 27 | 65.19 | |||
| Central/South Asia: | ||||||||||
| Balochi (BAL) | 50 | 0.9706 ± 0.0093 | 28 | 48 | 0.43 | 21 | 75.00 | - | - | |
| Brahui (BRA) | 50 | 0.9314 ± 0.0262 | 28 | 48 | 0.43 | 13 | 46.43 | - | - | |
| Makrani (MAK) | 50 | 0.9551 ± 0.0165 | 30 | 48 | 0.39 | 17 | 56.67 | - | - | |
| Sindhi (SIN) | 50 | 0.9649 ± 0.0134 | 30 | 49 | 0. 40 | 19 | 63.33 | - | - | |
| Pathan (PAT) | 50 | 0.9429 ± 0.0233 | 30 | 48 | 0.39 | 18 | 60.00 | - | - | |
| Burusho (BUR) | 50 | 0.9535 ± 0.0137 | 25 | 47 | 0. 49 | 18 | 72.00 | - | - | |
| Hazara (HAZ) | 50 | 0.9527 ± 0.0153 | 26 | 45 | 0.44 | 15 | 57.69 | - | - | |
| Kalash (KAL) | 50 | 0.9143 ± 0.0246 | 21 | 47 | 0. 58 | 18 | 85.71 | - | - | |
| Average | 50 | 0.948 | 27 | 48 | 0.45 | 17 | 64.60 | |||
| East Asia: | ||||||||||
| Han (HAN) | 90 | 0.9348 ± 0.0135 | 34 | 71 | 0.54 | 23 | 67.65 | 1 | 8.33 | |
| North China (NCH) | 138 | 0.9305 ± 0.0144 | 52 | 109 | 0.53 | 33 | 63.46 | - | - | |
| South China (SCH) | 140 | 0.9298 ± 0.0146 | 48 | 103 | 0.54 | 30 | 62.50 | 1 | 8.33 | |
| Cambodian (CAM) | 22 | 0.9221 ± 0.0381 | 13 | 20 | 0.39 | 11 | 84.62 | 2 | 16.67 | |
| Japanese (JAP) | 62 | 0. 8 911 ± 0.0328 | 31 | 49 | 0.38 | 20 | 64.52 | 1 | 8.33 | |
| Yakut (YAK) | 48 | 0.9273 ± 0.0254 | 27 | 39 | 0.32 | 22 | 81.48 | - | - | |
| Average | 83 | 0.9225 | 34 | 65 | 0.49 | 23 | 70.70 | |||
| Oceania: | ||||||||||
| Non-Austronesian (NAN) Melanesian | 44 | 0.6332 ± 0.0581 | 5 | 12 | 0.70 | 5 | 100.00 | 6 | 50.00 | |
| Papuan (PAP) | 34 | 0.8111 ± 0.0454 | 10 | 12 | 0.20 | 7 | 70.00 | 3 | 25.00 | |
| Average | 39 | 0.7167 | 8 | 12 | 0.45 | 6 | 85.00 | |||
| America: | ||||||||||
| Karitiana (KAR) | 48 | 0.7881 ± 0.0369 | 7 | 19 | 0.71 | 6 | 85.71 | 6 | 50.00 | |
| Suruí (SUR) | 42 | 0.7573 ± 0.0333 | 6 | 15 | 0.69 | 6 | 100.00 | 7 | 58.33 | |
| Colombian (COL) | 26 | 0. 8 246 ± 0.0475 | 7 | 15 | 0.62 | 6 | 85.71 | 4 | 33.33 | |
| Maya (MAY) | 50 | 0.7967 ± 0.0565 | 20 | 26 | 0.25 | 17 | 85.00 | - | - | |
| Pima (PIM) | 50 | 0. 8 204 ± 0.0335 | 12 | 16 | 0.29 | 10 | 83.33 | 5 | 41.67 | |
| Average | 43 | 0.797 | 10 | 18.2 | 0.48 | 9 | 87.95 | |||
a N, number of chromosomes
b Dh, haplotype diversity
c Kh, observed number of haplotypes
d Kmax, number of haplotypes expected under equilibrium
e FNF, fraction of haplotypes not found for each population defined (see Methods)
f Kh shared, number of haplotypes shared between two or more populations
g% shared, percentage of shared haplotypes
hS fixed, number of non-polymorphic single nucleotide polymorphisms (SNPs)
i % fixed, percentage of non-polymorphic SNPs
j ENG, English reference sample [8].
SNP genotyping
Twelve SNPs were successfully genotyped using TaqMan technology from Applied Biosystems (AB). The Assay by Design service was used to design probes and primers. Each 5 μl polymerase chain reaction (PCR) mix contained 10 ng of genomic DNA, 0.125 μl of a 40× mix of primers and 6-carboxy-fluorescein (FAM) and VIC labelled TaqMan munor groove bunder (MGB) probes and 2.5 μl of TaqMan Universal PCR Master Mix. Amplification conditions were as follows: 50°C, 2 minutes; 95°C, 10 minutes; followed by 40 cycles of 94°C, 15 seconds and 60°C, 1 minute, in ABI Prism 7900 HT (AB). Fluorescence in each well was measured after PCR and the results were analysed using Sequence Detection System (SDS) version 2.1 (AB).
Haplotypes and LD
Haplotype frequencies were estimated from genotype frequencies using the expectation-maximisation (EM) algorithm [12], as implemented in Arlequin software [13]. It should be noted that this has been described as a high LD region[8] and thus even in samples with a small number of chromosomes (for example, of less than 50 individuals), power and accuracy in estimating haplotype frequencies is acceptable according to simulations [14]. Haplotypes estimated at a frequency lower than a single chromosome were not considered. Besides haplotype diversity, the fraction of haplotypes not found (FNF statistic) was also computed as a measure of haplotype variation; it can be interpreted as the fraction of haplotypes not found in the population and is defined as
where Kh is the number of haplotypes found in the sample, Kmin is the minimum number of haplotypes that can be found in total LD (that is, two in the case of biallelic markers such as SNPs) and Kmax is the maximum possible number of different haplotypes expected under linkage equilibrium, given the size and allele frequencies of the population, and thus corrects for fixed loci (see Mateu et al.[5]).
Correspondence and principal component analyses were performed using SPSS software version 9.0. For LD measures, we computed D' and r2 for each pair of markers using the Arlequin software package [13]. Correspondence analysis[15] provided a method for representing frequency data in a Euclidian space, so that the results could be visually examined for structure.
Results
Haplotype composition
A description of the patterns of haplotype diversity within and among populations allows for an initial approach to the comprehension of the haplotype structure, its variation and diversity, and the global and regional similarities. Of the total of 4,096 different possible haplotypes, 531 were found. The number of shared haplotypes found in two or more populations was 182, a non-negligible fraction for such a wide genomic region. The most frequent haplotype was present in 118 chromosomes (5 per cent), all from European and Asian populations. In Africa, all of the haplotypes found at high frequency were population specific. The most common haplotypes found in Native Americans were present at very low frequencies elsewhere, a fact that can be explained by a bottleneck in the original settlement. We found a non-negligible fraction of fixed SNPs, mainly in Native Americans and Oceanians (see Table 2), which may be the result of the SNPs having been ascertained in Europeans and of genetic drift.
Table 2 shows, for each population and as an average for geographical regions, different descriptive parameters: haplotype diversity (Dh), observed number of haplotypes (Kh), number of haplotypes expected under equilibrium (Kmax), fraction of haplotypes not found (FNF), number of haplotypes shared between two or more populations and the number of nonpolymorphic SNPs. These figures are intended to present a comparative approximation of the amount of variation. Oceanian and Native American populations show the lowest haplotype diversities, with a high fraction of fixed SNPs. Asians and Europeans show high and similar haplotype diversities, with slightly lower values in Africans, even if fixation mainly affects a single population, the San from Namibia (with a low sample size and a high proportion of fixed loci). The fraction of chromosomes in a population harbouring haplotypes shared with other populations is lowest by far in Africans, but it is very high in Oceanians and Native Americans, which thus have a communality of haplotypes with Eurasian populations.
A measure of haplotype variability in the region could be obtained using the FNF statistic, which only depends on the number of polymorphic SNPs, and thus is not affected by the fixation of alleles in some SNPs. The number of different haplotypes expected under linkage equilibrium (given the sample size and allele frequencies) was compared with the number of observed haplotypes in each population. The resulting fraction (that is, the FNF; see Table 2) would be expected to increase when the SNP diversity is high and the number of observed haplotypes is low. The lowest mean value of FNF (and, thus, the highest richness of haplotypes) was found in Africans, with several geographical groups showing heterogeneity among single populations, mainly in Oceania and America.
In order to describe the patterns of haplotype variation and the similarities of populations based on their haplotype composition, a correspondence analysis[15] was performed on the haplotype frequencies for each of the 40 populations, considering the haplotypes shared by at least two populations. The results for the first three dimensions are plotted in Figure 1. As expected, they show that Africans are the main source of variation (as revealed by the first dimension). The second dimension separates the five Native American populations from the rest; thus, Native Americans are the second most important source of global genetic variation for haplotype composition, even if in this case most of the haplotypes are shared with other populations. Finally, the third dimension differentiates East Asians and Oceanians from the rest of Eurasian populations. The most interesting feature is the continental clustering, with strong similarities among populations, mainly in two clusters: Europe, Middle East/North Africa and Central/South Asia on the one hand, and East Asia and Oceania on the other; there is higher heterogeneity within Africa (with many unshared haplotypes) and America (with most of the haplotypes shared).
Figure 1.
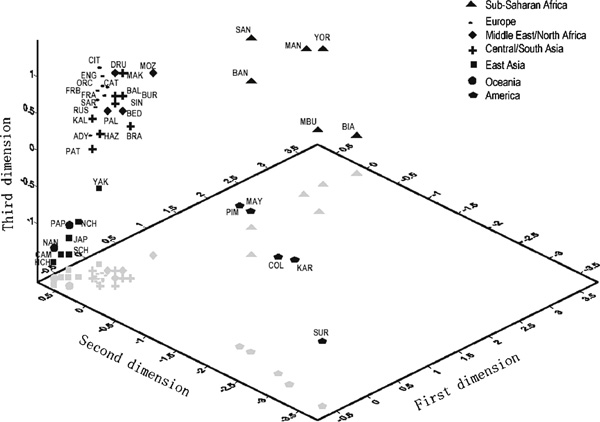
Plot of first three dimensions obtained in the correspondence analysis based on the 182 shared haplotypes found in 40 populations (English population included). The first dimension separates the six African populations from the rest. Native Americans are clearly differentiated in the second dimension and East Asians and Oceanians are separated from the rest of Eurasian populations by the third dimension.
LD analyses
LD decays with physical distance, but the pattern of decay shows strong differences among genomic regions with different recombination rates. For each pair of markers, we computed D' and r2, the two most common measures of LD [16-18]. Both statistics produced equivalent results in all of the performed analyses. Henceforth, therefore, only r2 results are shown.
In order to describe the similarities in the LD pattern among populations [19], a principal component analysis was performed upon measures of LD between adjacent pairs of markers. For every pair of populations, Pearson's correlation was calculated between the r2 values of LD between adjacent pairs of markers. The result was a correlation matrix among populations, which was summarised in a principal component analysis [20]. Seven populations were excluded because of their high number of fixed SNPs and, thus, the missing LD measures (the populations with more than three missing values of r2 were not considered; therefore, a total number of 33 populations were included in this analysis). Results for the first two components (Figure 2) revealed, as in the case of haplotype structure, two clusters, one corresponding to Central and West Eurasia, explaining 42 per cent of the variance (a North African population showed an African position) and the other corresponding to East Asia (18.8 per cent of the variance). African populations were scattered in the plot, with different LD patterns among them.
Figure 2.
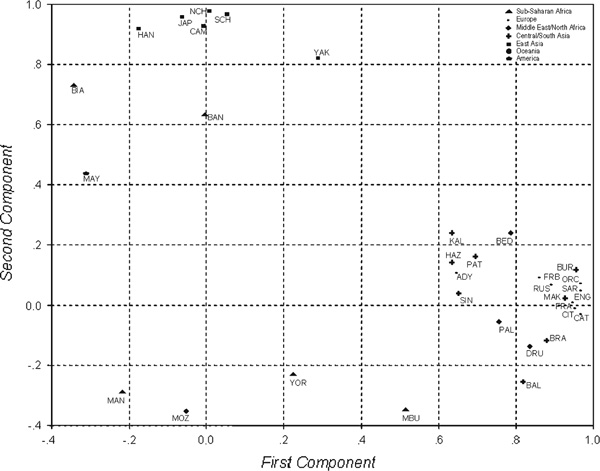
Principal components analysis plots based on the r2 values obtained for neighbouring markers. Populations with more than three missing r2 values were excluded in the analysis (Surui, San, Non-Austronesian (NAN) Melanesian, Colombian, Karitiana, Pima and Papuan). 42.1% and 18.9% of the variance is explained by the first and second components, respectively. The plot of the two first components pools the populations into two groups: East Asia and European/Western Eurasians. African populations are scattered due their lack of a single linkage disequilibrium pattern. Note that four Native American populations were excluded from the analysis and only one such population (Mayans, from Mexico) could be included.
We tested the statistical significance (Table 3, above the diagonal) of the previous correlation coefficients (between LD measures in contiguous SNPs) for pairs of populations within each geographical region (Table 3, below the diagonal). The significance of the probabilities was established using the rigid and conservative Bonferroni correction. We also calculated the correlations using the whole LD matrix, establishing the significance through the non-parametric Mantel test, with similar results to those found using just the diagonal values; however, the amount of noise for LD at large distances precludes its use. Oceanic and American groups were excluded because of lack of comparative data due to fixed SNPs. There are, with some exceptions, very strong correlations among populations within regional groups, except for Africans -- a further consequence of the genetic heterogeneity among African populations. In Europeans, all correlations were extremely significant, except for the Adygei in the Caucasus. In Central/South Asia, the pattern was less clear, having a larger diversity within some populations (such as Sindhi) and showing non-significant correlations with the rest. Finally, East Asian populations formed a tight cluster with very strong similarities in most of the comparisons. When performing the same analysis with one population from each region, correlations were much smaller, as expected (Table 3E); nevertheless, a cluster became evident with populations from West Eurasia (from Europe, the Middle East and Central Asia). The results of the correlations confirmed and quantified the principal component analysis in Figure 2.
Table 3.
Correlation coefficients for pairs of populations (below the diagonal) within geographical regions: Africa (3A), Europe (3B), Central/South Asia (3C) and East Asia (3D), and among geographical regions, with one population from each region (3E).
| A) | |||||||||
|---|---|---|---|---|---|---|---|---|---|
| BAN | MAN | BIA | YOR | MBU | |||||
| BAN | 0.395 | 0.001* | 0.920 | 0.479 | |||||
| MAN | -0.286 | 0.933 | 0.664 | 0.847 | |||||
| BIA | 0.832 | -0.029 | 0.969 | 0.820 | |||||
| YOR | 0.034 | 0.148 | -0.013 | 0.010 | |||||
| MBU | 0.272 | 0.075 | -0.089 | 0. 8 00 | |||||
| B) | |||||||||
| CAT | ORC | ADY | RUS | FBAS | FRE | CIT | SAR | ENG | |
| CAT | 0.000* | 0.109 | 0.000* | 0.000* | 0.000* | 0.000* | 0.000* | 0.000* | |
| ORC | 0.977 | 0.000* | 0.000* | 0.000* | 0.000* | 0.000* | 0.000* | 0.000* | |
| ADY | 0.509 | 0.500 | 0.348 | 0.159 | 0.016 | 0.148 | 0.029 | 0.212 | |
| RUS | 0.901 | 0.924 | 0.312 | 0.002 | 0.004 | 0.000* | 0.000* | 0.000* | |
| FBAS | 0.910 | 0.919 | 0.455 | 0.819 | 0.012 | 0.000* | 0.000* | 0.000* | |
| FRE | 0.863 | 0.858 | 0.699 | 0.781 | 0.719 | 0.002 | 0.000* | 0.001 | |
| CIT | 0.943 | 0.970 | 0.466 | 0.933 | 0.899 | 0.803 | 0.000* | 0.000* | |
| SAR | 0.907 | 0.950 | 0.651 | 0. 88 1 | 0. 88 0 | 0.906 | 0.934 | 0.000* | |
| ENG | 0.954 | 0.977 | 0.408 | 0.958 | 0.909 | 0.830 | 0.986 | 0.933 | |
| C) | |||||||||
| BAL | BRA | MAK | SIN | PAT | BUR | HAZ | KAL | ||
| BAL | 0.004 | 0.002* | 0.267 | 0.275 | 0.014 | 0.174 | 0.278 | ||
| BRA | 0.788 | 0.003 | 0.077 | 0.115 | 0.004 | 0.263 | 0.147 | ||
| MAK | 0.813 | 0.799 | 0.169 | 0.008 | 0.000* | 0.012 | 0.009 | ||
| SIN | 0.367 | 0.555 | 0.446 | 0. 476 | 0.137 | 0.866 | 0.931 | ||
| PAT | 0.361 | 0.503 | 0.749 | 0.240 | 0.001* | 0.000* | 0.000* | ||
| BUR | 0.712 | 0.790 | 0.966 | 0.477 | 0.865 | 0.002* | 0.002* | ||
| HAZ | 0.441 | 0.370 | 0.721 | 0.058 | 0.926 | 0.813 | 0.000* | ||
| KAL | 0.359 | 0. 468 | 0.741 | 0.030 | 0.922 | 0.831 | 0.903 | ||
| D) | |||||||||
| HAN | NCH | SCH | JAP | YAK | CAM | ||||
| HAN | 0.001* | 0.001* | 0.001* | 0.027 | 0.009 | ||||
| NCH | 0.914 | 0.000* | 0.000* | 0.001* | 0.000* | ||||
| SCH | 0.889 | 0.959 | 0.000* | 0.001* | 0.000* | ||||
| JAP | 0.886 | 0.967 | 0.928 | 0.017 | 0.003* | ||||
| YAK | 0.726 | 0.870 | 0.911 | 0.764 | 0.003* | ||||
| CAM | 0.841 | 0.956 | 0.966 | 0.886 | 0. 8 96 | ||||
| E) | |||||||||
| YOR | ENG | PAL | BAL | NCH | MAYA | ||||
| YOR | 0.749 | 0. 84 3 | 0.145 | 0.575 | 0.372 | ||||
| ENG | 0.109 | 0.000* | 0.008* | 0.949 | 0.225 | ||||
| PAL | 0.068 | 0.882 | 0.045 | 0.901 | 0.279 | ||||
| BAL | 0.470 | 0.752 | 0.612 | 0.515 | 0.440 | ||||
| NCH | -0.190 | 0.022 | -0.042 | -0.220 | 0.337 | ||||
| MAYA | -0.299 | -0.398 | -0.359 | -0.260 | 0.320 | ||||
The Bonferroni correction was applied and only significant p values were labelled with an asterisk (above the diagonal). Names of the populations are as in Table 2.
Discussion
The genetic diversity in humans has been used for decades to understand population history, but in recent years there has been a growing interest in ascertaining the extent of variation for other purposes--mainly for the genetic analysis of complex traits through methods based on LD [19]. The most frequently-used method is the comparison between patients and control populations (association studies), with approaches ranging from a single candidate SNP to a whole genome scan. In fact, knowledge of genetic stratification is of interest to obtain reliable results in association studies, as it may help to answer questions such as: i) how different is the haplotype composition between populations or, in other words, how well would SNPs that account for the most common haplotypes (tagging SNPs) in one population work in other populations as tag SNPs? and ii) how different are the LD patterns, that is, if an association found in one population is not replicated in another, could it be due to differences in the LD pattern between the two populations?
The genetic diversification of humans is mainly the consequence of the specific demographic history of humans as a species and the particular history of each regional group or single population. It is of interest, therefore, to evaluate not only the differences and stratification of genetic variation in terms of allele and haplotype frequencies, but also of LD patterns, which have been less explored. In fact, the diversity observed is the result of the interplay between the genome (mainly recombination) and demographic factors (mainly drift); if the former was the only player, there would be a single LD map of the human genome. In this case, the variation that might exist would depend on the relative importance of population-specific historical factors.
There is a fundamental problem in most studies of genetic variation: how were the variants ascertained? The present worldwide analysis of common SNPs identified in European samples, even if extreme frequencies have been avoided, has an ascertainment bias, with alleles being fixed in other populations. As well as this well known ascertainment bias, there will be a further ascertainment bias associated with the specific populations in which LD structure is described, a fact that will be more pronounced if differences in LD among populations are strong. As discussed below, this is not the case, and population factors are minor compared with genomic factors in shaping the patterns of LD. Recently, extensive simulations have demonstrated that ascertainment bias is an important problem to consider in the interpretation of LD estimates [21]. Despite the availability of the SNPs required to build a haplotype map for European populations[22] and the existence of statistical tools for correcting the ascertainment bias, an identification effort and allele frequency estimates of markers in other continental groups are essential.
Besides the ascertainment bias problems, it is clear that the diversity observed through both haplotype structure and LD patterns in worldwide populations do indeed reflect some effects of population events and demographic history. One example is the high frequency of fixed SNPs in Amerindians, which could be explained by a founder effect experienced by these populations. In addition, several studies have shown high levels of population substructure in Africa [23], which results in the observed divergent patterns of LD among African populations.
The analysis of haplotype composition has shown that widely scattered geographical groups are highly homogeneous. This is the case for populations in Europe, the Middle East/North Africa and Central/South Asia on the one hand and East Asia and the Pacific Rim on the other. More heterogeneity is observed in Africa (with high diversity and low haplotype sharing) and the Americas (with low diversity and very high haplotype sharing). The analysis of haplotype composition and differentiation among populations shows that differences in diversity are not strong and that the extent of haplotype sharing is high for all populations except Africans. Thus, although there are differences in haplotype frequencies that might be of anthropological interest, haplotype distribution shows remarkable constancy within large geographical groups, and their variation does not hamper the use of genetic strategies for looking for common sets of haplotypes.
Interestingly, the LD pattern presents a comparable picture, with very similar patterns for both the East Asian populations and for most West Eurasian populations. No doubt there is a single, shared LD structure for populations belonging to each group and, since LD structure is crucial for gene mapping based on genetic association, this suggests that there are good reasons to accept a common pattern in these two regions, with a unique LD structure for each -- having been shaped by a common demographic history. Nevertheless, some populations show divergent patterns. These are rather small populations with particular demographic histories. In the latter cases, the LD pattern cannot be ascertained from a common pattern. It is thus evident that for most Eurasian populations just two reference populations (from Europe and the Far East) could give a general framework of variation.
For the Americas and Oceania, differences in haplotype frequencies have not erased the clear genetic communality with Asian populations. Additional care has to be taken with populations that have had a special demographic history -- a fact that is generally known in anthropological genetics and that would prevent consideration of these populations as part of an analysis of general populations in terms of their LD composition.
For Africa, the picture is more complex, as haplotypes are more diverse, with less sharing and significant differences in the LD pattern. Within the continent of Africa, it does not seem to be appropriate to use or infer information across populations, and a larger effort is required to fully ascertain the LD variation within the continent.
Although further analysis would be needed in order to ascertain the precise extent of portability of tagging SNPs across specific populations, the present results support the existence of a wide (but not total) communality in LD patterns in human populations from different continental regions, despite differences in their demographic histories.
Acknowledgements
This study was supported by the European Project QLG2-CT-2002-00916 and by the Ministerio de Ciencia y Tecnologia of the Spanish Government (BNC2001-0772). We are particularly grateful to Dr Ian Dunham and Dr Lon Cardon for their advice on marker selection and analysis. We would especially like to thank M. Feldman for his suggestions on data analysis, Mònica Vallés for technical support and Michelle Gardner for help in the correction of the manuscript.
References
- Goldstein DB. Islands of linkage disequilibrium. Nat Genet. 2001;29:109–111. doi: 10.1038/ng1001-109. [DOI] [PubMed] [Google Scholar]
- Jeffreys AJ, Kauppi L, Neumann R. Intensely punctate meiotic recombination in the class II region of the major histocompatibility complex. Nat Genet. 2001;29:217–222. doi: 10.1038/ng1001-217. [DOI] [PubMed] [Google Scholar]
- Stumpf MP. Haplotype diversity and the block structure of linkage disequilibrium. Trends Genet. 2002;18:226–228. doi: 10.1016/S0168-9525(02)02641-0. [DOI] [PubMed] [Google Scholar]
- Tishkoff SA, Dietzsch E, Speed W. et al. Global patterns of linkage disequilibrium at the CD4 locus and modern human origins. Science. 1996;271:1380–1387. doi: 10.1126/science.271.5254.1380. [DOI] [PubMed] [Google Scholar]
- Mateu E, Calafell F, Lao O. et al. Worldwide genetic analysis of the CFTR region. Am J Hum Genet. 2001;68:103–117. doi: 10.1086/316940. [DOI] [PMC free article] [PubMed] [Google Scholar]
- Reich DE, Schaffner SF, Daly MJ. et al. Human genome sequence variation and the influence of gene history, mutation and recombination. Nat Genet. 2002;32:135–142. doi: 10.1038/ng947. [DOI] [PubMed] [Google Scholar]
- Gabriel SB, Schaffner SF, Nguyen H. et al. The structure of haplotype blocks in the human genome. Science. 2002;296:2225–2229. doi: 10.1126/science.1069424. [DOI] [PubMed] [Google Scholar]
- Dawson E, Abecasis GR, Bumpstead S. et al. A first-generation linkage disequilibrium map of human chromosome 22. Nature. 2002;418:544–548. doi: 10.1038/nature00864. [DOI] [PubMed] [Google Scholar]
- Mullikin JC, Hunt SE, Cole CG. et al. An SNP map of human chromosome 22. Nature. 2000;407:516–520. doi: 10.1038/35035089. [DOI] [PubMed] [Google Scholar]
- Cann HM, de Toma C, Cazes L. et al. A human genome diversity cell line panel. Science. 2002;296:261–262. doi: 10.1126/science.296.5566.261b. [DOI] [PubMed] [Google Scholar]
- Rosenberg NA, Pritchard JK, Weber JL. et al. Genetic structure of human populations. Science. 2002;298:2381–2385. doi: 10.1126/science.1078311. [DOI] [PubMed] [Google Scholar]
- Excoffier L, Slatkin M. Maximum-likelihood estimation of molecular haplotype frequencies in a diploid population. Mol Biol Evol. 1995;12:921–927. doi: 10.1093/oxfordjournals.molbev.a040269. [DOI] [PubMed] [Google Scholar]
- Schneider S, Roessli D, Excoffier L. Arlequin ver 2.0: A software for population genetic data analysis. 2.0. Genetics and Biometry Laboratory, University of Geneva, Geneva, Switzerland; 2000. [Google Scholar]
- Fallin D, Schork NJ. Accuracy of haplotype frequency estimation for biallelic loci, via the expectation-maximization algorithm for unphased diploid genotype data. Am J Hum Genet. 2000;67:947–959. doi: 10.1086/303069. [DOI] [PMC free article] [PubMed] [Google Scholar]
- Greenacre M. Correspondence analysis in medical research. Stat Methods Med Res. 1992;1:97–117. doi: 10.1177/096228029200100106. [DOI] [PubMed] [Google Scholar]
- Lewontin RC. The interaction of selection and linkage. I. General considerations: Heterotic models. Genetics. 1964;49:49–67. doi: 10.1093/genetics/49.1.49. [DOI] [PMC free article] [PubMed] [Google Scholar]
- Hill WG, Robertson A. The effects of inbreeding at loci with heterozygote advantage. Genetics. 1968;60:615–628. doi: 10.1093/genetics/60.3.615. [DOI] [PMC free article] [PubMed] [Google Scholar]
- Pritchard JK, Przeworski M. Linkage disequilibrium in humans: Models and data. Am J Hum Genet. 2001;69:1–14. doi: 10.1086/321275. [DOI] [PMC free article] [PubMed] [Google Scholar]
- Bertranpetit J, Calafell F, Comas D. et al. Structure of linkage disequilibrium in humans: Genome factors and populations stratification. Cold Spring Harbor Symposia on Quantitative Biology. 2003;68:79–88. doi: 10.1101/sqb.2003.68.79. [DOI] [PubMed] [Google Scholar]
- Calafell F, Bertranpetit J. Principal component analysis of gene frequencies and the origin of Basques. Am J Phys Anthropol. 1994;93:201–215. doi: 10.1002/ajpa.1330930205. [DOI] [PubMed] [Google Scholar]
- Akey J, Zhang K, Xiong M. et al. The effect of single nucleotide polymorphism identification strategies on estimates of linkage disequilibrium. Mol Biol Evol. 2003;20:232–242. doi: 10.1093/molbev/msg032. [DOI] [PubMed] [Google Scholar]
- Carlson CS, Eberle MA, Rieder MJ. et al. Additional SNPs and linkage-disequilibrium analyses are necessary for whole-genome association studies in humans. Nat Genet. 2003;33:518–521. doi: 10.1038/ng1128. [DOI] [PubMed] [Google Scholar]
- Tishkoff SA, Williams SM. Genetic analysis of African populations: Human evolution and complex disease. Nat Rev Genet. 2002;3:611–621. doi: 10.1038/ni0702-611. [DOI] [PubMed] [Google Scholar]