

Abstract
Grease to grease – this is how one might begin to describe the tendency of hydrophobic stretches in protein amino acid sequences to form transmembrane domains. While this simple rule contains a lot of truth, the mechanisms of membrane protein folding, the insertion of hydrophobic protein domains into the lipid bilayer, and the apparent existence of highly polar residues in some proteins in the hydrophobic membrane core are subjects of lively debate – an indication that many details remain unresolved. Here, we present a historical survey of recent insights from experiments and computational studies into the rules and mechanisms of α-helical membrane protein assembly and stability.
Biomembranes: More than just a barrier
Life would not be possible without biological membranes. Not only do they protect the vital contents of cells from the external environment, membranes compartmentalize cells and provide the setting for crucial physiological processes, such as the transport of molecules into and out of cells and between subcellular compartments, the control of electrochemical potentials, the redox reactions of photosynthesis, and the use of proton concentration gradients to produce ATP. Most of these processes are mediated by integral membrane proteins, which are fully embedded into the membrane lipid bilayer, and often comprise a substantial fraction of the membrane total mass, ranging from 18% in the insulating myelin membrane of neurons to 75% in the inner membrane of mitochondria1. The importance of membrane proteins is reflected in the fact that they account for more than 50% of known drug targets2 even though they constitute a minority (between 20% and 30%) of all the proteins encoded in fully-sequenced genomes3.
Membrane proteins are embedded in lipid bilayers comprised of a complex mixture of a variety of lipid molecules, predominantly phospholipids, with varying lengths and degrees of saturation of their hydrocarbon tails, and polar headgroups with diverse chemical functionality. In mammalian cells, cholesterol is a major and important component. Membrane lipid composition varies widely between species, tissues, and organelles and is further complicated by the possibility of microdomain formation involving cholesterol, also known as lipid rafts4. Biomembrane lipid bilayers must be in a fluid state under physiological conditions. X-ray and neutron diffraction measurements5, 6 and atomistic molecular dynamics (MD) simulations7 reveal detailed microscopic insights into the heterogeneous structure of lipid bilayers, as depicted in Fig. 1 for 1,2-dioleoyl-sn-glycero-3-phosphocholine (DOPC). The hydrocarbon core is a prominent feature and represents a barrier for polar molecules. However, the hydrocarbon core only comprises about half of the thickness of the lipid bilayer; the remainder is contributed by the polar interface region comprised, in the case of phospholipids, of fatty acid carbonyl groups, glycerol, negatively charged phosphate groups, other polar or charged groups, and waters of hydration, depending on the particular lipid under consideration. Water molecules are able to penetrate deeply into this interface region. Structural heterogeneity, which is enhanced by the fluid character of the lipid bilayer and its inherent thermal fluctuations, results in a continuous and gradual transition in polarity, from the hydrophobic environment in the hydrocarbon core to the polar environment of the hydrated lipid headgroups, over a length scale of ~1 nm along the transmembrane (TM) direction.
Fig. 1.

The structure of a fluid lipid bilayer. (A) Distribution of chemical groups in a 1,2-dioleoyl-sn-glycero-3-phosphocholine (DOPC) bilayer described by density profiles along the membrane normal; (B) simulation snapshot of a DOPC membrane bilayer (reprinted from White & von Heijne8).
Non-polar interactions are prevalent within the membrane lipid bilayer hydrocarbon core. However, ionic and/or zwitterionic lipid headgroups give rise to strong electrostatic interactions in the polar interface region, which contribute significantly, not only to the forces that maintain the bilayer structure of a biological membrane, but also to the stability and function of membrane-embedded proteins.
The major player in membrane protein assembly: the translocon complex
The dominant structural motif of plasma-membrane proteins is the transmembrane helix, which typically consists of 20–30 amino acid residues. The helical secondary structure optimizes hydrogen bonding within the hydrophilic backbone, while the typically hydrophobic side chains are exposed to the lipid bilayer hydrocarbon core. The internal hydrogen-bonding is essential, because of the very high cost of partitioning free peptide bonds into non-polar phases9. Even then, the cost of partitioning hydrogen-bonded peptide bonds is high, which necessitates a sufficient number of non-polar amino acids to balance the cost. Another structural motif that has full internal hydrogen bonding is the β-barrel. But β-barrels, of which there are large numbers, are found only in the outer membranes of Gram-negative bacteria and mitochondria. Here we are concerned primarily with α-helical membrane proteins.
The hydrophobic character of TM helices poses a problem for membrane protein synthesis in the cytosol via translation at the ribosome, because hydrophobic domains tend to aggregate quickly and consequently precipitate in aqueous solution. Avoidance of this fatal problem calls for special cell machineries for the assembly of membrane proteins. The vast majority of plasma-membrane proteins are integrated into the membrane co-translationally by the heterotrimeric translocon complex Sec61αβγ in eukaryotes and the highly homologous SecYEG in bacteria. Sec61α and SecY form protein-conducting channels in, respectively, the endoplasmic reticulum and inner membrane of bacteria. Membrane insertion and transmembrane secretion begins after the ribosome docks onto the translocon complex. The docking process is mediated by signal recognition particles (SRPs) that recognize membrane and secreted proteins as they emerge from the ribosome8, 10.
The key component of the translocon complex is the Sec61α (eukaryotes) or SecY (prokaryotes) protein-conducting channel subunit. The available crystal structures of SecY reveal 10 TM segments surrounding an hour-glass shaped pore offering two exit paths for a translocating protein chain: one for secretion through the channel into an aqueous environment, and the other through a lateral gate into the membrane lipid bilayer (Fig. 2A) 8, 10. Hence, the decision between membrane partitioning or secretion is made as the nascent polypeptide chain passes through the pore of the translocon.
Fig. 2.

A biological hydrophobicity scale based on translocon mediated membrane insertion of peptide sequences. (A) Atomistic molecular dynamics configuration snapshot of the SecYEβ from Methanococcus jannaschii in a lipid bilayer. The SecY protein-conducting channel comprises ten TM helices (shown in orange, red and green), the two TM segments in red constitute the lateral gate. (image prepared with VMD11); (B) sketch of the in vitro translation assay of Hessa et al.12 to measure the apparent equilibrium between insertion into the ER membrane or secretion into the ER lumen of a helical test segment (H) (reprinted fromWhite & von Heijne 8, permission pending); (C) biological hydrophobicity scale describing the apparent free energy difference ΔGapp between membrane insertion and secretion into the ER lumen of a test segment with varying amino acid residues in its central position; (D) comparison of the biological hydrophobicity scale with hydrophobicity scales based on partitioning experiments (Wimley and White13, Radzicka and Wolfenden14) and MD simulations (MacCallum et al.15), see also MacCallum & Tieleman16; blue: aromatic, green: hydrophobic, yellow: hydrophilic, red: charged amino acids.
Hydrophobicity in the context of the translocon
The principles upon which the translocon selects a particular peptide sequence to be either inserted into the membrane or to be secreted through the hydrophobic barrier have been the subject of a steadily growing number of studies, particularly in the context of the physicochemical concept of hydrophobicity and its relevance in complex biological processes. In a groundbreaking study, carried out by Hessa et al.12, an in vitro transcription/translation assay was utilized to quantify the efficiency of insertion of designed peptide sequences (test segments) into the ER membrane. The test segments, consisting of 19 amino acid residues flanked on either side by an intrinsically unstructured linker sequence, were genetically engineered into the luminal domain of the bacterial leader peptidase (Lep) membrane protein, just after the two native TM segments. The fractions of inserted and secreted test segments were quantified using glycosylation sites engineered on both sides of the test segment. Because glycosylation by oligosaccharyltransferase can only take place in the ER lumen, a singly glycosylated Lep molecule indicates that the test segment has been inserted into the ER membrane, while a doubly glycosylated Lep molecule indicates that the segment has been secreted across the membrane into the ER lumen (Fig. 2B). The probability of membrane insertion (measured by the fraction of singly glycosylated Lep molecules observed on SDS-polyacrylamide gels) as a function of the test segment hydrophobic content, was found to follow a Boltzmann distribution, suggesting that membrane insertion could be treated as an apparent thermodynamic equilibrium process. The ratio of inserted to secreted test segments could then be interpreted as an equilibrium partition coefficient leading to an apparent free energy of insertion (ΔGapp) of the test segment as a function of sequence.
The collection of ΔGapp values for test segments containing each of the 20 natural amino acids at the center of an otherwise hydrophobic sequence, termed the biological hydrophobicity scale (Fig. 2C), correlates well to other biophysical hydrophobicity scales based on experimentally or computationally measured free energies of transfer from aqueous to membrane-mimetic environments (Fig. 2D) (reviewed 16). This suggests that hydrophobicity dominates the translocon’s selection of TM segments and that interactions within the translocon and with the surrounding lipid bilayer play a role in the recognition of TM segments.
The high degree of correlation between various hydrophobicity scales and the ‘biological’ hydrophobicity scale determined from the translocon assay, indicated by the linear fits in Fig. 2d, is accompanied by a notable compression of the range of apparent free energies of insertion. While the ΔGapp values span a range from approximately −1.0 to 3.5 kcal/mol in the translocon experiment, many other hydrophobicity scales based on partitioning experiments or MD simulations contain a range of free energies of transfer between the phases that range from approximately −5.0 to 15.0 kcal/mol. The fitted slopes in the correlation plots in Fig. 2d, which are typically significantly less than one, express this behavior. A notable feature in these hydrophobicity scales is that they describe the free energy of transfer of single amino acid sidechains15, 17, instead of full amino acids that contain the hydrophilic backbone. An exception is the Wimley-White9 hydrophobicity scale with values ranging from −2.0 to 3.5 kcal/mol, which takes into account the free energy contributions of amino acid sidechains in a pentapeptide, as well as the costly contribution of partitioning a peptide bond into a nonpolar environment.
If lipid-protein interactions play a role in TM segment recognition by the translocon, then the heterogeneous structure of the bilayer should be reflected by the ΔGapp values. Hessa et al.18, 19 analyzed the sensitivity of the apparent free energies of insertion for each amino acid residue to its position within the test segment, and found a generally strong position dependence for polar and charged residues, while the apparent free energies of insertion depend only weakly on position in the test peptide sequence for weakly polar and nonpolar residues (Fig. 3). The resulting ΔGapp profiles were found to be consistent with spatial distributions of amino acid residues from TM segments in integral membrane proteins of known structure18, 20.
Fig. 3.

Position dependence of the apparent free energy of insertion ΔGapp. Charged and hydrophilic amino acids (left panel) show a strong dependence of ΔGapp on their position within the test segment, in contrast to weakly hydrophilic or hydrophobic amino acids (right panel), as reported in Hessa et al. 18.
MD simulations of arginine in lipid bilayers: the atomistic picture
Atomistic MD simulations are potentially well suited to provide insights into how lipid-protein interactions might be involved in the recognition of TM segments by the translocon. However, despite their high correlation (see Fig. 2D), there is a notable quantitative difference between the biological hydrophobicity scale and water-to-bilayer transfer free energies calculated from MD simulations. How should these results be compared? To address this question, we focus on arginine (Arg), which, with a large hydrogen bond capacity and a pKa >12, could be considered the most hydrophilic of the natural amino acid residues. In addition, Arg residues are of particular interest because they play a leading role in several biological processes where membrane-protein interactions are key, such as voltage-dependent activation of ion channels21, and membrane permeabilization and translocation by antimicrobial and cell-penetrating peptides22, 23, respectively.
In MD simulations, the free energy profiles for transferring a charged group or molecule from bulk water into the bilayer can be conveniently obtained from the potential of mean force (PMF). The PMF is computed from the average force required to pull the group from one phase into the other under equilibrium conditions. In simulations designed to compute PMFs, the position of the pulled group with respect to the membrane is known precisely. Most studies have focused on the transfer of sidechain analogs from bulk water into the lipid bilayer15, 24. In the particular case of arginine, PMF calculations have been reported for the transfer of guanidinium, methylguanidinium, or propylguanidinium ions, as well as an Arg side chain in a polyleucine helix, into single lipid bilayers of various compositions using different force fields15, 24–28. A strong position dependence of the free energy of transfer along the TM direction is observed that is reminiscent of the ΔGapp as a function of Arg position in the test segment sequence reported by Hessa et al.18 (Fig. 4B). However, while in the Hessa et al. experiments the penalty of moving an Arg side chain from the end to the middle of a TM segment is ~2.5 kcal/mol, the majority of PMF calculations predict ~20 kcal/mol for the free energy transfer of an Arg side chain analog from water into the lipid bilayer hydrocarbon core (Fig. 4B).
Fig. 4.

Snorkeling of Arg residues in the center of a TM helix sequence towards the polar membrane interface. (A) Snapshots from MD simulations of a 19 residue poly-leucine helix with one arginine in its center (R10) in a 1-palmitoyl,2-oleoyl-sn-glycero-3-phosphocholine (POPC) membrane bilayer snorkeling to the lipid-water interface. Additionally, defects in the membrane bilayer allow lipid phosphate and carbonyl groups and water molecules to penetrate into the hydrocarbon core to solvate the charged guanidinium; (B) free energy profile for insertion of the guanidinium ion into the center of the bilayer obtained from a PMF calculation.
To begin to reconcile the large disparity between experimental and simulation values for the free energy of Arg insertion into membranes, it is important to realize that, in the translocon experiment, having an arginine in the middle of the sequence of a 19-residue test segment does not necessarily correspond to placing the Arg center of charge, located in the guanidinium moiety, at the center of the lipid bilayer. Indeed, MD simulations of polyleucine helices inserted in a lipid bilayer containing a single Arg residue show that the Arg side chain ”snorkels” a significant distance (~7 Å) towards the bilayer-water interface in order to maximize its interaction with lipid polar headgroups, such as phosphates or carbonyls, and water molecules that may be pulled into the bilayer (Fig. 4A)27. Thus, it is likely that sequence position dependence, as reported by Hessa et al.18, cannot be simply (or universally) translated to a simple 1-D reaction coordinate such as position along the TM direction.
A pioneering simulation study on this subject was performed by Allen and coworkers26, where the free energy profile for inserting an Arg-containing poly-Leu helix into the bilayer is extended into a second dimension, namely the displacement of the Arg charge from the position of the corresponding C-alpha carbon in the peptide. Their results describe clearly the effects of Arg sidechain “snorkeling” on the free energy profile, as well as a 4–5kcal/mol barrier that separates both possible sidechain orientations (up and down, see Fig. 4A), when the Arg residue is located in the membrane center. This barrier compares well to the difference in the free energy penalty obtained for the transfer of an Arg containing poly-Leu helix into the bilayer (17 kcal/mol26), which accounts for sidechain “snorkeling”, and corresponding free energy penalties obtained for just the guanidinium moiety (24 kcal/mol27, Fig. 4B).
Although consideration of the offset between Arg position in a TM helix sequence and the likely location of the Arg center of charge in the membrane accounts for a substantial portion of the difference between translocon and simulation data, a discrepancy remains27, which is likely due to fundamental differences in the corresponding equilibria. The 1-D PMF profiles from MD simulations, as well as data from experiments that measure equilibrium partitioning between water and a hydrophobic phase17, report free energies of transfer from an aqueous environment to a membrane-mimetic environment. However, the nature of the reference state in the biological scale is less clear. In the translocon experiment, the translocating test segment is cotranslationally inserted into the pore of the translocon (possibly through a non-equilibrium process involving the input of energy from ATP/GTP hydrolysis), and will presumably sample the membrane environment through the translocon lateral gate. Hence, it is reasonable to hypothesize that the ΔGapp values from the translocon assay reflect partitioning between the translocon pore and the membrane lipid bilayer. The translocon pore is presumably filled with water molecules (see Fig. 2A), but it is unlikely that this environment is akin to a bulk water phase27.
Thermodynamics of TM helix insertion via the translocon
Comparing the equilibria of partitioning of TM helices into a membrane from a bulk water environment, as well as from the interior of the translocon, was the focus of a recent MD study, which used extensive alchemical free energy perturbation (FEP) calculations29 on a polyleucine helix with a single arginine side chain in three different environments: bulk water, the translocon pore, and a lipid bilayer. The free energy differences obtained from these simulations were used to construct the thermodynamic cycles shown in Fig. 5, which includes the cost of transferring the Arg sidechain from bulk water and into the translocon pore or the lipid bilayer.
Fig. 5.
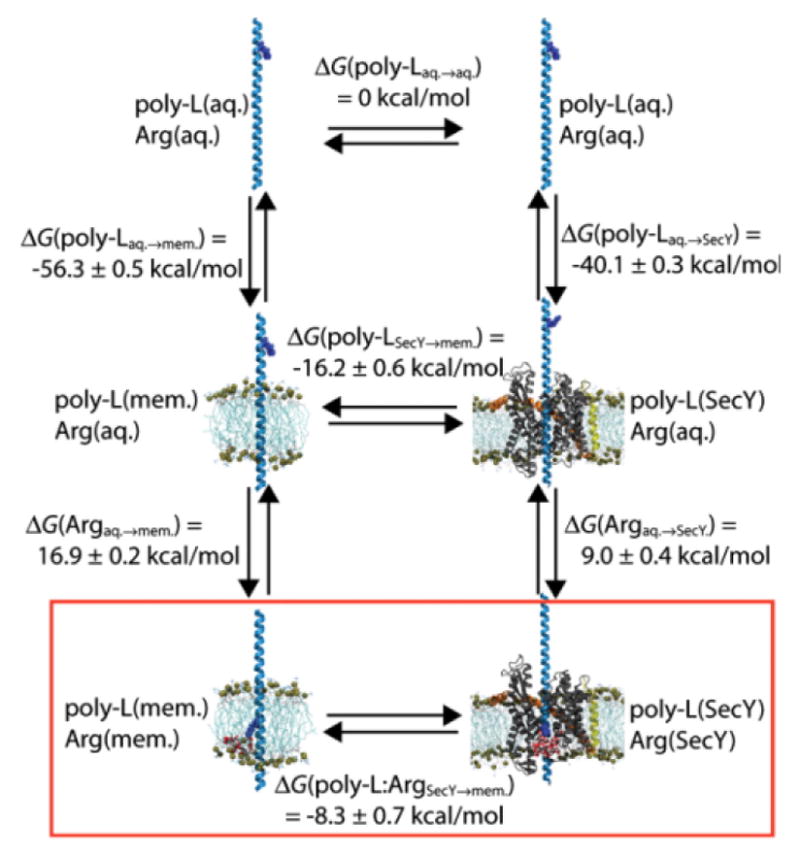
Thermodynamic cycles of helix partitioning between water, the translocon pore and the membrane bilayer. Free energy differences were computed for the insertion of an arginine-bearing polyleucine helix into a 1,2-dipalmitoyl-sn-glycero-3-phosphocholine (DPPC) bilayer and the translocon pore from aquoues solution, as well as for partitioning between the translocon pore and the DPPC bilayer (reprinted from Gumbart et al.29).
A comparison of the free energies of transferring the helix from a bulk-water environment into the lipid bilayer or into the translocon pore suggests that the translocon pore does not resemble a bulk aqueous environment, because transferring the hydrophobic polyleucine helix into the translocon pore is only 16.2 kcal/mol less favorable than transferring the same helix into the lipid bilayer. Moreover, the calculations predict that the transfer of the arginine from bulk water into the interior of the translocon is accompanied by a substantial free energy penalty (~9 kcal/mol).
Partitioning of the helix from the translocon pore into the lipid bilayer is favorable with and without the arginine side chain present. However, with the arginine being exposed to bulk water, the transfer of the polyleucine helix from the translocon pore into the lipid bilayer is roughly ~8 kcal/mol more favorable compared to the same equilibrium with the arginine in the translocon pore or the membrane, respectively. This finding supports the notion that the actual equilibrium sampled in the translocon assay describes partitioning of the test segment between the translocon pore and the hydrophobic lipid bilayer.
While the interior of the translocon may be considered a “less hydrophilic” environment than a bulk aqueous medium, the ER membrane in the experiments of Hessa et al. may be a “less hydrophobic” environment than the hydrocarbon core of a pure single-component lipid bilayer30. Another consideration is the effect of helix-helix interactions on the ΔGapp values due to the presence of the two, previously inserted, native TM domains of the leader peptidase (Fig. 2B). But it was shown experimentally that interactions of the test peptide with these helical domains is a second-order effect, and have only a minor influence on the measured ΔGapp values, unless specific hydrogen bonding patterns between two inserted TM domains are present31. However, this view was challenged by a recent coarse-grained modeling study of the translocon-mediated membrane insertion process that focused on the interactions between the previously inserted TM helices and the test segment, as well as the potential influence of these interactions on the free energy of insertion measured in the translocon assay32. This study found that the two native TM helices of the leader peptidase interact favorably with an arginine residue in the test segment. These favorable interactions stabilize the arginine residue in the membrane. Free energy differences between inserting a test segment with an alanine and an arginine residue in the center of the sequence were computed, taking into account several possible configurations of the previously inserted leader peptidase TM helices that could have potential stabilizing effects through interactions with the test segment during the insertion process. The resulting free energy of insertion for an arginine residue using this approach yielded a value of 4.0 kcal/mol, which is close to the ΔGapp value obtained in the transolocon-mediated insertion experiment.12
These various studies assume a partitioning equilibrium between peptides in the translocon pore and the membrane, while the role of the translocon is limited to catalyzing the establishment of this equilibrium by structural fluctuations that include an opening and closing of the lateral gate formed by its TM helices. Another recent study33, also based on coarse-grained MD simulations, has challenged this view and has suggested that the displacement of the translated peptide from the translocon pore into the bilayer may be irreversible. In this scenario the opening and closing equilibrium of the translocon lateral gate is able to actively control the insertion into or the translocation across the membrane bilayer. This study therefore analyzed if translated hydrophilic and hydrophobic peptides are able to modify actively the opening and closing of the translocon lateral gate via peptide-translocon interactions. For this purpose, several collective variables describing the open or closed state of the lateral gate were formulated and an extensive set of umbrella sampling simulations were performed to sample the free energy profiles along these variables in the presence of hydrophilic polyglutamine or hydrophobic polyleucine peptide helices. These free energy profiles showed indications that the presence of a hydrophobic peptide in the translocon pore favors an opening of the lateral gate, while the presence of a hydrophilic peptide has only a marginal effect on the opening/closing equilibrium of the lateral gate, resulting in a preferentially closed state also found in absence of a peptide. Considering the passage of the translated peptide through the lateral gate of the translocon into the membrane bilayer as a point of no return, the insertion into the membrane may be directly controlled by the probability of an open lateral gate, which is increased in the presence of a hydrophobic peptide in the translocon pore. The translated peptide would, therefore, be actively involved in the decision of its fate.
There are several potential mechanisms that explain the correlation between the biological hydrophobicity scale obtained from the translocon assay and other hydrophobicity schemes, as well as the discrepancies between the magnitudes of the apparent free energy contributions of individual amino acids. The hydrophobicity of a translated peptide plays a significant role in the decision of whether a polypeptide segment is inserted into the membrane or secreted. This decision may be made based on a partitioning equilibrium between the translocon pore and the membrane bilayer or an active regulation of the opening and closing of the lateral gate of the translocon due to interactions of the peptide with the translocon.
An experiment-based hydrophobicity scale based on β-barrel proteins
Very recently, a new experimental approach for studying hydrophobicity in a biological context was reported34. The approach is based on assaying the effects of mutations of a single-point mutation on the folding and membrane insertion of the β-barrel outer membrane phospholipase A (OmpLA). This enzyme is a common integral membrane protein in Gram-negative bacteria whose insertion into the membrane bilayer is translocon independent. Instead, this protein can spontaneously transition from an unfolded soluble state in guanidine hydrochloride to its folded transmembrane state in lipid bilayer vesicles. The mutation site shown in Fig. 6a (Ala-210), among others utilized in this study to analyze position dependence within the membrane bilayer, was chosen due to its position at a lipid exposed site on the exterior of the ‘barrel’ and near the center of the surrounding membrane in the folded and membrane-inserted state of OmpLA. This alanine was systematically mutated to all natural amino acids side chains, and the effect of each mutation on the stability and the insertion of the OmpLA protein into 1,2-di-lauroyl-sn-glycero-3-phosphocholine (DLPC) was analyzed to determine the corresponding water to bilayer folding free energy change. A hydrophobicity scale (Fig. 6B) for the partition of side chains into lipid was derived from the diference in folding free energy between mutants and wild-type, and an estimated value of the Ala side chain insertion free energy 34, 35.
Fig. 6.

Hydrophobicity scale on the basis of the folding and insertion equilibrium of OmpLA mutants. (A) OmpLA structure with mutation site (reprinted from Moon & Fleming34, permission pending); (B) hydrophobicity scale derived from the membrane insertion equilibria of the OmpLA mutants; (C) free energy differences between folded (membrane-inserted) and water soluble state as a function of the position of the OmpLA mutation site within the bilayer for arginine and leucine mutations as reported by Moon & Fleming 34
In contrast to the translocon assay, where a partitioning equilibrium between the translocon pore and the membrane bilayer must be assumed, the OmpLA folding experiment explicitly measures the equilibrium free energy of transferring a whole protein from the aqueous solvent into the hydrophobic membrane. In light of the fact that the two ‘biological’ experiments (translocon and OmpLA) report on what appear to be quite different partitioning processes, it is remarkable that the resulting hydrophobicity scales agree on two key aspects: 1) modest free energies of insertion values for all 20 natural amino acids, compared to other hydrophobicity scales that measure partitioning of amino acid side chain analogues between water and a membrane-mimetic hydrophobic phase (cf. Fig. 2d and 6B); and 2) a strong position dependence of the free energy of insertion for charged side chains (Fig. 6C). Interestingly, a simulation study on OmpLA wildtype and A210L and A210R mutants in DLPC 35, showed the same characteristic solvation features of the mutated Arg residue in the center of the membrane bilayer as described for the poly-leucine helix containing a single Arg inserted in POPC (Fig. 4A).
The robustness of the hydrophobicity scale derived from the OmpLA folding experiments is dependent on the similarity of the unfolded (water-soluble) reference state for each of the 20 amino acid side chains. The ideal reference state would be a completely solvent-exposed side chain in the unfolded state of the protein. Whether or not this idealized reference state is achieved for all OmpLA variants is not known, and will be difficult to ascertain due to the challenges associated with the structural determination of unfolded proteins, which are best described as broad ensembles of configurations. This fact complicates simulation studies of this particular system. In a very recent study, Gumbart et al.36 reported alchemical free energy perturbation simulations, similar to those described in the previous section, for three OmpLA mutants (A210R, A210L and A210S). To address the problem of the water-soluble reference state in absence of a known structure of the unfolded protein, three different cases were employed: a folded protein in aqueous solution, a seven residue strand including residues 207-213 from the OmpLA sequence, and the isolated amino acid in aqueous solution. Insertion free energies were determined as a range of values obtained from the different reference systems. Interestingly, qualitative agreement with the experimental data could only be achieved with varying reference states for the tested amino acids.
Simulating the process of peptide insertion without bias
None of the previously described MD simulations are able to provide a detailed description of the actual process of inserting a TM domain into a membrane bilayer, or an accurate estimate of the associated partitioning free energy driving this process. Related experiments describe the partitioning of model systems into bulk organic phases (e.g. side chain analog transfer into cyclohexane or octanol). However, side chain transfer energetics neglects the crucial contributions of the protein backbone and the inhomogeneity of the membrane environment. The in-vitro experiments of Hessa et al.12 and Moon and Fleming34, in turn, lack information about the non-inserted reference state. An ideal experiment would measure the partitioning of a single peptide sequence into and out of a lipid bilayer, affording the populations of the relevant states that are sampled at equilibrium, and directly providing the transfer free energy (Fig. 7). Experimentally, this has proved challenging, since peptides that are suitably hydrophobic to form membrane spanning helices are generally sparsely soluble in water and are prone to irreversible aggregation.
Fig. 7.
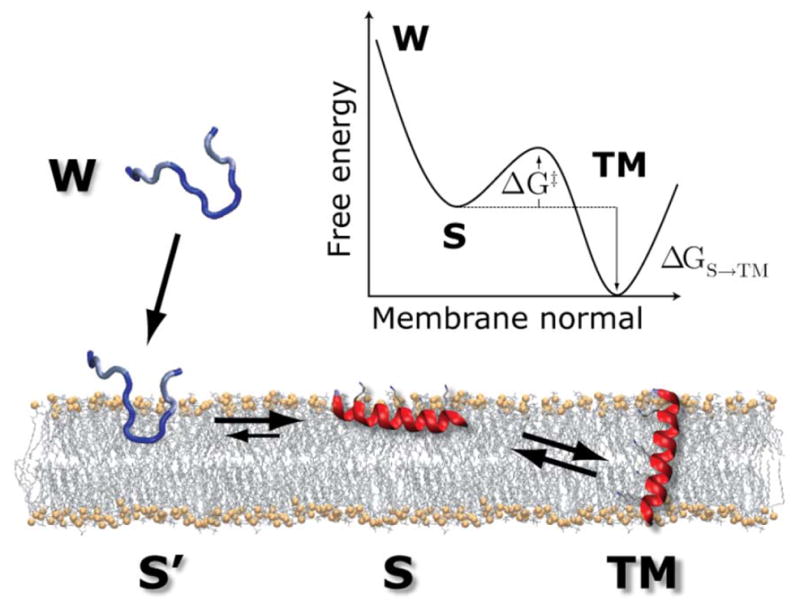
Scheme for an ideal experiment to measure peptide transfer energetics. This single molecule experiment can be performed in the computer via folding-partitioning simulations. Unfolded peptides in water (W) precipitate to the bilayer surface in an irreversible non-equilibrium step. The bilayer interface promotes secondary structure formation, resulting in an equilibrium between folded surface bound (S) and trans-membrane inserted (TM) configurations. The population ratio between S and TM states directly provides the free energy of insertion ΔGS→TM (reprinted with permission from Ulmschneider et al.37, Copyright (2011) American Chemical Society.
Ulmschneider et al.38, 39 have recently demonstrated the feasibility of carrying out this idealized experiment in silico by using unbiased, atomistic simulations to study the transfer of single helices into lipid bilayers. For example, during a large set of 1–2 microsecond simulations of polyleucine peptides, which were started in an unfolded configuration in the aqueous phase, the peptides were found to rapidly adsorb to the membrane interface, consistent with their experimentally observed insolubility in aqueous solution. At the interface, all peptides formed stable helices. Interfaces are known to drive secondary structure formation because of the cost associated with partial burial of exposed peptide bonds9; the formation of helical structure reduces the cost of partitioning peptide bonds as a result of backbone hydrogen bond formation. Once the secondary structure formation was complete the simulations were found to enter the equilibrium phase, during which the helices were found to oscillate freely between surface-bound (S) and transmembrane (TM) inserted configurations. The transition between the S and TM states is therefore well described by a two-state equilibrium. Membrane association and helix formation of the peptide were irreversible and therefore did not contribute to the following equilibrium.
To achieve sufficient sampling of the equilibrium, characterized by the number of transitions between S and TM states, the simulation temperatures were elevated from 30 °C to 80–210 °C. This approach was made possible by the observation, in the simulations as well as in accompanying experiments, that the peptides did not denature at elevated temperatures37. Because the secondary structure was temperature invariant, the interactions with the environment are unchanged, and the only effect of heating is to increase the sampling of states. The validity of this observation was apparent from the temperature invariance of the relative populations of S or TM states, as well as Arrhenius plots, which are perfectly linear over a wide range of temperatures. Increasing the temperature did not affect the partitioning properties, but it did provide better convergence and hence decreased simulation errors. This is surprising, as it indicates that the free energy difference between the S and the TM state does not contain a change of entropy. Moreover, the enthalpy difference appears to be temperature independent. Some degree of cancellation between an entropy change and a temperature dependence of the enthalpy difference may be present, but is unlikely to be very pronounced.
The absence of an entropy change between the S and the TM state of the peptide can be attributed to the unchanged helical structure of the peptide. The peptides even withstood unfolding at 210°C37. This result is consistent with the estimated high energetic penalty of exposing backbone hydrogen bonding sites inside the membrane9. This also applies to the surface-bound state, since the surface bound peptides reside primarily in the interface region between the carbonyl group and the lipid tails.
The simulations show the relevant states populated at equilibrium. No reaction coordinate that might distort the partitioning thermodynamics is chosen. The equilibrium observed in these MD simulations is between surface-bound helices, with their center of mass in the polar headgroup region and an orientation of the helix axis parallel to the membrane surface, and fully inserted membrane spanning TM helices. The probability of the TM state as a function of polyleucine peptide length, and the corresponding hydrophobic mismatch between the hydrophobic helix and the membrane, was studied and compared to equivalent experiments that employ the translocon assay40. The results were found to be independent of the presence of unstructured GGPG or GPGG linkers flanking the peptide as well as temperature. Preferential insertion into the membrane as a TM helix was found for polyleucine stretches that were approximately two residues shorter than in the translocon experiment. Interestingly, the transition profiles of preferential surface bound peptides with 5 or less leucines to preferentially inserted TM helices with more than 8 leucine residues were found to be in very close agreement to the translocon experiment, apart from the aforementioned shift by approximately two leucine residues (Fig. 8). Hence, the free energy differences between the S and the TM state were shifted by a constant amount of approximately 1.9 kcal/mole relative to the free energy differences between the two states sampled in the translocon experiment. Assuming a partitioning between the translocon pore and the membrane bilayer in the translocon assay, this 1.9 kcal/mol may be interpreted as the stabilization of polyleucine helices in the translocon pore relative to the surface bound state sampled in the MD simulations.
Fig. 8.

Probability of TM insertion of polyleucine peptides into lipid bilayer membranes. The figure compares results from unrestrained monomeric folding-partitioning simulations (B) to insertion propensities of the same peptides measured using an in-vitro translocon assay (A). (C) The insertion propensity does not depend on temperature, or the presence of flanking segments. (D) The free energy of insertion varies linearly with peptide length over the range of polyleucine peptides studied (number of Leu = 5–12) (reprinted with permission from Ulmschneider et al.37, Copyright (2011) American Chemical Society).
Atomic force microscopy offers a different view of membrane protein folding and stability
It is possible to pull transmembrane helices out of membranes one by one using Atomic force microscopy (AFM)41. In a classic AFM study of bacteriorhodopsin42, for example, a long, flexible cantilever with an atomically sharp probe attached to one end was used to scan the surface of a native bacteriorhodopsin membrane. The deflection of the cantilever as it moved across the surface was recorded, producing a topographic map of the surface (Fig. 9A). The AFM was then used to pull single molecules out of the surface while recording the force exerted on the cantilever. (A rescan of the surface after pulling revealed the vacancy in the membrane produced by pulling the single molecule out, Fig. 9B). Because both the force F on the cantilever and the distance d between the tip and the membrane can be measured simultaneously, the unfolding of the protein can be visualized as a force-distance (F-d) curve, as shown in Fig. 9D. The peaks corresponds to the pulling out of successive pairs of transmembrane helices: as the tether is pulled tight the force F increases until a helix pair snaps out of the membrane, relaxing the tension on the tether. The same process is repeated again for the next pair of helices, until only one helix remained.
Fig 9.
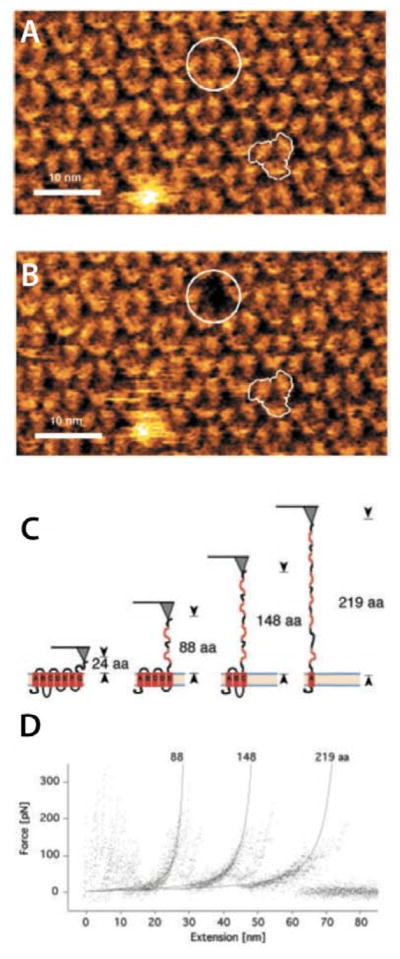
Unfolding bacteriorhodopsin using atomic force microscopy. (A) An AFM scan of the surface of a native bacteriorhodopsin (bR) membrane. The white the jagged white line indicates a bR trimer. The white circle indicates the bR monomer that is to be pulled from the membrane. (B) A rescan of the bR surface after pulling a single bR molecule out (white circle). (C) A schematic representation of the unfolding of bR as it is pulled from the membrane. (D) The force-distance diagram resulting from the pulling process. Each upward curve corresponds the unfolding of the segments indicated in panel C. (modified from Oesterhelt et al.42, reprinted with permission from AAA)
An important feature of AFM is that single molecules are studied, one at a time. The mechanical unfolding can be reversible, as was shown for partially unfolded bacteriorhodopsin molecules that were able to refold into the membrane, even against the force exerted by an attached AFM tip.48 However, we note that mechanical protein unfolding observed in single molecule force spectroscopy experiments is a non-equilibrium process. In addition, the unfolded state is an extended poly- peptide chain in aqueous buffer. This means that the underlying thermodynamic states are the folded protein in the bilayer and the unfolded protein in water. The data nevertheless are extremely useful, because the non-equilibrium problem can be solved using Jarzynski’s equality43. The careful application of the Jarzynski equality to F-d curves collected over wide range of temperatures and pulling rates yields44, for the first five helices of bR, a free energy difference between membrane-folded and water-unfolded states of 230±40 kcal mol−1, or an average free energy change of about 1.3 kcal mol−1 per residue. Is this free energy reasonable? Taking into account intrahelical H-bond formation, the expected WW-octanol free energy value9, 13 is estimated to be about 200 kcal mol−1, which is remarkably close the value computed using the Jarzynski Equation.
Concluding remarks and outlook
In this tutorial, we have discussed the translocon pathway of TM helix insertion into biological membranes, and the potentially important role of hydrophobicity in dictating the thermodynamics of this process. We compared the biological hydrophobicity scale, deduced from experiments on the translocon and the sequence-dependent probability of helix insertion, with other hydrophobicity scales based on experiments and simulation. Recent research has identified several microscopic details that influence the free energy penalties associated with the transfer of polar and charged amino acids into the hydrophobic core of the bilayer, such as the heterogenous structure of lipid membranes with smooth changes in polarity and the ability of long sidechains to “snorkel” from the membrane center towards the significantly more polar interface region. However, our comparison of various hydrophobicity scales also exposes several gaps in knowledge, which are related to the lack of understanding of many mechanistic details of TM helix insertion by the translocon. These include the potential role of ATP/GTP-hydrolysis for co-translational peptide insertion into the translocon, the presence or absence of a chemical equilibrium, as well as the role of interactions with previously inserted TM domains for partitioning of the peptide between the translocon pore and the membrane interior. In the case of an equilibrium process, it is likely that partitioning between the translocon pore and the membrane bilayer decides the fate of the putative TM helix. Hence, the translocon-derived biological hydrophobicity scale is based on a different reference state compared to more traditional hydrophobicity scales, which are based on partitioning between water and a hydrophobic phase. With the translocon pore being a more complex environment than water, these differences seem to result in a compressed range of the free energy differences in the biological hydrophobicity scale.
Considerable uncertainties are also associated with other, seemingly more straightforward examples of membrane protein insertion, such as the equilibrium between the unfolded soluble and the folded membrane-inserted state of OmpLA. Very little is known about the denatured form of the protein and the solvent exposure of the respective mutation site. While not being relevant for the analysis of the observed chemical equilibrium, it is also worth mentioning that very little is known about how equilibrium is established in the translocon-independent insertion and folding of OmpLA into the membrane bilayer. How do polar and charged sidechains cross the hydrophobic bilayer in this case? Does the short length of the DLPC lipid tails play a crucial role in this context?
The driving forces that determine the final folding of a membrane protein after insertion into the membrane bilayer are presently also not fully understood. For water-soluble proteins the expulsion of water from the forming hydrophobic core of the protein is known to be a dominating step that contributes significantly to the stability of the native protein. A mechanism of similar impact has not yet been identified for the folding of membrane proteins.
Very recently, it has been demonstrated that the translocon-independent membrane insertion and folding can be captured in atomistic detail by means of computer simulations. Short peptides attach quickly to the membrane-water interface, fold into their helical structure and partition between a surface-bound and a membrane inserted TM helical state on timescales accessible to MD simulations, at least at elevated temperatures. A similar approach for full-length membrane proteins containing multiple membrane-spanning secondary structural elements is still out of reach, and is expected to be much more challenging than the case of water soluble proteins, for which it appears that, given ample simulation time, accurate MD simulations of protein folding dynamics are achievable with current methodology39. In addition to the increased complexity of the inhomogeneous membrane protein environment versus aqueous solution, dynamical processes in the membrane are typically about three orders of magnitude slower than in water due to the significantly increased viscosity.
State-of-the-art atomistic simulation techniques generally offer the advantage of detailed structural and dynamical information that leads, in principle, to a more complete understanding of the driving forces for microscopic processes. However, these techniques are pushed to their limits in the case of membrane proteins. The simulation studies presented here therefore either focus on “brute force” simulations of simplified model systems, e.g., single transmembrane helices, or involve biased simulation techniques, such as umbrella sampling. In any event, significant computational resources are required to obtain reliable results with atomistic simulations. Coarse-grained models, which are capable of handling longer timescales and more complex systems, sacrifice atomistic detail, which includes essential features such as sidechain “snorkeling” and the heterogeneity, as well defects in the membrane bilayer structure.
Obvious inadequacies in current simulation methodology underscore the need for new experimental tools to study membrane protein structure, stability, and dynamics with molecular resolution, e.g., to further unravel the details of the working mechanisms of a complex molecular machine like the translocon. We described here a notable and promising experimental approach for determining the interactions that contribute to folding and unfolding of membrane proteins, namely, single molecule force spectroscopy41. A great deal of its value comes from the fact that single molecules can be studied. Upon unfolding single molecules by pulling them out of the lipid bilayer, key interactions can be studied, such as TM helix-helix interactions and cooperative effects in multimeric proteins. Additionally, a single molecule technique also allows to obtain statistical information on different unfolding pathways, as has been shown for bacteriorhodopsin (bR)41. By analyzing the patterns of TM segment removal, unfolding pathways and their population have been identified in various oligomerization states. While these pathways were largely conserved for bR in the monomeric, dimeric and native trimeric form, it could be shown that the required forces to unfold one bR molecule depend significantly on the intermolecular interactions between bR monomers in the dimeric and trimeric states, as well as the population of the identified unfolding pathways.
Besides understanding the process of inserting and folding a protein into the membrane, membrane protein structure prediction is also a line of research of great significance, in particular due to the persistent difficulties in determining membrane proteins structures via crystallography and magnetic resonance techniques. For this purpose knowledge based empirical methods based on the Rosetta algorithm for soluble proteins45 have been adopted using information from known transmembrane protein structures and close homologues46. The applied scoring function models the membrane bilayer environment by several layers, describing the polar headgroup region, the hydrophobic-polar interface and outer and inner hydrophobic layers, approximating the complexity depicted in Fig. 1a. The approach yields promising results for smaller membrane proteins or fragments up to 4 TM domains with short connecting loops, but encounters difficulties with larger membrane proteins with a more complex structure. Interestingly, it was found that the de novo membrane protein structure prediction algorithm is significantly more stable when the putative TM helix domains are added to the folding calculation sequentially. This procedure is reminiscent to the sequential insertion of TM helices by the translocon prior to folding into the tertiary structure. Considerable improvement for large membrane proteins can be achieved by adding a limited number of residue-residue interactions to constrain the helix-helix packing 47.
The insertion of membrane proteins and the assembly of TM segments into native membrane proteins is an active field of research with many remaining challenges. The relevance of membrane proteins for crucial physiological processes and their leading role as drug targets provide a strong motivation for understanding the process of membrane protein insertion, folding, stability, and dynamics.
Acknowledgments
This research was supported by a fellowship from the German Academy of Sciences Leopoldina to M.H., a Marie Curie International Fellowship to M.B.U, and by grants from the National Institute of General Medical Science GM74737 (S.H.W.) and Program Project GM86685 from NINDS and NIGMS (S.H.W.; D.J.T.), and NSF grant CHE-0750175 (D.J.T.).
References
- 1.Tan S, Tan H, Chung M. Proteomics. 2008;8:3924–3932. doi: 10.1002/pmic.200800597. [DOI] [PubMed] [Google Scholar]
- 2.Hopkins AL, Groom CR. Nature Reviews. 2002;1:727–730. doi: 10.1038/nrd892. [DOI] [PubMed] [Google Scholar]
- 3.Wallin E, von Heijne G. Protein Sci. 1998;7:1029–1038. doi: 10.1002/pro.5560070420. [DOI] [PMC free article] [PubMed] [Google Scholar]
- 4.Simons K, Toomre D. Nat Rev Mol Cell Biol. 2000;1:31–39. doi: 10.1038/35036052. [DOI] [PubMed] [Google Scholar]
- 5.White SH, Wiener MC. In: Membrane Structure and Dynamics. Merz KM, Roux B, editors. Birkhäuser; Boston: 1996. pp. 127–144. [Google Scholar]
- 6.Nagle JF, Tristram-Nagle S. Biochim Biophys Acta. 2001;1469:159–195. doi: 10.1016/s0304-4157(00)00016-2. [DOI] [PMC free article] [PubMed] [Google Scholar]
- 7.Benz RW, Castro-Román F, Tobias DJ, White SH. Biophys J. 2005;88:805–817. doi: 10.1529/biophysj.104.046821. [DOI] [PMC free article] [PubMed] [Google Scholar]
- 8.White SH, Von Heijne G. Ann Rev Biophys Biophys Chem. 2008;37:23–42. doi: 10.1146/annurev.biophys.37.032807.125904. [DOI] [PubMed] [Google Scholar]
- 9.White SH, Wimley WC. Annu Rev Biophys Biomol Struc. 1999;28:319–365. doi: 10.1146/annurev.biophys.28.1.319. [DOI] [PubMed] [Google Scholar]
- 10.Park E, Rapoport T. Annual Review of Biophysics. 2012:41. doi: 10.1146/annurev-biophys-050511-102312. [DOI] [PubMed] [Google Scholar]
- 11.Humphrey W, Dalke W, Schulten K. J Mol Graph. 1996;14:33–38. doi: 10.1016/0263-7855(96)00018-5. [DOI] [PubMed] [Google Scholar]
- 12.Hessa T, Kim H, Bihlmaier K, Lundin C, Boekel J, Andersson H, Nilsson IM, White SH, von Heijne G. Nature. 2005;433:377–381. doi: 10.1038/nature03216. [DOI] [PubMed] [Google Scholar]
- 13.Wimley WC, Creamer TP, White SH. Biochemistry. 1996;35:5109–5124. doi: 10.1021/bi9600153. [DOI] [PubMed] [Google Scholar]
- 14.Wolfenden R. J Gen Physiol. 2007;129:357–362. doi: 10.1085/jgp.200709743. [DOI] [PMC free article] [PubMed] [Google Scholar]
- 15.MacCallum JL, Bennett WFD, Tieleman DP. Biophys J. 2008;94:3393–3404. doi: 10.1529/biophysj.107.112805. [DOI] [PMC free article] [PubMed] [Google Scholar]
- 16.MacCallum JL, Tieleman DP. Trends Biochem Sci. 2011;36:653–662. doi: 10.1016/j.tibs.2011.08.003. [DOI] [PubMed] [Google Scholar]
- 17.Radzicka A, Pedersen L, Wolfenden R. Biochemistry. 1988;27:4538–4541. doi: 10.1021/bi00412a047. [DOI] [PubMed] [Google Scholar]
- 18.Hessa T, Meindl-Beinker NM, Bernsel A, Kim H, Sato Y, Lerch-Bader M, Nilsson I, White SH, von Heijne G. Nature. 2007;450:1026–1030. doi: 10.1038/nature06387. [DOI] [PubMed] [Google Scholar]
- 19.Hessa T, White SH, von Heijne G. Science. 2005;307:1427. doi: 10.1126/science.1109176. [DOI] [PubMed] [Google Scholar]
- 20.Ulmschneider MB, Sansom MSP, Di Nola A. Proteins. 2005;59:252–265. doi: 10.1002/prot.20334. [DOI] [PubMed] [Google Scholar]
- 21.Swartz KJ. Nature. 2008;456:891–897. doi: 10.1038/nature07620. [DOI] [PMC free article] [PubMed] [Google Scholar]
- 22.Marks JR, Placone J, Hristova K, Wimley WC. J Am Chem Soc. 2011;133:8995–9004. doi: 10.1021/ja2017416. [DOI] [PMC free article] [PubMed] [Google Scholar]
- 23.Wimley W, Hristova K. J Membr Biol. 2011;239:27–34. doi: 10.1007/s00232-011-9343-0. [DOI] [PMC free article] [PubMed] [Google Scholar]
- 24.Johansson AC, Lindahl E. J Chem Phys. 2009;130:185101–185101–185101–185108. doi: 10.1063/1.3129863. [DOI] [PubMed] [Google Scholar]
- 25.Li L, Vorobyov I, MacKerell AD, Jr, Allen TW. Biophys J. 2008;94:L11–13. doi: 10.1529/biophysj.107.121566. [DOI] [PMC free article] [PubMed] [Google Scholar]
- 26.Dorairaj S, Allen TW. Proc Natl Acad Sci USA. 2007;104:4943–4948. doi: 10.1073/pnas.0610470104. [DOI] [PMC free article] [PubMed] [Google Scholar]
- 27.Schow EV, Freites JA, Cheng P, Bernsel A, von Heijne G, White SH, Tobias DJ. J Membr Biol. 2011;239:35–48. doi: 10.1007/s00232-010-9330-x. [DOI] [PMC free article] [PubMed] [Google Scholar]
- 28.MacCallum JL, Bennett WFD, Tieleman DP. J Gen Physiol. 2007;129:371–377. doi: 10.1085/jgp.200709745. [DOI] [PMC free article] [PubMed] [Google Scholar]
- 29.Gumbart J, Chipot C, Schulten K. Proc Natl Acad Sci USA. 2011;108:3596–3601. doi: 10.1073/pnas.1012758108. [DOI] [PMC free article] [PubMed] [Google Scholar]
- 30.Johansson ACV, Lindahl E. Proc Natl Acad Sci USA. 2009;106:15684–15689. doi: 10.1073/pnas.0905394106. [DOI] [PMC free article] [PubMed] [Google Scholar]
- 31.Meindl-Beinker NM, Lundin C, Nilsson I, White SH, Von Heijne G. EMBO Rep. 2006;7:1111–1116. doi: 10.1038/sj.embor.7400818. [DOI] [PMC free article] [PubMed] [Google Scholar]
- 32.Rychkova A, Vicatos S, Warshel A. Proc Natl Acad Sci USA. 2010;107:17598–17603. doi: 10.1073/pnas.1012207107. [DOI] [PMC free article] [PubMed] [Google Scholar]
- 33.Zhang B, Miller TF., III Proc Natl Acad Sci USA. 2010;107:5399–5404. doi: 10.1073/pnas.0914752107. [DOI] [PMC free article] [PubMed] [Google Scholar]
- 34.Moon CP, Fleming KG. Proc Natl Acad Sci USA. 2011;108:10174–10177. doi: 10.1073/pnas.1103979108. [DOI] [PMC free article] [PubMed] [Google Scholar]
- 35.Fleming PJ, Freites JA, Moon CP, Tobias DJ, Fleming KG. Biochim Biophys Acta. 2012;1818:126–134. doi: 10.1016/j.bbamem.2011.07.016. [DOI] [PMC free article] [PubMed] [Google Scholar]
- 36.Gumbart J, Roux B. Biophys J. 2012;102:795–801. doi: 10.1016/j.bpj.2012.01.021. [DOI] [PMC free article] [PubMed] [Google Scholar]
- 37.Ulmschneider JP, Smith JC, White SH, Ulmschneider MB. J Am Chem Soc. 2011;133:15487–15495. doi: 10.1021/ja204042f. [DOI] [PMC free article] [PubMed] [Google Scholar]
- 38.Ulmschneider MB, Smith JC, Ulmschneider JP. Biophys J. 2010;98:L60–L62. doi: 10.1016/j.bpj.2010.03.043. [DOI] [PMC free article] [PubMed] [Google Scholar]
- 39.Ulmschneider MB, Doux JPF, Killian JA, Smith J, Ulmschneider JP. J Am Chem Soc. 2010;132:3452–3460. doi: 10.1021/ja909347x. [DOI] [PubMed] [Google Scholar]
- 40.Jaud S, Fernández-Vidal M, Nillson I, Meindl-Beinker NM, Hübner NC, Tobias DJ, von Heijne G, White SH. Proc Natl Acad Sci USA. 2009;106:11588–11593. doi: 10.1073/pnas.0900638106. [DOI] [PMC free article] [PubMed] [Google Scholar]
- 41.Sapra K, Besir S, Oesterhelt D, Muller D. Journal of Molecular Biology. 2006;355:640–650. doi: 10.1016/j.jmb.2005.10.080. [DOI] [PubMed] [Google Scholar]
- 42.Oesterhelt F, Oesterhelt D, Pfeiffer M, Engel A, Gaub HE, Müller DJ. Science. 2000;288:143–146. doi: 10.1126/science.288.5463.143. [DOI] [PubMed] [Google Scholar]
- 43.Jarzynski C. Phys Rev E. 1997;56:5018–5035. [Google Scholar]
- 44.Müller DJ, Kessler M, Oesterhelt F, Möller C, Oesterhelt D, Gaub H. Biophys J. 2002;83:3578–3588. doi: 10.1016/S0006-3495(02)75358-7. [DOI] [PMC free article] [PubMed] [Google Scholar]
- 45.Rohl C, Strauss C, Misura KMS, Baker D. Methods Enzymol. 2004;383:66–93. doi: 10.1016/S0076-6879(04)83004-0. [DOI] [PubMed] [Google Scholar]
- 46.Yarov-Yarovoy V, Schonbrun J, Baker D. Proteins. 2006;62:1010–1025. doi: 10.1002/prot.20817. [DOI] [PMC free article] [PubMed] [Google Scholar]
- 47.Barth P, Wallner B, Baker D. Proc Natl Acad Sci USA. 2009;106:1409–1414. doi: 10.1073/pnas.0808323106. [DOI] [PMC free article] [PubMed] [Google Scholar]
- 48.Kessler M, Gottschalk K, Janovjak H, Müller DJ, Gaub HE. J Mol Biol. 2006;357:644–654. doi: 10.1016/j.jmb.2005.12.065. [DOI] [PubMed] [Google Scholar]