

Abstract
Clinical effects of transcranial electrical stimulation with weak currents are remarkable considering the low amplitude of the electric fields acting on the brain. Elucidating the processes by which small currents affect ongoing brain activity is of paramount importance for the rational design of noninvasive electrotherapeutic strategies and to determine the relevance of endogenous fields. We propose that in active neuronal networks, weak electrical fields induce small but coherent changes in the firing rate and timing of neuronal populations that can be magnified by dynamic network activity. Specifically, we show that carbachol-induced gamma oscillations (25–35 Hz) in rat hippocampal slices have an inherent rate-limiting dynamic and timing precision that govern susceptibility to low-frequency weak electric fields (<50 Hz; <10 V/m). This leads to a range of nonlinear responses, including the following: (1) asymmetric power modulation by DC fields resulting from balanced excitation and inhibition; (2) symmetric power modulation by lower frequency AC fields with a net-zero change in firing rate; and (3) half-harmonic oscillations for higher frequency AC fields resulting from increased spike timing precision. These underlying mechanisms were elucidated by slice experiments and a parsimonious computational network model of single-compartment spiking neurons responding to electric field stimulation with small incremental polarization. Intracellular recordings confirmed model predictions on neuronal timing and rate changes, as well as spike phase-entrainment resonance at 0.2 V/m. Finally, our data and mechanistic framework provide a functional role for endogenous electric fields, specifically illustrating that modulation of gamma oscillations during theta-modulated gamma activity can result from field effects alone.
Introduction
Transcranial electrical stimulation (TES) with weak currents is actively investigated to treat a range of neurological and psychiatric disorders (Fregni et al., 2006; Liebetanz et al., 2006). Because of the general safety profile (Nitsche and Paulus, 2000; Iyer et al., 2005), low-intensity TES is also used as a tool for cognitive research in healthy subjects (Marshall et al., 2005). These studies leverage the induction of lasting changes, but evidently these long-term effects must be mediated by immediate effects during stimulation. Indeed, there is evidence that low-intensity TES can affect ongoing brain activity (Kirov et al., 2009; Pogosyan et al., 2009). Despite its promise, fundamental questions remain on how weak-current TES can affect ongoing brain activity. Simulations of noninvasive electrical stimulation show that electric fields in cortex reach a maximum of ∼1 V/m per 1 mA of applied current (Datta et al., 2009). Animal studies indicate that these electric fields will incrementally polarize somatic membranes at levels below synaptic background activity (somatic polarization, <0.3 mV per V/m uniform electric field) (Bikson et al., 2004). Yet, there is increasing evidence that very weak electric fields (of ∼1 V/m) can acutely modulate coherent network activity (Deans et al., 2007), indicating that small incremental polarization of individual neurons, when operating coherently on a population of coupled neurons, can entrain ongoing network dynamics (Parra and Bikson, 2004). The aim of this study is to explicate and differentiate the specific aspects of network dynamics, in particular of endogenous oscillatory activity, that facilitate this interaction.
The hippocampal slice preparation is a well established tool to characterize the effects of applied fields (Jefferys, 1981; Gluckman et al., 1996) and the cellular and network properties underlying endogenous coherent oscillations (Traub et al., 1996; Bartos et al., 2007). Transcranially applied currents result in approximately uniform fields on length scales of single neurons. Uniform electric fields with controlled orientation can be readily generated across hippocampal slices. Carbachol perfusion generates well characterized and stable beta/gamma activity (25–40 Hz) (Fisahn et al., 1998). We analyzed the changes in extracellular local field potential oscillations induced by carbachol in hippocampal slices during application of low-intensity and low-frequency uniform fields (<10 V/m, <50 Hz). The observed modulation in power of the endogenous oscillations are explained by a computational network model of excitatory and inhibitory spiking neurons, which are incrementally polarized in accordance with previous hippocampal recordings. The model predicted that altered network dynamics are reflected in altered population firing rate, increased spike timing, or phase-entrainment resonance, predictions that were then confirmed with intracellular recordings of pyramidal neurons. These results establish a variety of basic mechanisms by which low-amplitude applied currents can acutely impact oscillatory brain activity and thus may ultimately contribute to the rational design of electrotherapies. In addition, our results provide a precise and quantitative mechanism by which endogenous fields may affect ongoing network activity. Specifically, we demonstrate modulation of gamma activity with fields comparable in magnitude to endogenous theta (1 V/m, 7 Hz) (Buzsáki, 2002).
Materials and Methods
Hippocampal slice preparation.
450 μm horizontal hippocampal slices (cut with an Integraslice 7550 PSDS, Campden Instruments) were prepared from male Wistar rats (3–4 weeks old), which were anesthetized with intraperitoneal ketamine (7.4 mg/kg) and xylazine (0.7 mg/kg), and killed by cervical dislocation (City University of New York Institutional Animal Care and Use Committee, protocol 0707/0846). The slices were stored in a holding chamber submerged in artificial CSF (ACSF) consisting of the following (in mm): NaCl 126; KCl 3; NaH2 PO4 1.25; MgSO4 2; CaCl2 2; NaHCO3 24; glucose 10 (bubbled with a mixture of 95% O2-5% CO2). After >60 min, slices were transferred to an interface recording chamber at 34∘C. Gamma oscillations were induced by perfusing the slices with ACSF containing 20 μm carbachol (carbamoylcholine chloride, Sigma-Aldrich).
Extracellular and intracellular recordings.
Recordings of extracellular field potentials in the pyramidal layer of the CA3 region of the hippocampus were obtained using glass micropipettes (2–6 MΩ, pulled on a P-97, Sutter Instruments) filled with ACSF or 125 mm NaCl. Intracellular recordings were performed using sharp electrodes (80–120 MΩ). The signals were amplified using an AxoClamp-2B (Molecular Devices), low-pass filtered with a 100 Hz cutoff frequency for extracellular recordings and 1 kHz cutoff for intracellular recordings (LPF-8, Warner Instruments), and then digitized at 2 kHz (Power 1401 ADC/DAC, Cambridge Electronic Design). The data were read and saved using SIGNAL (Cambridge Electronic Design). To reduce noise and stimulation artifacts, the voltage recordings were always performed relative to an isopotential electrode in the bath (Fig. 1A).
Figure 1.

Experimental and computational network methods. A, Experimental setup: spatially uniform electric fields were applied across hippocampal slices in an interface chamber. Recording of LFPs and intracellular potentials were performed in the CA3 region of hippocampus relative to an isopotential electrode in the bath (dotted line). The orientation of the pyramidal layer of the CA3c region was perpendicular to the applied field. B, Computational network model: 800 excitatory and 200 inhibitory neurons are synaptically connected with various synaptic strengths w. C, The electrical stimulation in the model was implemented as low-pass-filtered current (τE = 10 ms) that is proportional to the applied field E. D, The polarization of the single-neuron model of Izhikevich to a current injection (dashed blue line) exhibits low-pass characteristics. A better match to experimental data is observed with the additional low-pass filter. The combined model (solid red line) has a peak gain at ∼7 Hz.
Electrical field stimulation.
Spatially uniform electric fields were applied to slices with varying frequencies and amplitudes by passing current between two parallel Ag–AgCl wires (1 mm diameter, 10 mm long) placed in the ACSF across the slice (Gluckman et al., 1996; Ghai et al., 2000; Bikson et al., 2004; Radman et al., 2007; Su et al., 2008). Field waveforms were generated by a Power 1401 ADC/DAC (Cambridge Electronic Design) and converted to a controlled current source stimulus by an isolation unit (2200, A-M Systems). The electric field (V/m) in the chamber was measured by two recording electrodes separated by 1.5 mm and calibrated to the current passed through the Ag–AgCl electrodes. All experimental results are reported as a function of the electric field magnitude. The use of electric field allows precise reproducibility and quantitative comparison with both applied electrical stimulation and endogenous fields. Slices were aligned in the chamber such that the induced uniform electric field was parallel to the CA3c pyramidal neurons (Fig. 1A). Following previous convention, “positive” field polarity was defined as anode on the CA1 alveus side, and “negative” field polarity was defined as cathode on the CA1 alveus side (Bikson et al., 2004). Weak positive field stimulation is thus typically expected to depolarize CA3c soma, while weak negative field stimulation should hyperpolarize CA3c soma (Deans et al., 2007). Stimulation was applied 45–60 min after the application of carbachol. During that time, the oscillation stabilized in power and frequency. Unless otherwise stated, each stimulation lasted in all instances for 2 s, and signals were recorded in frames of 5 s (1.5 s before and after the stimulation). Frames with different stimulation frequencies and/or amplitudes were interleaved in random order.
Power analysis and statistics.
Stimulation artifacts in the extracellular recordings were minimized using an isopotential reference electrode, as described above. In addition, in the case of AC stimulation, a sinusoid was fit in amplitude, frequency, and phase, and subtracted from the extracellular trace. Spectrograms (see Figs. 3A, 4A) were then computed (300 ms hamming window, 90% overlap) on individual 5 s frames and averaged over 80 to 220 frames for each stimulation condition (amplitude and frequency) and slice. Percentage modulation in power was measured as a power ratio normalized by the prestimulus power in the frequency band of the endogenous oscillation (center frequency range, 25–35 Hz; bandwidth, 5 Hz). For each stimulation condition, distinct phenomena were observed; to quantify their dependence on electric field magnitude, distinct power ratios were chosen as follows: for the case of DC stimulation, modulation was quantified as the power ratio between stimulation and prestimulus periods; for the case of AC modulation, as the power ratio between intervals of positive fields and intervals of negative fields; and in the case of the half-harmonics, as the power ratio between the half-harmonic frequency during stimulation and the endogenous frequency before stimulation. Unless otherwise stated, results are reported as the mean ± SD; n = number of slices or cells, and p < 0.05 for statistical significance.
Figure 3.
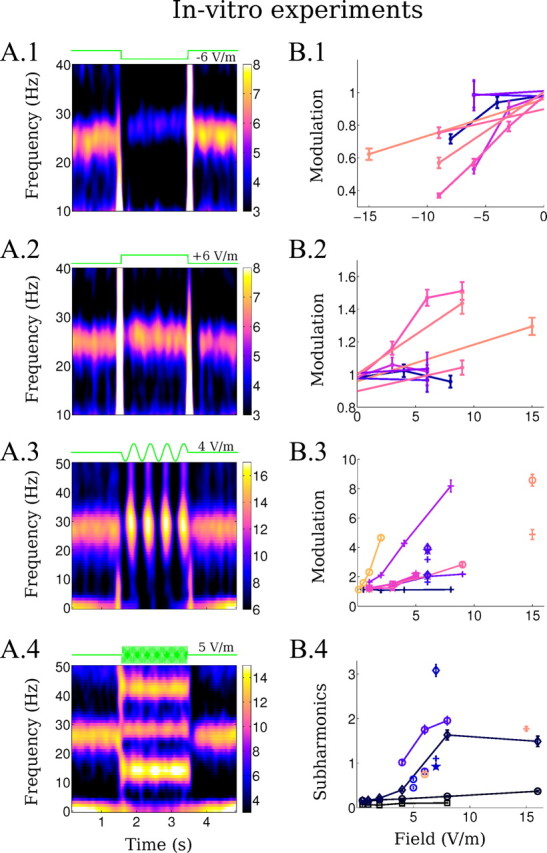
Changes in LFP oscillation during application of weak uniform fields in vitro. A, Left column, Mean spectrograms of the LFP (in dB) during the application of the uniform field with different waveforms (fields applied between 1.5 and 3.5 s). A.1, Negative DC stimulation (−6 V/m). A.2, Positive DC stimulation (+6 V/m). A.3, Low-frequency AC stimulation (2 Hz, 4 V/m). A.4, Higher frequency AC stimulation (28 Hz, 5 V/m). B, Right column, Summarizes the modulation of oscillatory power across slices. B.1, B.2, Modulation is measured relative to baseline during negative (B.1) and positive (B.2) DC stimulation. B.3, Modulation of power during low-frequency AC stimulation is measured as a ratio between enhancing and suppressing cycles (+, 2 Hz; ★, Hz; ∘, 7 Hz; □, 10 Hz; ◊, 12 Hz). B.4, Subharmonics power is measured at half the stimulation frequency relative to baseline power at the endogenous frequency (★, 20 Hz; +, 26 Hz; ∘, 28 Hz; □, 30 Hz; ◊, 40 Hz). Data from the same slice is indicated by color. Error bars indicated standard error of the mean.
Figure 4.
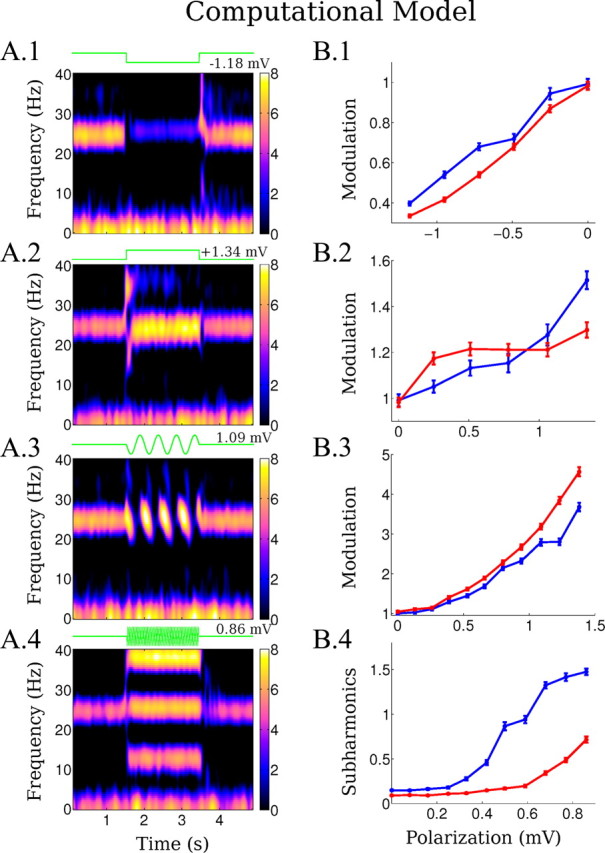
Changes in LFP during simulation of weak-field stimulation in the computational model. A, Left column, Spectrograms of the local field potential (in dB) during the application of fields with different waveforms (fields applied between 1.5 and 3.5 s). A.1, Negative DC stimulation (ΔV = −1.18 mV). A.2, Positive DC stimulation (ΔV = 1.34 mV). A.3, Low-frequency AC stimulation (2 Hz, ΔV = 1.09 mV). A.4, Higher frequency AC stimulation (25.5 Hz, ΔV = 0.86 mV). B, Right column, Summarizes the effects of the fields on the ongoing gamma activity for two different values of the e-e synaptic coupling constant w̄ee, 0.325 (blue line) and 0.275 (red line) capturing some of the variability seen in slice. The range of field magnitudes applied is the same in all cases (E ∈ [0, 12] V/m), but horizontal axis is given in terms of the resulting average cellular polarization, ΔV, to reflect frequency-dependent gain g. B.1–4, Power modulation is measured as in the slice data. Error bars indicated SEM.
Analysis of intracellular recordings.
Spike detection was performed by applying a threshold (0.4 of the maximum voltage of the action potential) on the membrane voltage after subtracting for each frame its median value. The phase ϕn of the nth spiking time relative to the applied AC field was determined directly from the recorded stimulation signal. Coherence between spike times and applied field was measured as the vector strength, , which follows a Rayleigh distribution under the null hypothesis of no entrainment, from which a p-value can be computed.
Computational model.
A network model of excitatory and inhibitory neurons was used to explain the extracellular results in brain slices. The model was then used to make predictions on spiking activity, which were tested subsequently with experimental single-cell recordings. The present model evidently does not aim to capture all known details of hippocampal neurons and their connectivity, but rather it aims to provide the simplest possible biophysical explanations for the observed data while constraining most modeling parameters based on the extracellular recordings. Therefore, we used single-compartment neurons, CA3 pyramidal and perisomatic targeting inhibitory neuron classes, and relatively local dense connectivity. The motivations for these simplified assumptions will be discussed in the next sections.
Single-cell model.
We focus on the soma as the site where polarizing fields translate into effects on firing rate and spike timing. The dendritic arbors are also known to be polarized by electric fields (Chan et al., 1988; Bikson et al., 2004); however, we have shown previously that modulation of spike timing in an individual neuron could be adequately modeled by a simple single-compartment neuron model (integrate-and-fire) (Radman et al., 2007). We similarly anticipated that changes in spike rate of individual neurons can be reproduced with single-compartment models. Importantly, using a single-compartment model we can precisely constrain the strength and time course of the membrane polarization resulting from applied fields based on data from published experimental recordings. Here, we chose the phenomenological neuron model of Izhikevich (2003, 2006) because it can reproduce a large variety of electrical behaviors of real neurons (e.g., spiking, bursting, adaptation, subthreshold oscillations) by changing only a few parameters. The differential equations describing the membrane potential V(t) can be evaluated numerically very efficiently, resulting in the following update equations for a small time step Δt as follows:
 |
with fixed parameters a = 0.04, b = 5, c = 140, and a spike threshold θ = 30. These values are chosen in Izhikevich (2003) to replicate the time course of action potential initiation (the numerical value of the dimensionless variable V should be taken to represent mV, and the unitary time step was chosen here to represent 0.77 ms). These parameters define the nonlinear dynamic of the membrane voltage in response to the driving current I(t). Notice that the dynamic changes gradually as long as the membrane voltages V(t) remains below the threshold value θ. When this value is exceeded during the action potential then the membrane voltage is reset to the membrane potential Vo. The dynamic of the membrane voltage also depends on the recovery variable U(t), which evolves according to the following:
 |
where ΔU describes the after-spike reset of the recovery variable U(t), τU is its relaxation time constant, and kU represents its sensitivity to changes in V(t) (Izhikevich, 2003). The parameters that affect recovery, namely, Vo, ΔU, τU, and kU, were chosen to approximate representative firing rates of excitatory and inhibitory neurons in hippocampus during carbachol-induced gamma oscillations (Oren et al., 2006). To reflect diversity within each population, values were chosen normally distributed about their mean as follows: for excitatory neurons (mean ± SD): τU = 43 ± 4.3; kU = 0.2 ± 0.02; Vo = −65 ± 6.5; and ΔU = 10 ± 1; and for inhibitory neurons: τU = 100 ± 0; kU = 0.25 ± 0; Vo = −65 ± 0; and ΔU = 1 ± 0. The parameters used here for inhibitory neurons correspond to fast-spiking perisomatic-targeting neurons. While different types of interneurons oscillate with the gamma cycle, perisomatic neurons synchronize tightly during carbachol-induced oscillations (Hájos et al., 2004; Oren et al., 2006), are sensitive to excitatory input from pyramidal cells (Oren et al., 2006), and directly affect somatic polarization, suggesting their participation in an excitatory/inhibitory loop. With the chosen parameters neither excitatory or inhibitory neurons fire without network input.
Model for the effect of carbachol.
In the absence of synaptic input from the network, each excitatory cell is subjected to a random zero mean, 1.5 variance Gaussian noise current IN to simulate spontaneous activity of pyramidal cells under carbachol perfusion. Additionally, a predominant effect of carbachol is to increase excitability and to depolarize the membrane potential of pyramidal cells (Fisahn et al., 2002). In the present model, excitability is determined primarily by parameter kU. Thus, the effect of carbachol application was simulated here by increasing the mean value of kU for excitatory neurons from its value of kU = 0.2 to kU = 0.24. With this, the spontaneous firing rates of excitatory neurons in isolation is 5 ± 5 Hz.
Network model.
CA3 recurrent connectivity is generally considered to be sparse (∼5% connections (Miles, 1990) but more dense locally (∼50%) (Li et al., 1994; Ishizuka et al., 1990; Wittner et al., 2006). Connectivity also differs for pyramidal and interneurons (Sik et al., 1993; Gulyás et al., 1996), and computational studies have used values between 5 and 50% (Wu et al., 1996; Mann et al., 2005; de Almeida et al., 2007). The network model considered here consisted of Ne = 800 excitatory neurons and Ni = 200 inhibitory neurons with ∼40% sparseness of the synaptic connections corresponding to a local network (Fig. 1B). Changes in sparseness from 10 to 100% and changes in the number of neurons from 100 to 2000 do not qualitatively change the behavior of the network, provided that synaptic strengths are adequately scaled. When a spike is elicited by neuron m, the synaptic input current to neuron n is given by a first-order low-pass-filtered version of presynaptic impulse s(m, t) weighted by the corresponding synaptic strength w(n, m) (Traub et al., 2000; Gerstner and Kistler, 2002; Mann et al., 2005). Summing the contribution from all neurons gives the synaptic input current to the nth neuron, as follows:
 |
with τs = 0.5 ms for excitatory neurons and τs = 6 ms for inhibitory neurons. Synaptic strengths w were chosen to be uniformly distributed (Amarasingham and Levy, 1998) for: excitatory-to-excitatory, wee ∈ [0, 0.65]; excitatory-to-inhibitory, wei ∈ [0, 2]; inhibitory-to-excitatory, wie ∈ [−1.7, −0.8]; and inhibitory-to-inhibitory, wii ∈ [−1.1, −0.3]. These choices qualitatively reproduced the physiologically observed oscillations induced by carbachol in the beta/gamma range of 25–35 Hz (Fisahn et al., 1998) and neuronal firing rates of 8.7 ± 4.8 Hz for excitatory and 21.1 ± 1.4 Hz for inhibitory neurons, compatible with Oren et al. (2006).
Model of local-field potentials.
The extracellular endogenous field is thought to result from synaptic activity and was chosen here to be proportional to the average of all the excitatory and inhibitory postsynaptic currents (Nunez, 1981). For visualization of the resulting spectrograms, 1/f noise was added to the simulated field to approximate typical background noise characteristic.
Model of effect of electric field.
Inhibitory neurons were not polarized by the field, assuming a typical symmetric morphology (Radman et al., 2009). For pyramidal cells and weak uniform electric fields, incremental steady-state membrane polarization ΔV is linear with the applied field magnitude E (Bikson et al., 2004). The transient response of the membrane can be characterized by a capacitive first-order filter (Bikson et al., 2004; Deans et al., 2007). Neuronal polarization by uniform electric fields E was therefore modeled as an equivalent low-pass intracellular current injection proportional to the applied field:
 |
where kE is the sensitivity of the membrane to the field and depends on cell geometry and field orientation. The time constant τE and sensitivity kE have been chosen here to match the experimentally observed membrane polarization of CA3 pyramidal cells in response to sinusoidal applied fields with magnitudes |E|. Specifically, by applying an equivalent current IE(t) in Equation 1, it is possible to define the incremental polarization ΔV as the deviation from the resting membrane potential of an otherwise silent neuron (i.e., without synaptic input and carbachol effects). In the present model, for small incremental polarization (ΔV < 2 mV) the effect of the applied field on the Izhikevich model is also linear with field magnitude
and the effective gain g represents the magnitude response of the total system (Fig. 1C, large box). This magnitude response gain is a function of stimulation frequency, as shown in Figure 1D, and is determined by various parameters of the model. Note that Equation 1 of the Izhikevich (2003, 2006) model already implements a low-pass response to an injected current (Fig. 1D, blue dashed line). However, the parameters of the Izhikevich (2003, 2006) model are not specifically designed to reproduce the response of the membrane to extracellular sinusoidal electrical stimulation. Equation 4 is introduced here to achieve a better match with experimentally observed magnitude response obtained here for τE = 10 ms and kE = 0.1 m/V (compare Fig. 1D, red solid line, with Fig. 1C in Deans et al., 2007). Since the effective strength of the applied field depends on stimulation frequency, we have chosen to report relevant results as a function of effective polarization magnitude ΔV of a neuron in isolation. This should provide an intuition as to the effective strength of the field on a single-cell level. For instance, in Figure 4B the different polarization ranges shown all correspond to the same range of field magnitudes, namely E ∈ [0 V/m, 12 V/m]. In summary, the total input current (I in Eq. 1) to the nth neuron is given by the following:
 |
where, as defined before, IN is a zero-mean Gaussian white noise current.
Analysis of network dynamics and excitatory–inhibitory balance.
To characterize the dynamic of excitation and inhibition on a moment-by-moment basis, we define an estimate of the mean excitatory and inhibitory synaptic currents as follows:
 |
 |
where Ne*(t) and Ni*(t) are the numbers of excitatory and inhibitory neurons firing in a time bin of duration Δt at time t and w̄xx (x = e, i) represents the mean synaptic strength between excitatory and inhibitory neurons, as defined above. The fractions in Equations 7 and 8 represent the average synaptic current strength in the network; once multiplied with the corresponding number of active excitatory and inhibitory neurons, one obtains an estimate of the total synaptic drive in the network. With this, one can also define the accumulated excitatory and inhibitory drive, or total synaptic charge, during time interval T as follows:
 |
The integral extends either over the baseline interval Tb = {t|0.0s ≤ t ≤ 1.5s} or stimulus interval Ts = {t|1.5s ≤ t ≤ 3.0s}. We use this measure to determine the balance of excitation and inhibition over time. More specifically, we are interested in the changes of excitation or inhibition as result of stimulation and report thus the ratios Qe′ = Qe(Ts)/Qe(Tb), Qi′ = Qi(Ts)/Qi(Tb). Reporting the relative change has the added advantage of making the results independent of the basal values of excitation and inhibition, which may vary with specific network parameter settings.
Results
The overall goal of this study was to explain the effects of weak applied electric fields on ongoing endogenous network activity. Our approach was to systematically characterize the effects of well controlled (uniform) applied DC and sinusoidal AC fields on pharmacologically induced oscillations in brain slices. Several distinct frequency-dependent responses were observed in the extracellular field and quantified as a function of field strength. The different types of responses provided strict limits for a parsimonious computational network model, which aimed to explain the cellular and network mechanisms underlying susceptibility to weak fields. The predictions of the model for the underlying cellular mechanisms were tested using intracellular recordings. The model was then used to analyze the behavior of the network by systematically changing the amplitude and frequency of the stimulation. An inclusive mechanistic framework is presented in the Discussion section.
In vitro extracellular recordings
Consistent with previous studies (Williams and Kauer, 1997; Hájos et al., 2004; Oren et al., 2006), carbachol (20 μm) induced oscillatory activity in the local field potentials measured in the CA3 region of the hippocampus with frequencies in the range of 25–35 Hz (29 ± 3 Hz) and a bandwidth of 5–10 Hz (7–10 dB above background) (Fig. 2A). In most slices, the activity was persistent and stable in power and frequency for over 2 h. This permitted testing of a range of stimulation protocols from DC to 40 Hz sinusoidal AC. Within this range of frequencies, three qualitatively distinct dynamics were observed:
Figure 2.
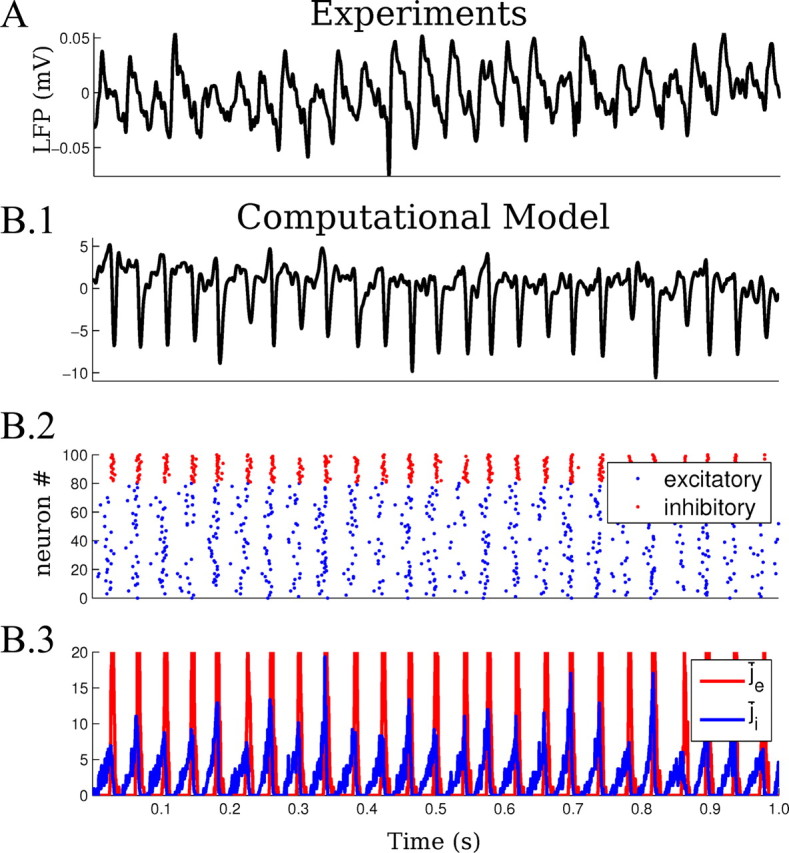
Gamma oscillations generated by carbachol application in vitro and in the computational network model. A, The 20 μM carbachol induces beta–gamma oscillations in rat brain slices, measurable as oscillatory activity of the LFP (25–35 Hz, low passed at 100 Hz). The activity is stable in power and frequency. B.1, Simulated LFP in the computational network model (low passed at 100 Hz). The LFP in the model is the average of the postsynaptic currents across the network. B.2, Raster plot representing the firing activity of excitatory (blue) and inhibitory (red) neurons during induced oscillations in the computational network model (sample of 80 excitatory and 20 inhibitory shown). B.3, Average excitatory and inhibitory currents (j̄e and j̄i) during the simulated oscillations.
DC stimulation modulates extracellular field oscillation
Positive and negative uniform DC electric fields were applied for a duration of 2 s at various intensities (|E| < 10 V/m). Positive fields (anode on the CA1 alveus side) will typically depolarize the soma of CA3 pyramidal cells, while negative fields (cathode on the CA1 alveus side) will be typically hyperpolarizing (Deans et al., 2007). Negative fields decreased the steady-state power of gamma oscillations measured during stimulation (Fig. 3A.1), while positive fields increased steady-state gamma power (Fig. 3A.2). The strength of the modulation indicates that the sensitivity of oscillation to the applied fields differs across slices (Fig. 3B.1,B.2). This is not unexpected given the importance of cell morphology relative to applied fields in determining cellular coupling strength (Chan et al., 1988; Radman et al., 2009) and inevitable anatomical variation across slice sections (including CA3 curvature relative to the applied field). However, although subthreshold cellular polarization is largely symmetric (Bikson et al., 2004), in the majority of the slices (n = 8 slices) we observed an asymmetry in the strength of steady-state modulation of oscillations as reflected in the normalized power ratio (Fig. 3B.1,B.2), whereby hyperpolarizing fields had a stronger effect than depolarizing fields. Frequency of oscillation was modified in some cases, but no clear relationship with stimulation amplitude or polarity was identified. When analyzing steady-state power ratio, the initial 1 s was excluded since the onset and offset of the DC field stimulation induced transient responses (Fig. 3A.1,A.2). In particular, positive transients generated population spikes, while negative transients induced suppression of the endogenous oscillations for about 200 ms. Notably, following the termination of DC stimulation (when the applied field intensity is evidently zero), population spikes were observed after negative fields and suppression was observed after positive fields; the duration of these poststimulation effects exceeded the expected cellular (field) recovery time constant (∼20 ms). In summary, steady-state network dynamics are on average more susceptible to negative fields than positive fields, while robust enhancement and depression may be observed on short-time scales (<200 ms) depending on the direction of change.
Low-frequency AC stimulation (≤12 Hz) results in bidirectional modulation of ongoing oscillation
Stimulation with AC at frequencies ≤12 Hz applied for 2 s induced modulation of ongoing gamma activity with the frequency of the applied stimulation (Fig. 3A.3). Figure 3B.3 summarizes the strength of the modulation across the slices tested (n = 9). The strength of modulation by AC fields increased with increasing field magnitudes, and the sensitivity of the slices captured by the slopes in Figure 3B.3 differed from slice to slice. Importantly, the modulation in power with low-frequency AC is significantly larger than that for DC stimulation [Fig. 3, compare B.1,B.2 (vertical axis), B.3]. Indeed, the most sensitive slice responded to fields as low as 0.5 V/m for stimulation with 7 Hz. Moreover, enhancement and suppression under low-frequency AC fields was more symmetric than in the case of DC stimulation; thus, modulation by low-frequency AC could not simply be explained by alternating DC effect, with the enhanced strength of modulation reflecting a network dynamic, which is elucidated in the next section. As with the DC fields, the frequency of endogenous oscillation varied during stimulation, but no reliable trend with stimulation frequency or amplitude could be established.
AC stimulation close to the endogenous frequency (20–40 Hz) induces half-harmonic oscillations
Stimulation at frequencies of 20–40 Hz with amplitudes lower than ∼4 V/m did not induce any apparent change in the oscillation power or frequency of the endogenous oscillations (but see analysis of intracellular recordings below). Stronger stimulation (≥4 V/m) induced oscillations at half the frequency of the stimulating AC fields (subharmonic) concurrent with a reduction in power of the endogenous frequency (Fig. 3A.4). Because of on-frequency stimulation artifacts, this latter effect could only be resolved in the signal when stimulating at some distance from the endogenous frequency. In the raw traces, the half-harmonic oscillation manifests as population spikes that are in phase with every other positive applied field cycle. The power of this subharmonic oscillation increased with the strength of the applied AC field (Fig. 3B.4) (n = 10 slices). Some slices were less sensitive to subharmonics generation, as quantified by power ratio.
In silico network model
To explain these various phenomena, a computational model using single-compartment excitatory and inhibitory neurons was built (see Materials and Methods). The susceptibility of pyramidal cell somas to weak uniform fields has previously been determined and was directly incorporated as voltage polarization of single-compartment neurons (Bikson et al., 2004; Deans et al., 2007; Radman et al., 2007, 2009). Moreover, the variety of phenomena and their dependence on field intensity described in the previous sections provided strong constraints for the model. As illustrated in the next sections, this parsimonious model was able to reproduce and explain the range of phenomena under fixed parameter settings. To account for interslice variability, various network parameters could be independently adjusted. Instead, with the goal of using a single set of model parameters to globally explain the observed phenomena, we identified a single parameter, namely excitatory-excitatory (e-e) synaptic strength wee, whose variation could explain and reconcile all interslice variability. Endogenous local field potential oscillations were simulated as the postsynaptic currents averaged over the population of excitatory and inhibitory neurons. This simulated extracellular activity reproduced qualitatively the local field potential oscillations observed in slice with frequencies in the range of 25–26 Hz (Fig. 2B.1,B.2, raster plot). The average firing rate of excitatory neurons in the model was 8.7 ± 4.8 Hz for excitatory and 21.1 ± 1.4 Hz for inhibitory neurons. Thus, most inhibitory neurons fire in every cycle of the oscillation, while excitatory neurons fire on average every third beat. The time delay between the peak of firing of excitatory and inhibitory neurons is 2.5 ± 0.7 ms. These features are all compatible with previous reports on pyramidal and perisomatic-targeting interneurons during carbachol-induced gamma oscillations (Hájos et al., 2004; Oren et al., 2006). The time course of excitation and inhibition during the oscillations is shown in Figure 2B.3. In this section on the network model, various observations will be made on the effects of fields on firing rates and spike times to explain underlying mechanisms. These observations represent de novo predictions of the computational model established before any intracellular recordings. Thus, the subsequent experimental testing of these predictions provides validation and foundation for then applying this model to analyze the underlying dynamics of weak field modulation.
DC stimulation—steady-state rate modulation
The computational model was able to reproduce changes in oscillatory power under DC stimulation as observed in vitro (Fig. 4A.1,A.2,B.1,B.2). The power ratio of modulation increased with field intensity. For the computational model, we report the stimulation intensity in terms of incremental polarization for an isolated neuron. Several observations follow from comparing the sensitivity (slope) of the network model and slices to DC fields (compare Figs. 4B.1,B.2, 3B.1,B.2). First, the power modulation of the most sensitive slices is reproduced by an effective cellular coupling constant of 0.2 mV polarization per V/m field; this value is precisely in line with experimental quantification of coupling constants. Thus, for DC modulation (and indeed as we show below for AC fields) experimentally determined cellular coupling constants are sufficient to account for gamma oscillation sensitivity to weak electric fields. Second, weak fields, which in combination with small coupling constant results in sub-millivolt polarization, nonetheless exert a profound effect on coherent network activity; we go on to address the network source of this amplification. Third, interslice variability in sensitivity (slope of the power ratio) is readily explained by variation in anatomy and alignment changing average coupling constants. The same principle can also explain diversity in slice AC sensitivity. However, variation in cellular coupling constants cannot explain diversity across slices in asymmetric sensitivity to positive and negative fields. Rather, the higher sensitivity to negative (soma hyperpolarizing) versus positive (soma depolarizing) DC fields observed in some slices is explained by the network model as being a result of an increasing inhibitory input that grows faster than excitatory input with increasing excitatory rate. Thus, an increase of excitation due to the field is “kept in check” by an increase of feedback inhibition to reach a point of balanced excitation and inhibition (Fig. 5A; each point indicates a steady state of the dynamic balance). As a result, the excitatory-inhibitory (e-i) loop acts to limit the overall firing rate of the network. The firing rates at which this balance is attained depends on field strength and a number of network parameters. The dependence in e-e coupling strength in particular leads to a nonlinear dependence of this balance point on field strength (Fig. 5A). When the e-e coupling is reduced (w̄ee = 0.325→0.275) (Fig. 4, blue and red curves), the inhibitory rate required to achieve excitation–inhibition balance is reduced (Fig. 5A, red points lower than the blue points). Therefore, depolarization-induced excitation is balanced by a lesser inhibitory drive, and thus gamma oscillations are less affected by the stimulation than in the case of higher w̄ee (Fig. 4B.2). Notably, the same e-e coupling parameter can singularly account for differential sensitivity to modulation by low-frequency field and also subharmonic generation, as shown below.
Figure 5.

Analysis of the computational model results. A, Integrated synaptic drive Qe′ and Qi′ (total charge delivered relative to baseline) during DC stimulation at various field intensities. Each point indicates data from repeated runs of the model averaged >30 frames (blue for w̄ee = 0.325 and red for w̄ee = 0.275). Clusters reflect results for 11 field intensities tested indicating that the network converges to the same stable balance point. B, The instantaneous synaptic network drive in the computational model is represented as a point in the (j̄i, j̄e) space. The trajectory of the points represents the instantaneous level of excitation/inhibition (following a 5 point moving average) before (black line) and during field application (green line). The stimulation amplitudes applied are the same as in the spectrograms in Figure 4A and in the raster plots in Figure 6A. B.1, B.2, Hyperpolarizing and depolarizing DC stimulation; B.3, 2 Hz stimulation; B.4, 25.5 Hz stimulation. C, Frozen-input condition for different waveforms applied in the computational model. Firing rate change during the application of the field under normal conditions (red line) and frozen-input conditions (blue line) as a function of the average single-neuron polarization ΔV. C.1, DC stimulation. C.2, 2 Hz AC stimulation. C.3, 25.5 Hz AC stimulation. Error bars indicate SD.
DC stimulation—rate-change amplification is a network effect
The model shows that the modulation of the extracellular oscillations is concurrent with a significant increase and decrease in firing rates (Fig. 6A.1,A.2, raster plot). These changes in firing rate modulate overall synaptic activity and thus underlie the modulation of extracellular field oscillations. To demonstrate that the strong rate modulation is the result of amplification through network dynamics and not just the response of individual neurons to the incremental polarization (as would be expected for isolated neurons), we stimulated the model neurons under a “frozen-input” condition. In this condition, the synaptic current drive to a neuron is recorded during endogenous rhythms without stimulation and then played back identically as driving current to an individual isolated neuron. When applying extracellular field stimulation to this frozen-input condition, the firing rate changed by a smaller amount and symmetrically for hyperpolarizing and depolarizing stimulation (Fig. 5C.1). We find that field strengths that have only a small and linear effect on firing rate for isolated neurons are amplified by the network dynamics by ∼70%.
Figure 6.
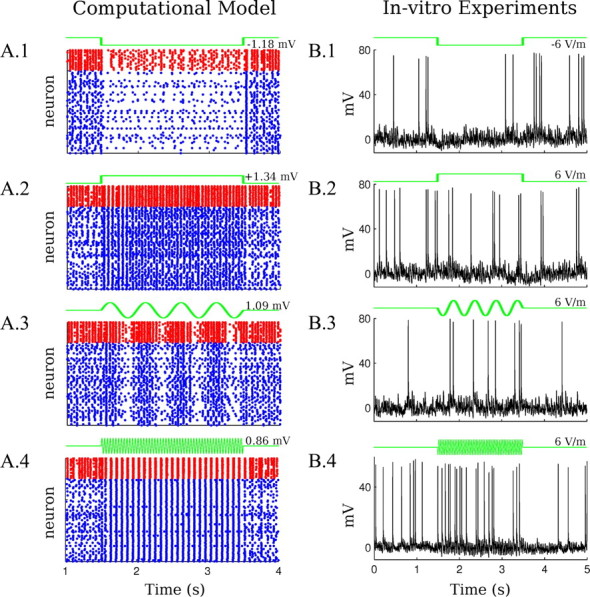
Model predictions for spiking activity and validation with intracellular recordings. A, Raster plots on the left column indicate spiking activity for a sample of model neurons during electrical stimulation (blue for excitatory and red for inhibitory). The frequencies and amplitudes of the applied fields are the same as in Figure 4A. A.1, Negative DC stimulation. A.2, Positive DC stimulation. A.3, Low-frequency AC stimulation (2 Hz). A.4, Higher frequency AC stimulation (25.5 Hz). B, Right column, Illustrative intracellular recordings in slices during electrical stimulation (6 V/m). B.1, Negative DC stimulation. B.2, Positive DC stimulation. B.3, Low-frequency AC stimulation (2 Hz). A.4: Higher frequency AC stimulation (26 Hz). Quantitative comparison between the model and the intracellular recordings requires aggregating data over multiple frames (see Fig. 7).
Low-frequency AC stimulation—symmetric power modulation with a net-zero change in firing rate
For AC stimulation below half of the frequency of the endogenous activity, the model reproduced a modulation in gamma power comparable to the in vitro data (Fig. 4A.3,B.3). In contrast to DC stimulation, low-frequency AC modulation is more symmetric with periods of suppression followed by equally strong enhancement. As with DC stimulation, the changes in gamma power under low-frequency AC stimulation reflect changes in firing rate within the stimulation cycle (Fig. 6A.3). Note that not all excitatory neurons fire in every gamma cycle and the attainable population rate scales with the number of available neurons. Consistent with this argument, a specific and telling prediction of the model is that across cycles there is no net change in population firing rate (Figs. 5C.2, 6A.3); excitatory cells that have not fired during suppressive cycles become available to fire in the next enhancing half-cycle leading to above-baseline gamma activity. Thus, the rate-limiting characteristic of the e-i loop that was observed in the DC case also governs enhancement and suppression in the low-frequency AC case, resulting in unaltered average firing rates. The positive and negative transients at the onset and offset of DC stimulation follow a similar pattern.
Higher frequency AC stimulation—pacing increases timing precision resulting in half-harmonics
Simulation of sinusoidal stimulation with frequencies in the range of 20–40 Hz reproduces subharmonics as observed in vitro (Fig. 4A.4,B.4). Subharmonic intensity increased with stimulation intensity (compare Figs. 3B.4, 4B.4); as in the slice experiment, relatively high polarizations are needed to induce subharmonics. The model predicted increased synchrony of excitatory neurons during subharmonic generation (Fig. 6A.4). This increased precision results from pacing (i.e., slightly advanced/delayed firing depending of the time of firing relative to the applied field). Indeed, the theory and experimental validation of this timing effect has been presented previously for isolated neurons (Radman et al., 2007). But here, in a coupled network, the increased precision of the network results in a stronger, and hence prolonged, inhibitory volley, which then inhibits neurons from firing in the next cycle; thus, excitatory neurons “skip a beat,” which is then reflected in the half-harmonic extracellular oscillations. The frozen-input condition confirms that the effect is a network phenomenon, since the firing rate does not change significantly without the network connections (Fig. 5C.3). As before, the diversity of sensitivity across slices can be reproduced by changing the e-e synaptic strength, w̄ee = 0.325→0.275 (Fig. 4B.4, red line), with decreasing sensitivity for decreased e-e coupling. It is notable that in the model enhanced asymmetry under DC fields coincides with reduced sensitivity to subharmonics, consistent with a pivotal role for this network parameter in determining sensitivity to a range of field waveforms. In the slice as well as the model, modulation is a stable phenomenon that can always be observed as soon as gamma activity is apparent. However, asymmetric DC modulation and half-harmonics do not always occur (Fig. 3B) with the same strength.
Higher frequency AC stimulation–phase-entrainment resonance
Faster stimulation at intensities <5 V/m did not significantly affect the power of the endogenous oscillations, as observed in the local field potential (LFP). We reasoned, however, that smaller fields should nonetheless have an effect, albeit small, on spike timing. If stimulation occurred at the frequency of the endogenous oscillation, then the timing effects may accumulate over multiple cycles. Thus, spike timing could align over multiple cycles with a constant phase relative to the applied field (Radman et al., 2007). Indeed, Figure 7B.1,B.2 shows that in the model a polarization of 0.02 mV, corresponding to applied fields of ∼0.2 V/m, results in a coherent firing in phase with the applied stimulation. However, strong coherence is only observed when the frequency of the stimulation matches the endogenous gamma oscillation. The model also shows entrainment at the approximate firing rate of excitatory neurons (approximately one third of the network oscillation) (Fig. 7B.1, second peak at lower frequency). Thus, weak fields entrain firing at all endogenous frequencies of the network.
Figure 7.
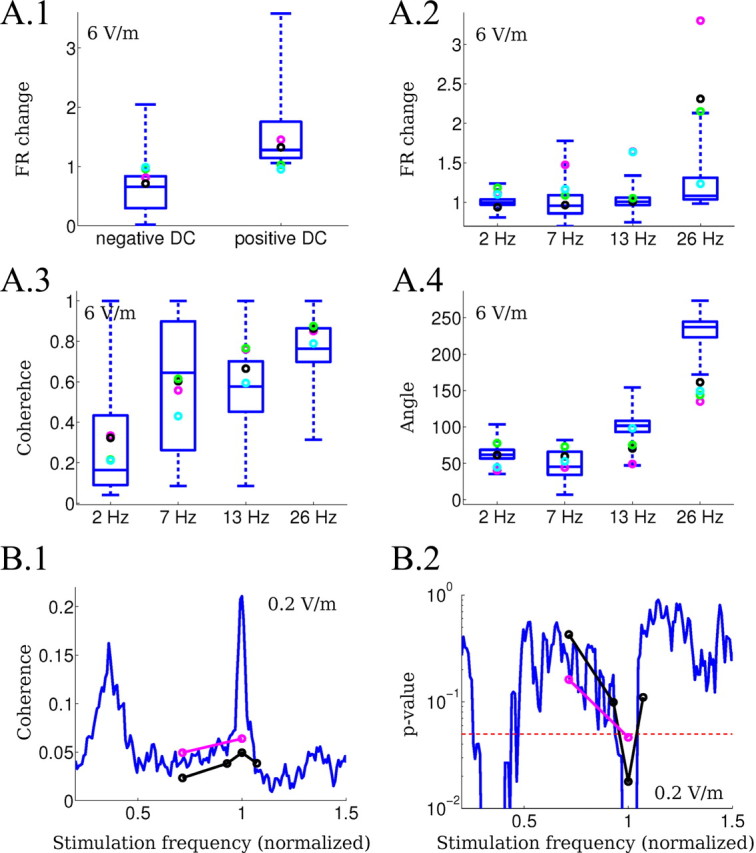
Quantitative comparison of the intracellular recordings with the computational model predictions. A, The experimental data (circles) are compared with the results of the model (blue box indicating median and 75th percentile, outliers not plotted). DC and 2, 7, 13, and 26 Hz were tested using 6 V/m fields corresponding in the computational model to ΔV = 0.5 mV for the DC case. A.1, Firing rate change (relative to baseline) during the application of positive and negative DC stimulation. A.2, Firing rate change (relative to baseline) during the application of AC stimulation. A.3, Coherence between the spikes and the applied AC fields. A.4, Mean angle between the spikes and the applied AC fields. B, Phase-entrainment resonance induced for very low-amplitude fields (0.2 V/m) in the experiments (circles) and the model (solid blue line). B.1, Coherence measured as vector strength of the phase of spike time relative to the applied oscillating field. Frequencies of the applied field are normalized to the endogenous frequency to facilitate comparison. B.2, The p-value for coherence measures (p = 0.05, dotted line).
Detailed analysis of the excitatory–inhibitory dynamic
We have argued for a rate-limiting property of the e-i loop with firing rates set by a balance of excitatory and inhibitory drive. This argument is based on average firing rate and ignores the rapid fluctuations of excitation and inhibition during the gamma cycle (Fig. 2B.3). Within each cycle, an excitatory volley is immediately followed by an inhibitory volley. The instantaneous synaptic network drive in the computational model is represented as a point in the (j̄i, j̄e) space. The trajectory of the points represents the instantaneous level of excitation/inhibition (Fig. 5B). The phase plane shows that the limit cycle shrinks during the application of hyperpolarizing DC field (Fig. 5B.1) and slightly enlarges during depolarizing DC fields (Fig. 5B.2). The dynamics of the network during the application of a slow AC field is represented by a transient shrinking and enlargement of the limit cycle (Fig. 5B.3). A qualitatively different dynamic, however, emerges for the case of fast AC stimulation (Fig. 5B.4).
Testing predictions of the computational model with in vitro intracellular recordings
Under a single-parameter set, our parsimonious computational model reproduced a diversity of experimental observations while providing a number of mechanistic explanations—specific predictions about the underlying changes in firing rate and spike timing including the following: (1) DC electrical stimulation affects the firing rate; (2) low-frequency AC stimulation modulates the firing rate on a short time scale without changing the long-term average; (3) AC stimulation at frequencies close to the endogenous frequency strongly affects spike timing; and (4) very low-amplitude electric fields at levels that do not induce manifest extracellular changes can nevertheless affect the network dynamics through a network resonance mechanism, which should be detectable as a coherence of spikes times with the field applied.
We next quantitatively tested these predictions using intracellular recordings (Fig. 6B, illustrative examples of the different waveforms applied) and compared the following measures between the model and the slice: (1) change in firing rate during DC stimulation; (2) change in firing rate during AC stimulation; (3) coherence of spikes with the field applied; (4) mean angle between spikes and field applied; and (5) coherence of spikes with very low-amplitudes electric fields (0.2 V/m). Figure 7A compares the first four measures for excitatory model neurons (median and range shown as box-and-whiskers plot) and the experiment (circles indicate pyramidal neurons).
Unless otherwise noted, in this section we compared 6 V/m stimulation using DC, 2 Hz (very low frequency), 7 Hz (resonance of polarization plot), 13 Hz, and 26 Hz. Only slices with an endogenous 26 Hz oscillation were selected to facilitate comparison across slices (n = 4 neurons from 3 slices). Stimulation intensity in the model was matched to the expected frequency-dependent polarization: 6 V/m corresponds to ΔV of 0.50 mV for DC, 0.53 mV at 2 Hz, 0.56 mV at 7 Hz, 0.50 mV at 13 Hz, and 0.39 mV at 26 Hz (see Materials and Methods).
Rate modulation
As predicted by the model, we measured an increase/decrease in the firing rate when applying depolarizing/hyperpolarizing fields (Fig. 7A.1). In the model and in the experiments, the change in the firing rate appeared to be symmetric with applied field polarity. Note that the firing rate can be made to match the experimental observation exactly by slightly adjusting the coupling constant. However, we have not done that as the purpose of this exercise was to test model predictions (i.e., all parameters were kept constant from the values that had been determined based on the effects observed in the extracellular oscillations).
Balanced modulation for slow AC fields and change in rate for fast AC fields
A notable intracellular correlate, predicted by the model, is that the average (i.e., net) firing rate of excitatory/pyramidal cells is unaltered during slow AC stimulation compared with baseline. Consistent with this observation, there was no significant change in average cellular firing rate for 2 Hz stimulation (Fig. 7A.2), even during significant field power and transient firing rate changes; this phenomenon is not necessarily expected and results from a specific network dynamic (see Discussion).
Pacing resulting in phase alignment
A further prediction is that in a paced network, firing times will coherently align to the applied field. The model accurately predicted frequency-dependent increases in coherence (Fig. 7A.3) as well as a frequency-specific preferred phase reflecting a precise alignment of spiking to the applied field cycle (Fig. 7A.4). The range of angles matches the theory established in Radman et al., (2007) (predicted to be between 40° and 130°). One technical exception is the frequency at which half-harmonics are obtained (26 Hz stimulation) where the dynamic of the network is drastically altered (as shown in Fig. 5B.4). Here, the mean angle is no longer an appropriate measure as the predominant cycle duration does match the cycle from which the angle is computed. The firing rate change for AC stimulation also shows a higher sensitivity to 26 Hz stimulation (Fig. 7A.2) even if the changes in the model are not as large as in the experiments, presumably because of the different baseline firing rate.
Entrainment down to 0.2 V/m
The model prediction on resonance at very weak fields (Fig. 7B.1, coherence peak, blue line) was tested on two slices (open circles). We indeed measured a significant coherence (p < 0.05) (Fig. 7B.2) of spike times with applied electric fields when stimulating at the endogenous oscillation frequency (normalized frequency = 1), but not at other frequencies (≠1). With 0.2 V/m, the field magnitude was significantly below the minimum required to observe effects on oscillations in the extracellular recordings. The peak of resonance at the endogenous frequency corresponds to an average single-neuron polarization of <20 μV.
Deviations of the experiment from the model
Firing in model neurons is more regular than in real neurons, and firing rates were generally lower in intracellular recordings during nonstimulation periods (three of four cells). Moreover, the model shows enhanced pacing at 7 Hz that was not fully replicated experimentally (Fig. 7B.1), presumably reflecting the peak in the polarization of model neurons around that frequency (Fig. 1D). Note that slices did demonstrate the strongest sensitivity to field modulations for stimulation at 7 Hz (see discussion in the next section). The deviation of the model predictions from the experimental results are comparatively small and could probably be corrected by carefully adjusting network parameters. However, our goal was not to perform curve fitting, but rather to obtain an unbiased test of the mechanistic explanations provided by the model.
Model results for multiple frequency and field intensities
In summary, a simple computational model, parametrized by phenomena observed in extracellular field oscillations, correctly predicted all qualitative effects on firing rate and spike timing for a diversity of dynamic effects. Indeed, with a few exceptions, the predictions were accurate enough to match quantitative measures of spike time coherence and angle as well as spiking rate changes. We can thus apply the model with some confidence to exhaustively test all frequencies and amplitudes, sweeping within the range of values that have been validated by experiment. This may provide answers to remaining open questions, for example: (1) can endogenous oscillation frequency be modified? (2) Do the distinct phenomena observed here constitute a continuum or are there sharp transitions in the dynamics? A further advantage of the computational model is that extracellular oscillations can be measured without concern for on-frequency stimulus artifacts and that all spiking activity is readily available. Thus, we can sweep across all frequencies and measure (1) the main frequency and power during the stimulation, (2) coherence between the spikes of single neurons and the field applied, and (3) firing rate change of excitatory neurons (Fig. 8).
Figure 8.
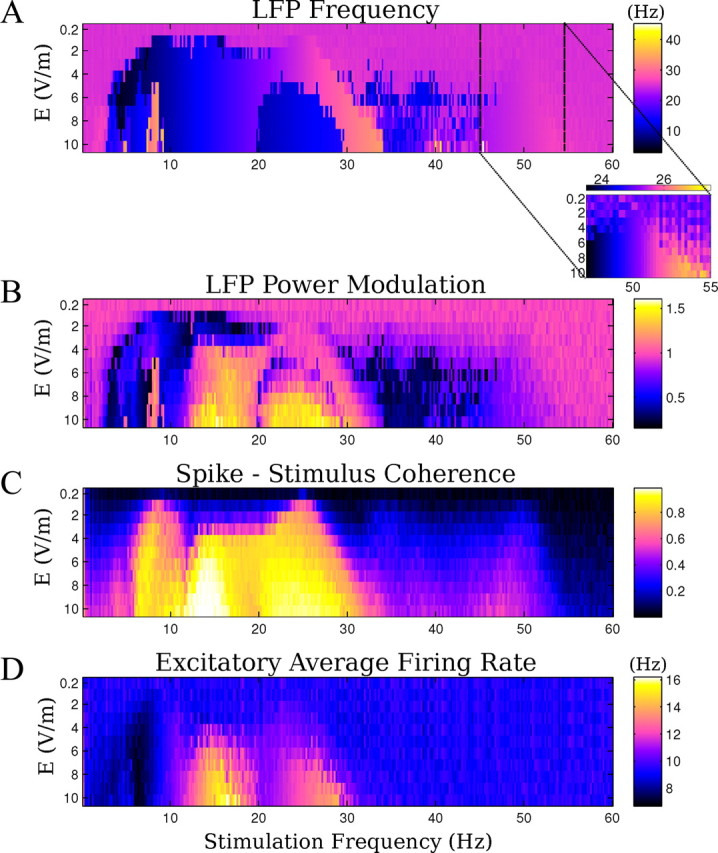
Model results for multiple frequencies and field intensities. A, Main frequency of the endogenous activity during the field application. Inset, Main frequency of the oscillations applying frequencies close to double the endogenous. B, Relative power change at the main frequency of the oscillations before and during the stimulation. C, Mean coherence between spike times and applied fields. D, Average firing rate of pyramidal neurons during the field application.
The computational model indicates that the frequency and power of the endogenous oscillations can be changed as a function of applied frequency and amplitude (Fig. 8A,B). The change is more effective if the stimulation is close to rational frequencies of the endogenous frequency (in this case, 13, 26, and 52 Hz). A similar pattern is reflected in the firing rate change in Figure 8D, as could be expected given that extracellular fields are directly linked to total synaptic activity. The transition to the subharmonics regime is an all-or-none transition (i.e., the network either skips a beat or it does not). At the boundary of this transition (in terms of stimulation amplitude and frequency), one observes on a short time scale either one or the other state, but never both. The entrainment for very low-amplitude fields broadens with increasing field amplitudes (Fig. 8C). The sharp selectivity for best-frequency (i.e., resonance) is only expected at the lowest field intensities. The model also suggests that strong spike-field coherence occurs for stimulation at rational fractions of the frequency of the oscillations (at 13 and 7 Hz), which are preferred frequencies of the system with reliable phase relationships of spiking to applied fields (Fig. 8C).
Two data points in Figure 8A are worth highlighting. (1) When applying fields at frequencies at approximately double the endogenous frequency, the oscillation entrains and the endogenous frequency shifts (Fig. 8A, inset), in agreement with previous results for kainate-induced gamma oscillations (Deans et al., 2007). This entrainment phenomenon is distinct from the altered dynamic leading to half-harmonic network oscillation (Fig. 5B.4). (2) Stimulation at frequencies and amplitudes that are comparable to endogenous theta activity (7 Hz, 1 V/m) can significantly modulate endogenous gamma activity (Fig. 3B.3, circles) (n = 3 slices). The experimentally observed LFP spectrograms are well reproduced by the computational model (Fig. 9, compare A.1, A.2), and stimulation with waveforms approximating endogenous hippocampal theta (sharp depolarizing ramp and slower hyperpolarizing ramp) produces comparable modulatory effects (Fig. 9B.1). The excitatory spike times in the model are broadly distributed across the theta cycle with a maximum at the peak of the depolarizing phase of the theta field (Fig. 9B.2) resembling in vivo recordings of theta-modulated gamma activity (Bragin et al., 1995; Buzsáki, 2002).
Figure 9.

Modulation of gamma power when applying a waveform approximating endogenous hippocampal theta oscillations. A.1, B.1, Spectrograms (in dB) of the effects of 7 Hz, 1 V/m AC fields on the oscillations in the experiments and the model (IE = kEE = 0.067). B.1, Spectrogram of the LFP (in dB) during the application of a theta field in the model. B.2, Phase distribution of spikes relative to the field applied as in B.1 for all excitatory neurons in the simulated network.
Discussion
Decades of experience with experimental and clinical studies indicate that low-intensity electrical currents may acutely modulate network dynamics (Creutzfeldt et al., 1962; Gartside, 1968; Jefferys, 1981; Nitsche and Paulus, 2000; Durand and Bikson, 2001; Gluckman et al., 2001; Boggio et al., 2007), but a comprehensive framework for explaining neuromodulation is lacking. Such a framework should quantitatively reconcile how incremental (“negligible”) effects of weak currents on isolated neuron membrane potential (Bikson et al., 2004; Deans et al., 2007; Radman et al., 2009) lead to significant changes in network dynamics through nonlinear amplification mechanisms at the cellular (e.g., timing,) and/or network levels (Parra and Bikson, 2004). An inclusive framework, covering all relevant intensities and frequencies, is necessary to make predictions to improve clinical therapies using low-intensity stimulation, such as transcranial electrical stimulation.
Thus, the questions we aimed to address included the following: (1) will small timing effects at the single-neuron level (Radman et al., 2007) accumulate to large effect on a network level or, conversely, will they be neutralized by a robust network dynamic? (2) Are empirical observations with specific waveforms discrete and unrelated phenomena, or is there a continuum of effects using a range of amplitudes and frequencies? (3) Are there preferred or resonant frequencies for network-level modulation? (4) What attributes of the network are pivotal in determining susceptibility to electric fields? And (5) do changes in network dynamic, in turn, alter single-cell firing statistics? That is, is the sensitivity of the cell functionally increased by virtue of being part of an active network?
To methodically address these questions, we swept stimulation frequency and amplitude in a tractable brain slice system. A parsimonious network model was precisely constrained at the cellular level in terms of coupling strength and time constant (Fig. 1) and constrained at the network level in terms of field power modulations (Fig. 4). Explicit model predictions on underlying effects on spiking activity were then tested by intracellular recording. The mechanisms can be grouped as effects on firing rate and changes in spike timing as follows.
Rate effect: power modulation by DC and slow AC fields result from a rate-limiting dynamic with balanced excitation/inhibition
Weak DC currents induced a marked change in gamma oscillations and corresponding changes in neuronal firing rate. Changes in cortical neuron firing rate under polarizing currents are well established; but here we show that neurons are more susceptible by virtue of involvement in active networks (e.g., compare with frozen-input condition in the model). The e-e loop is the primary source of this magnification: incremental polarization by weak currents leads directly to a small increase in firing rate, providing increased excitatory input, which results in further “amplified” increases of excitatory firing rate. The same positive feedback loop also magnifies the reduction in firing rate resulting for hyperpolarizing field stimulation.
The network dynamic balance changes in excitatory activity by a complimentary change in inhibitory activity (Fig. 5A), preventing runaway excitation. This dynamic balance dictates the resulting firing rates and field oscillations, which depend therefore on the network architecture and electric field strength (Fig. 5C.1). For example, decreasing e-e coupling produces asymmetric modulation of oscillations when applying DC fields of different polarity (Fig. 4B.1,B.2), whereas symmetric changes in firing rate are expected for isolated neurons.
More specifically, we argue for a rate-limiting property of the excitatory-inhibitory loop governing susceptibility to weak currents, in particular gamma-power amplitude modulation by low-frequency AC currents: excitatory cells that have not fired during a suppressive half-cycle of AC field stimulation become available to fire in the next enhancing half-cycle, transiently achieving higher firing rates. Thus, slow AC field stimulation for fields as low as 0.5 V/m results in strong modulation with no net change in average firing rate (Fig. 7A.2). The enhancing/suppressing effect of slow AC stimulation is symmetric and depends largely on the direction of field change rather than field polarity (Fig. 4B.3). Similarly, the transients observed at the initiation and termination of DC fields (Fig. 3A.1,A.2) reflect, in part, the dynamic of the rate-limiting system.
Timing effect: phase entrainment, resonance, and half-harmonic pacing for higher frequency applied AC fields result from spike time alignment and increased precision
Small polarization, when appropriately timed, can advance or delay the precise time of firing of a neuron (Radman et al., 2007). By acting simultaneously on many pyramidal neurons in an oscillating network, population frequency and phase entrainment can result (Francis et al., 2003; Parra and Bikson, 2004). (1) When the amplitude of stimulation is sufficient to affect the timing within an individual cycle, then the network adjusts to match the stimulation frequency, or its subharmonics—as the maximum frequency of oscillation is limited by the recovery kinetics of the inhibitory volley (Deans et al., 2007). We emphasize that the resulting pacing results from incremental timing shifts induced by weak AC currents, in contrast to pacing by suprathreshold stimulation, which triggers action potentials. (2) For still weaker stimulation (as low as 0.2 V/m), phase entrainment can occur only if stimulation frequency is precisely matched to the endogenous rhythm so that even small time shifts can accumulate over multiple cycles, resulting in phase-entrainment resonance (Fig. 7B.1). Indeed, experimental (Jefferys, 1981; Chan et al., 1988; Bikson et al., 2004; Radman et al., 2007) and theoretical studies (Weaver et al., 1998) that considered the sensitivity of single neurons in quiescent systems (e.g., coupling constant, evoked responses) may underestimate the “functional” susceptibility of cells in active networks. As shown here, the behavior of a single neuron under electric fields may be dominated by its role in the network.
In addition, higher amplitude fields result in increased synchronization of firing times across neurons (early spikes are delayed and late spikes are advanced) (Radman et al., 2007). This increased synchronization of the excitatory volley leads to a larger drive to inhibitory neurons that respond with a stronger inhibitory volley and the next excitatory volley is suppressed (the network “skips a beat”). Provided there is a sufficiently strong field, this change in dynamics may occur also in response to frequencies above the endogenous oscillation, resulting in third or quarter harmonics.
A quantitative and inclusive framework for oscillation modulation by weak currents
The sensitivity of active networks to weak currents is well established; here, we swept the space of frequencies and field intensities to explain the underlying mechanisms. In vitro and in silico experiments allowed us to characterize and reconcile the spectrum of effects previously observed and combine them with new observations following a few basic principles: (1) rate effect: asymmetric power modulation by DC fields, reflecting a balanced excitatory/inhibitory drive; (2) rate effect: symmetric power modulation by lower frequency AC fields with a net-zero change in firing rate resulting from the rate-limiting property of the excitatory-inhibitory loop; (3) timing effect: half-harmonic oscillations for higher frequency applied AC fields resulting from increased spike timing precision across neurons; and (4) timing effect: phase-entrainment resonance.
Consideration of network architecture, dynamics, and field-specific coupling will allow the translation of these principles to a range of normal and pathological oscillations (e.g., epilepsy) (Durand and Bikson, 2001). For example, according to the present model, the entrainment of human slow-wave sleep oscillations (Marshall et al., 2005)—replicated in vitro (Fröhlich and McCormick, 2010) and in animal studies (Ozen et al., 2009) as entrainment of up-down state transitions—results from rate modulation, as observed here for DC and slow AC stimulation. Similarly, these basic principles provide a framework for understanding the role of endogenous electric fields, notably theta-modulated gamma (Fig. 9) as a slow AC rate modulation effect. Indeed, our results show that endogenous theta fields (1 V/m) (Buzsáki, 2002) are sufficient in themselves to account for gamma modulation and for the general phase relationship of spike times relative to endogenous theta fields (even without increasing coupling sensitivity for nonuniformity) (Anastassiou et al., 2010). Endogenous gamma fields are one order of magnitude lower than theta oscillations (Csicsvari et al., 2003); whether endogenous gamma fields have a functional role (e.g., Fig. 8C, coherence) remains to be determined (Bracci et al., 1999; Fujisawa et al., 2004; Weiss and Faber, 2010). Finally, increasing interest in the therapeutic potential of weak transcranial DC and AC stimulation to treat a range of neuropsychiatric disorders (Knotkova and Cruciani, 2010; Loo et al., 2010) necessitates a quantitative framework for understanding and optimizing electrotherapeutic strategies. The coupling of oscillations with weak applied fields may provide a substrate for the induction of plastic changes that must underlie the persistent effects observed after acute stimulation.
Generally, we hope the methodological framework established here, with a parsimonious but experimentally constrained model, will support efforts to explain neuromodulation by weak currents, with sophistication in E-field and network modeling (Tiesinga et al., 2001; Berzhanskaya et al., 2007) leveraged only as needed to refine clinical predictions.
The critical balance of excitation and inhibition is a recurring theme in physiological (Haider et al., 2006; Renart et al., 2010) and pathological (Trevelyan et al., 2006) network mechanisms and, as shown here, may govern susceptibility to electric fields.
Footnotes
This research was supported by National Institutes of Health-National Institute of General Medical Science Grant 41341-03. We are grateful to Thomas Radman (Nathan Kline Institute for Psychiatric Research, Orangeburg, NY), Abhishek Datta (City College of New York, New York, NY), and Mario Cammarota (Universita degli Studi Di Padova, Padova, Italy).
References
- Amarasingham A, Levy WB. Predicting the distribution of synaptic strengths and cell firing correlations in a self-organizing, sequence prediction model. Neural Comput. 1998;10:25–57. doi: 10.1162/089976698300017881. [DOI] [PubMed] [Google Scholar]
- Anastassiou CA, Montgomery SM, Barahona M, Buzsáki G, Koch C. The effect of spatially inhomogeneous extracellular electric fields on neurons. J Neurosci. 2010;30:1925–1936. doi: 10.1523/JNEUROSCI.3635-09.2010. [DOI] [PMC free article] [PubMed] [Google Scholar]
- Bartos M, Vida I, Jonas P. Synaptic mechanisms of synchronized gamma oscillations in inhibitory interneuron networks. Nat Rev Neurosci. 2007;8:45–56. doi: 10.1038/nrn2044. [DOI] [PubMed] [Google Scholar]
- Berzhanskaya J, Gorchetchnikov A, Schiff SJ. Switching between gamma and theta: dynamic network control using subthreshold electric fields. Neurocomputing. 2007;70:2091–2095. doi: 10.1016/j.neucom.2006.10.124. [DOI] [PMC free article] [PubMed] [Google Scholar]
- Bikson M, Inoue M, Akiyama H, Deans JK, Fox JE, Miyakawa H, Jefferys JG. Effects of uniform extracellular DC electric fields on excitability in rat hippocampal slices in vitro. J Physiol. 2004;557:175–190. doi: 10.1113/jphysiol.2003.055772. [DOI] [PMC free article] [PubMed] [Google Scholar]
- Boggio PS, Bermpohl F, Vergara AO, Muniz AL, Nahas FH, Leme PB, Rigonatti SP, Fregni F. Go-no-go task performance improvement after anodal transcranial DC stimulation of the left dorsolateral prefrontal cortex in major depression. J Affect Disord. 2007;101:91–98. doi: 10.1016/j.jad.2006.10.026. [DOI] [PubMed] [Google Scholar]
- Bracci E, Vreugdenhil M, Hack SP, Jefferys JG. On the synchronizing mechanisms of tetanically induced hippocampal oscillations. J Neurosci. 1999;19:8104–8113. doi: 10.1523/JNEUROSCI.19-18-08104.1999. [DOI] [PMC free article] [PubMed] [Google Scholar]
- Bragin A, Jandó G, Nádasdy Z, Hetke J, Wise K, Buzsáki G. Gamma (40–100 hz) oscillation in the hippocampus of the behaving rat. J Neurosci. 1995;15:47–60. doi: 10.1523/JNEUROSCI.15-01-00047.1995. [DOI] [PMC free article] [PubMed] [Google Scholar]
- Buzsáki G. Theta oscillations in the hippocampus. Neuron. 2002;33:325–340. doi: 10.1016/s0896-6273(02)00586-x. [DOI] [PubMed] [Google Scholar]
- Chan CY, Hounsgaard J, Nicholson C. Effects of electric fields on transmembrane potential and excitability of turtle cerebellar purkinje cells in vitro. J Physiol. 1988;402:751–771. doi: 10.1113/jphysiol.1988.sp017232. [DOI] [PMC free article] [PubMed] [Google Scholar]
- Creutzfeldt OD, Fromm GH, Kapp H. Influence of transcortical d-c currents on cortical neuronal activity. Exp Neurol. 1962;5:436–452. doi: 10.1016/0014-4886(62)90056-0. [DOI] [PubMed] [Google Scholar]
- Csicsvari J, Jamieson B, Wise KD, Buzsáki G. Mechanisms of gamma oscillations in the hippocampus of the behaving rat. Neuron. 2003;37:311–322. doi: 10.1016/s0896-6273(02)01169-8. [DOI] [PubMed] [Google Scholar]
- Datta A, Bansal V, Diaz J, Patel J, Reato D, Bikson M. Gyri-precise head model of transcranial DC stimulation: Improved spatial focality using a ring electrode versus conventional rectangular pad. Brain Stimul. 2009;2:201–207. doi: 10.1016/j.brs.2009.03.005. [DOI] [PMC free article] [PubMed] [Google Scholar]
- de Almeida L, Idiart M, Lisman JE. Memory retrieval time and memory capacity of the CA3 network: role of gamma frequency oscillations. Learn Mem. 2007;14:795–806. doi: 10.1101/lm.730207. [DOI] [PMC free article] [PubMed] [Google Scholar]
- Deans JK, Powell AD, Jefferys JG. Sensitivity of coherent oscillations in rat hippocampus to AC electric fields. J Physiol. 2007;583:555–565. doi: 10.1113/jphysiol.2007.137711. [DOI] [PMC free article] [PubMed] [Google Scholar]
- Durand D, Bikson M. Suppression and control of epileptiform activity by electrical stimulation: a review. Proc IEEE. 2001;89:1065–1082. [Google Scholar]
- Fisahn A, Pike FG, Buhl EH, Paulsen O. Cholinergic induction of network oscillations at 40 hz in the hippocampus in vitro. Nature. 1998;394:186–189. doi: 10.1038/28179. [DOI] [PubMed] [Google Scholar]
- Fisahn A, Yamada M, Duttaroy A, Gan JW, Deng CX, McBain CJ, Wess J. Muscarinic induction of hippocampal gamma oscillations requires coupling of the m1 receptor to two mixed cation currents. Neuron. 2002;33:615–624. doi: 10.1016/s0896-6273(02)00587-1. [DOI] [PubMed] [Google Scholar]
- Francis JT, Gluckman BJ, Schiff SJ. Sensitivity of neurons to weak electric fields. J Neurosci. 2003;23:7255–7261. doi: 10.1523/JNEUROSCI.23-19-07255.2003. [DOI] [PMC free article] [PubMed] [Google Scholar]
- Fregni F, Boggio PS, Lima MC, Ferreira MJ, Wagner T, Rigonatti SP, Castro AW, Souza DR, Riberto M, Freedman SD, Nitsche MA, Pascual-Leone A. A sham-controlled, phase II trial of transcranial direct current stimulation for the treatment of central pain in traumatic spinal cord injury. Pain. 2006;122:197–209. doi: 10.1016/j.pain.2006.02.023. [DOI] [PubMed] [Google Scholar]
- Fröhlich F, McCormick DA. Endogenous electric fields may guide neocortical network activity. Neuron. 2010;67:129–143. doi: 10.1016/j.neuron.2010.06.005. [DOI] [PMC free article] [PubMed] [Google Scholar]
- Fujisawa S, Matsuki N, Ikegaya Y. Chronometric readout from a memory trace: gamma-frequency field stimulation recruits timed recurrent activity in the rat CA3 network. J Physiol. 2004;561:123–131. doi: 10.1113/jphysiol.2004.066639. [DOI] [PMC free article] [PubMed] [Google Scholar]
- Gartside IB. Mechanisms of sustained increases of firing rate of neurons in the rat cerebral cortex after polarization: reverberating circuits or modification of synaptic conductance? Nature. 1968;220:382–383. doi: 10.1038/220382a0. [DOI] [PubMed] [Google Scholar]
- Gerstner W, Kistler WM. Cambridge, UK: Cambridge UP; 2002. Spiking neuron models. [Google Scholar]
- Ghai RS, Bikson M, Durand DM. Effects of applied electric fields on low-calcium epileptiform activity in the CA1 region of rat hippocampal slices. J Neurophysiol. 2000;84:274–280. doi: 10.1152/jn.2000.84.1.274. [DOI] [PubMed] [Google Scholar]
- Gluckman BJ, Neel EJ, Netoff TI, Ditto WL, Spano ML, Schiff SJ. Electric field suppression of epileptiform activity in hippocampal slices. J Neurophysiol. 1996;76:4202–4205. doi: 10.1152/jn.1996.76.6.4202. [DOI] [PubMed] [Google Scholar]
- Gluckman BJ, Nguyen H, Weinstein SL, Schiff SJ. Adaptive electric field control of epileptic seizures. J Neurosci. 2001;21:590–600. doi: 10.1523/JNEUROSCI.21-02-00590.2001. [DOI] [PMC free article] [PubMed] [Google Scholar]
- Gulyás AI, Hájos N, Freund TF. Interneurons containing calretinin are specialized to control other interneurons in the rat hippocampus. J Neurosci. 1996;16:3397–3411. doi: 10.1523/JNEUROSCI.16-10-03397.1996. [DOI] [PMC free article] [PubMed] [Google Scholar]
- Haider B, Duque A, Hasenstaub AR, McCormick DA. Neocortical network activity in vivo is generated through a dynamic balance of excitation and inhibition. J Neurosci. 2006;26:4535–4545. doi: 10.1523/JNEUROSCI.5297-05.2006. [DOI] [PMC free article] [PubMed] [Google Scholar]
- Hájos N, Pálhalmi J, Mann EO, Németh B, Paulsen O, Freund TF. Spike timing of distinct types of GABAergic interneuron during hippocampal gamma oscillations in vitro. J Neurosci. 2004;24:9127–9137. doi: 10.1523/JNEUROSCI.2113-04.2004. [DOI] [PMC free article] [PubMed] [Google Scholar]
- Ishizuka N, Weber J, Amaral DG. Organization of intrahippocampal projections originating from CA3 pyramidal cells in the rat. J Comp Neurol. 1990;295:580–623. doi: 10.1002/cne.902950407. [DOI] [PubMed] [Google Scholar]
- Iyer MB, Mattu U, Grafman J, Lomarev M, Sato S, Wassermann EM. Safety and cognitive effect of frontal DC brain polarization in healthy individuals. Neurology. 2005;64:872–875. doi: 10.1212/01.WNL.0000152986.07469.E9. [DOI] [PubMed] [Google Scholar]
- Izhikevich EM. Simple model of spiking neurons. IEEE Trans Neural Netw. 2003;14:1569–1572. doi: 10.1109/TNN.2003.820440. [DOI] [PubMed] [Google Scholar]
- Izhikevich EM. Cambridge, MA: MIT Press; 2006. Dynamical systems in neuroscience: the geometry of excitability and bursting. [Google Scholar]
- Jefferys JG. Influence of electric fields on the excitability of granule cells in guinea-pig hippocampal slices. J Physiol. 1981;319:143–152. doi: 10.1113/jphysiol.1981.sp013897. [DOI] [PMC free article] [PubMed] [Google Scholar]
- Kirov R, Weiss C, Siebner HR, Born J, Marshall L. Slow oscillation electrical brain stimulation during waking promotes EEG theta activity and memory encoding. Proc Natl Acad Sci U S A. 2009;106:15460–15465. doi: 10.1073/pnas.0904438106. [DOI] [PMC free article] [PubMed] [Google Scholar]
- Knotkova H, Cruciani RA. Non-invasive transcranial direct current stimulation for the study and treatment of neuropathic pain. Methods Mol Biol. 2010;617:505–515. doi: 10.1007/978-1-60327-323-7_37. [DOI] [PubMed] [Google Scholar]
- Li XG, Somogyi P, Ylinen A, Buzsáki G. The hippocampal CA3 network: an in vivo intracellular labeling study. J Comp Neurol. 1994;339:181–208. doi: 10.1002/cne.903390204. [DOI] [PubMed] [Google Scholar]
- Liebetanz D, Klinker F, Hering D, Koch R, Nitsche MA, Potschka H, Löscher W, Paulus W, Tergau F. Anticonvulsant effects of transcranial direct-current stimulation (tDCS) in the rat cortical ramp model of focal epilepsy. Epilepsia. 2006;47:1216–1224. doi: 10.1111/j.1528-1167.2006.00539.x. [DOI] [PubMed] [Google Scholar]
- Loo CK, Sachdev P, Martin D, Pigot M, Alonzo A, Malhi GS, Lagopoulos J, Mitchell P. A double-blind, sham-controlled trial of transcranial direct current stimulation for the treatment of depression. Int J Neuropsychopharmacol. 2010;13:61–69. doi: 10.1017/S1461145709990411. [DOI] [PubMed] [Google Scholar]
- Mann EO, Radcliffe CA, Paulsen O. Hippocampal gamma-frequency oscillations: from interneurones to pyramidal cells, and back. J Physiol. 2005;562:55–63. doi: 10.1113/jphysiol.2004.078758. [DOI] [PMC free article] [PubMed] [Google Scholar]
- Marshall L, Mölle M, Siebner HR, Born J. Bifrontal transcranial direct current stimulation slows reaction time in a working memory task. BMC Neurosci. 2005;6:23. doi: 10.1186/1471-2202-6-23. [DOI] [PMC free article] [PubMed] [Google Scholar]
- Miles R. Synaptic excitation of inhibitory cells by single CA3 hippocampal pyramidal cells of the guinea-pig in vitro. J Physiol. 1990;428:61–77. doi: 10.1113/jphysiol.1990.sp018200. [DOI] [PMC free article] [PubMed] [Google Scholar]
- Nitsche MA, Paulus W. Excitability changes induced in the human motor cortex by weak transcranial direct current stimulation. J Physiol. 2000;527:633–639. doi: 10.1111/j.1469-7793.2000.t01-1-00633.x. [DOI] [PMC free article] [PubMed] [Google Scholar]
- Nunez PL. New York: Oxford UP; 1981. Electric fields of the brain. [Google Scholar]
- Oren I, Mann EO, Paulsen O, Hájos N. Synaptic currents in anatomically identified CA3 neurons during hippocampal gamma oscillations in vitro. J Neurosci. 2006;26:9923–9934. doi: 10.1523/JNEUROSCI.1580-06.2006. [DOI] [PMC free article] [PubMed] [Google Scholar]
- Ozen S, Sirota A, Anastassiou CA, Belluscio MA, Koch C, Buzsáki G. Entrainment of cortical activity by applied electric fields. Soc Neurosci Abstr. 2009;35:192–8. [Google Scholar]
- Parra LC, Bikson M. Model of the effect of extracellular fields on spike time coherence. Conf Proc IEEE Eng Med Biol Soc. 2004;6:4584–4587. doi: 10.1109/IEMBS.2004.1404271. [DOI] [PubMed] [Google Scholar]
- Pogosyan A, Gaynor LD, Eusebio A, Brown P. Boosting cortical activity at beta-band frequencies slows movement in humans. Curr Biol. 2009;19:1637–1641. doi: 10.1016/j.cub.2009.07.074. [DOI] [PMC free article] [PubMed] [Google Scholar]
- Radman T, Su Y, An JH, Parra LC, Bikson M. Spike timing amplifies the effect of electric fields on neurons: implications for endogenous field effects. J Neurosci. 2007;27:3030–3036. doi: 10.1523/JNEUROSCI.0095-07.2007. [DOI] [PMC free article] [PubMed] [Google Scholar]
- Radman T, Ramos RL, Brumberg JC, Bikson M. Role of cortical cell type and morphology in sub- and suprathreshold uniform electric field stimulation. Brain Stimul. 2009;2:215–228. 228.e1–e3. doi: 10.1016/j.brs.2009.03.007. [DOI] [PMC free article] [PubMed] [Google Scholar]
- Renart A, de la Rocha J, Bartho P, Hollender L, Parga N, Reyes A, Harris KD. The asynchronous state in cortical circuits. Science. 2010;327:587–590. doi: 10.1126/science.1179850. [DOI] [PMC free article] [PubMed] [Google Scholar]
- Sik A, Tamamaki N, Freund TF. Complete axon arborization of a single CA3 pyramidal cell in the rat hippocampus, and its relationship with postsynaptic parvalbumin-containing interneurons. Eur J Neurosci. 1993;5:1719–1728. doi: 10.1111/j.1460-9568.1993.tb00239.x. [DOI] [PubMed] [Google Scholar]
- Su Y, Radman T, Vaynshteyn J, Parra LC, Bikson M. Effects of high-frequency stimulation on epileptiform activity in vitro: ON/OFF control paradigm. Epilepsia. 2008;49:1586–1593. doi: 10.1111/j.1528-1167.2008.01592.x. [DOI] [PubMed] [Google Scholar]
- Tiesinga PH, Fellous JM, José JV, Sejnowski TJ. Computational model of carbachol-induced delta, theta, and gamma oscillations in the hippocampus. Hippocampus. 2001;11:251–274. doi: 10.1002/hipo.1041. [DOI] [PubMed] [Google Scholar]
- Traub RD, Whittington MA, Colling SB, Buzsáki G, Jefferys JG. Analysis of gamma rhythms in the rat hippocampus in vitro and in vivo. J Physiol. 1996;493:471–484. doi: 10.1113/jphysiol.1996.sp021397. [DOI] [PMC free article] [PubMed] [Google Scholar]
- Traub RD, Bibbig A, Fisahn A, LeBeau FE, Whittington MA, Buhl EH. A model of gamma-frequency network oscillations induced in the rat CA3 region by carbachol in vitro. Eur J Neurosci. 2000;12:4093–4106. doi: 10.1046/j.1460-9568.2000.00300.x. [DOI] [PubMed] [Google Scholar]
- Trevelyan AJ, Sussillo D, Watson BO, Yuste R. Modular propagation of epileptiform activity: evidence for an inhibitory veto in neocortex. J Neurosci. 2006;26:12447–12455. doi: 10.1523/JNEUROSCI.2787-06.2006. [DOI] [PMC free article] [PubMed] [Google Scholar]
- Weaver JC, Vaughan TE, Adair RK, Astumian RD. Theoretical limits on the threshold for the response of long cells to weak extremely low frequency electric fields due to ionic and molecular flux rectification. Biophys J. 1998;75:2251–2254. doi: 10.1016/S0006-3495(98)77669-6. [DOI] [PMC free article] [PubMed] [Google Scholar]
- Weiss SA, Faber DS. Field effects in the CNS play functional roles. Front Neural Circuits. 2010;4:15. doi: 10.3389/fncir.2010.00015. [DOI] [PMC free article] [PubMed] [Google Scholar]
- Williams JH, Kauer JA. Properties of carbachol-induced oscillatory activity in rat hippocampus. J Neurophysiol. 1997;78:2631–2640. doi: 10.1152/jn.1997.78.5.2631. [DOI] [PubMed] [Google Scholar]
- Wittner L, Henze DA, Záborszky L, Buzsáki G. Hippocampal CA3 pyramidal cells selectively innervate aspiny interneurons. Eur J Neurosci. 2006;24:1286–1298. doi: 10.1111/j.1460-9568.2006.04992.x. [DOI] [PubMed] [Google Scholar]
- Wu X, Baxter RA, Levy WB. Context codes and the effect of noisy learning on a simplified hippocampal CA3 model. Biol Cybern. 1996;74:159–165. doi: 10.1007/BF00204204. [DOI] [PubMed] [Google Scholar]