

Abstract
Ice formation on warming is of comparable or greater importance to ice formation on cooling in determining survival of cryopreserved samples. Critical warming rates required for ice-free warming of vitrified aqueous solutions of glycerol, dimethyl sulfoxide, ethylene glycol, polyethylene glycol 200 and sucrose have been measured for warming rates of order 10 to 104 K/s. Critical warming rates are typically one to three orders of magnitude larger than critical cooling rates. Warming rates vary strongly with cooling rates, perhaps due to the presence of small ice fractions in nominally vitrified samples. Critical warming and cooling rate data spanning orders of magnitude in rates provide rigorous tests of ice nucleation and growth models and their assumed input parameters. Current models with current best estimates for input parameters provide a reasonable account of critical warming rates for glycerol solutions at high concentrations/low rates, but overestimate both critical warming and cooling rates by orders of magnitude at lower concentrations and larger rates. In vitrification protocols, minimizing concentrations of potentially damaging cryoprotectants while minimizing ice formation will require ultrafast warming rates, as well as fast cooling rates to minimize the required warming rates.
Keywords: warming, cooling, thawing, freezing, vitrification, cryopreservation, ice formation, nucleation, crystal growth, cryoprotectant, aqueous glass, critical warming rate, CWR, critical cooling rate, CCR, glycerol, ethylene glycol, dimethyl sulfoxide, DMSO, polyethylene glycol 200, PEG 200, sucrose, ice
1. Introduction
How can biological samples be cooled, stored and then warmed without damage? Most studies of cryopreservation have focused on the cooling process and its consequences. Recent work suggests that the warming process is of comparable or greater importance in preserving biological function [43,51,52]. Significant intracellular ice nucleation and growth can be lethal, and can occur on both cooling and warming [52,60]. Thus it is important for successful cryopreservation to minimize the formation of intracellular ice.
Pure water can be supercooled to the homogeneous ice nucleation temperature Th = 235 K (−38°C) [21], and can be vitrified by cooling below its glass transition temperature Tg = 136 K (−137°C) [21] at rates of order 106 K/s [18,37]. Upon warming, spontaneous ice nucleation and growth occurs above ~150 K (−123°C) [21], followed by recrystallization and then melting. Ice volume increases both by nucleation and growth of new ice nuclei and growth of ice formed during cooling. Cryoprotectants suppress ice nucleation and reduce growth rates, and so reduce cooling rates required for sample vitrification [26] and warming rates to minimize ice formation during warming and sample recovery.
A large number of studies have examined how critical cooling rates (CCRs) required for vitrification (i.e., to keep ice volume fraction formed on cooling below a minimum detectable (small) value) vary with cryoprotectant concentration and type in aqueous solutions and in cells, most at cooling rates below 10 K/s. Experimental study of critical warming rates is more challenging. Ice forms much more readily on warming, so critical warming rates (CWRs) of a given solution are much larger than critical cooling rates. Moreover, ice formation on warming to room or biological temperature is transient. The slow warming rates characteristic of calorimetric methods used in previous studies have generally been insufficient to measure critical warming rates for moderate concentrations of most cryoprotectants [16]. Critical warming rate data have only been reported for a few cryoprotectants (DMSO, levo-2,3-butanediol, propane-1,2-diol, propylene glycol, propylene glycol monomethyl ether, DL-theritol, and 1,4-Di-O-methyl-DL-theritol), and only for critical warming rates below ~8.3 K/s [2,9,14,16,58].
Vitrification procedures are becoming increasingly accepted in cryopreservation, especially of single cells like oocytes and embryos [27,47]. Because cooling is rapid, little water transport across the cell membrane (driven in part by ice formation in the extracellular medium) and thus little intracellular dehydration can occur [24]. Conventional vitrification techniques employing moderate cooling rates thus require substantial cryoprotectant concentrations to prevent intracellular ice formation. Ultra-rapid vitrification techniques, in which very small volume (<0.1 μl) samples are plunge cooled in liquid nitrogen and plunge warmed in aqueous solutions, give much larger cooling and warming rates and thus reduce required cryoprotectant concentrations [51,52]. Recent work on mouse oocytes found that survival increased with warming rate up to the maximum examined rate of ~2000 K/s [43].
Here we report measurements of the critical warming rates required to prevent ice formation in aqueous solutions of common cryoprotectants. Our data for glycerol, DMSO, ethylene glycol, polyethylene glycol 200 and sucrose cover warming rates between ~10 and ~104 K/s, the smallest of these rates being larger than the largest rate measured in previous studies. We find a strong dependence of critical warming rate on cooling rate, with larger cooling rates giving smaller critical warming rates and allowing the use of smaller cryoprotectant concentrations. We describe the apparatus developed for achieving and measuring these rates, and compare our CWR results with predictions of models for ice nucleation and growth [31–35,39,41,54]. We also report measurements of critical cooling rates for DMSO, ethylene glycol and polyethylene glycol 200.
2. Materials and Methods
2.1 Materials
All cryoprotectants studied were obtained either from Sigma-Aldrich (St. Louis, MO) or Avantor Performance Materials (Phillipsburg, NJ) and were 99+% pure. Each was mixed weight per weight (w/w) with 16.7 MΩ-cm DI water filtered in a Barnstead Nanopure II system (Thermo Scientific, Dubuque, IA). Weighing errors corresponded to less than ±0.2% w/w. In the case of sucrose near its solubility limit, solutions were heated and sonicated to ensure full mixing.
2.2 Experimental apparatus for warming
Figure 1 shows a schematic illustration of the apparatus developed for measuring critical warming rates. Samples were cooled either by insertion into a cold nitrogen gas stream or by plunging in liquid nitrogen, and were warmed by immersion in hot oil. Ice formation was assessed by a visual assay using a microscope and high-speed camera. A detailed description of each component follows.
Figure 1.

Schematic illustration of the experimental setup used to measure critical warming rates.
Cold gas stream
A T~100 K (−173 °C) cold gas stream was produced using a coiled copper tube immersed in liquid nitrogen (LN2) contained in a sealed storage tank. Nitrogen gas boil-off within the tank entered the coil at the top of the tank, and exited the coil outside the tank. With a flow rate of ~0.5 l/s, controlled by environmental heat input to the storage tank, the exit flow was laminar. After filling the tank, the measured gas stream temperature increased at ~0.001 K/s as nitrogen boiled off, from ~94 K (−179 °C) to a maximum of ~103 K (−170 °C), well below water’s glass transition temperature. Heaters were incorporated in early versions, but were later deemed unnecessary because precise temperature control was unimportant.
Oil immersion tank
The oil immersion tank consisted of a 60 ml stainless steel cup filled with Light Mineral Oil (Fisher Scientific, Waltham, MA). The oil temperature determined the maximum warming rates, and so the oil was warmed on a hotplate from 295 K (22 °C) up to 450 K (180 °C). Samples were kept cold in the gas stream, and were abruptly warmed by manually lifting the cup up through the cold gas stream until the sample was fully immersed in oil. With a ~0.5 m/s vertical cup velocity (determined from high speed imaging) and a cup filled to its brim, the transition time between cold stream cooling and full oil immersion was at most a few ms. This short transition time prevented condensation and ice formation on the sample from the surrounding humid air.
Sample holder
Samples were held either in microfabricated polyimide loops with circular openings of 20 to 300 μm, attached to 0.64 mm diameter stainless steel rods (MicroLoops LD, MiTeGen Ithaca, NY) or in loops of 100 μm diameter polyester thread with nominal loop diameters from ~0.3 to 5 mm, glued into 0.64 mm diameter hollow stainless steel rods (MicroTubes, Hampton Research, Aliso Viejo, CA), as shown in Fig. 2(a) and (b). The rods were inserted into a magnetic steel base (Reusable Goniometer Base, MiTeGen), which was held by a magnet to the end of a 9 mm diameter glass (thermally insulating) rod. This rod was attached to an x-y manual translation stage (Thorlabs, Newton, NJ), allowing fine positioning of the sample in the cold gas stream and in the microscope’s field of view.
Figure 2.
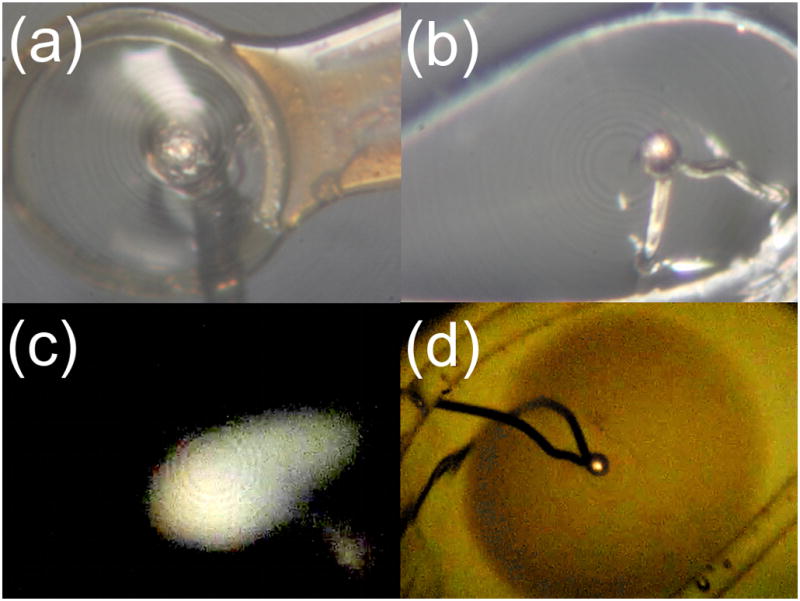
(a) Drop of water-glycerol solution mounted in a 300 μm polyimide loop (MicroLoop LD, MiTeGen) with thermocouple. (b) Drop mounted in a custom loop with thermocouple. (c) Dark field optical ice assay. (d) Bright field optical ice assay.
Thermocouple holder
To measure the temperature of loop-mounted samples, bare-wire type-E thermocouples with standard connectors (OMEGA Engineering, Stamford, CT) were attached to the end of a glass rod. The rod was mounted on an x-y-z manual translation stage (Thorlabs) to facilitate insertion and fine positioning of the thermocouple within the sample. Thermocouple wire diameters ranged from 0.003″ (75 μm) to 0.0005″ (12.5 μm), with a typical diameter of 0.001″ (25 μm). For each thermocouple size, the warming rate of the bare junction when immersed in hot oil was determined. For each sample volume, a thermocouple size was then chosen that would not limit the measured sample warming rate. Thermocouple voltages were measured and digitized using a 6052E DAQ card (National Instruments, Austin, TX), at a sampling rate of 250 kHz.
Sample imaging
Samples were imaged during cooling and warming using a Casio EX-F1 high speed camera (Casio, Dover, NJ), which provided frame rates of 24, 30, 60, 300, 600 and 1200 frames per second. This camera was attached to a Stemi 2000-C microscope (Carl Zeiss MicroImaging, Thornwood, NJ), with primary illumination provided by fiber optics. Still images and high speed videos were acquired in either bright field mode (with diffuse illumination scattered from a white background behind the sample) or dark field mode (looking for scatter from ice with a black background behind the drop), as shown in Fig. 2(c) and (d).
2.3 Warming rate data collection
Aqueous cryoprotectant solutions with volumes ranging from ~50 nL to 10 μL were dispensed into appropriate diameter loops. Most samples were cooled in a T~100 K nitrogen gas stream, which gave cooling rates from ~5 K/s to ~1200 K/s, depending upon sample volume. Dehydration was negligible in all cases, because water’s vapor pressure rapidly decreases as it cools (dropping by a factor of 4 between 20 °C and 0 °C and another factor of 6 (in the supercooled state) from 0 °C to −20 °C [38]), because the addition of cryoprotectants further reduces water’s activity, and because the slowest cooling rates were achieved using the largest samples and containing the largest cryoprotectant concentrations. Samples were warmed by immersion in oil, at rates ranging from ~5 K/s to ~30,000 K/s. Cooling and warming rates are determined by the sample volume and shape, by the cooling or warming medium and its temperature, and by the sample’s speed relative to the cooling medium. In practice, sample size produces larger variations in cooling/warming rates than choice of cooling/warming medium, temperature and flow/sample speed [40]. Consequently, cooling and warming rates tend to be strongly coupled at rates above ~100 K/s. Adjusting the other experimental parameters to obtain significant independent variation is difficult except at very low (<10 K/s) rates.
To study the effects of cooling rate on critical warming rates, a method for cooling samples of similar size at rates spanning a few orders of magnitude was required. Smaller cooling rates were obtained by enclosing loop mounted samples in plastic capillary tubes sealed at one end and covered with varying thicknesses of spray foam insulation. For ~0.25 μL samples, this method gave cooling rates in the nitrogen gas stream as small as 5 K/s. Prior to warming, the capillary could be removed while the sample was held at 100 K (−173 °C) in the nitrogen gas stream, to maximize the warming rate. Warming rates for these samples varied from ~200 K/s to ~5000 K/s (compared with a maximum rate of ~30,000 K/s achieved for our smallest samples). The largest cooling rates were achieved by plunge cooling loop mounted samples into liquid nitrogen, following the “hyperquenching” technique described in reference [56] which involves blowing away the cold gas layer above the liquid nitrogen immediately prior to plunging.
Ice formation was assayed by judging sample transparency/opacity [6], as shown in Fig. 2(c) and (d). X-ray diffraction measurements [57] suggest that for ~μl volume drops the assay has a minimum detectible ice volume fraction of ~0.01 (1%). Critical cooling rates determined using this assay agree with previous literature values determined by other methods [57]. On cooling, ice formation could be assessed from high resolution still images acquired after cooling was complete, as there was no subsequent sample evolution. But any ice formed on warming disappears when the sample undergoes final melting, and so transient ice was detected by frame-by-frame analysis of high-speed videos.
Warming (cooling) rates were quantified as the average warming (cooling) rate between T=150 K (−123 °C) and 240 K (−33 °C), roughly corresponding to the glass transition temperature and the homogeneous nucleation temperature of pure water [21], respectively. Critical warming rates were calculated as the average of the fastest rate that produced detectable ice and the slowest rate that did not. An uncertainty in this value was calculated as half the difference between the two bounding rates. Error and irreproducibility in temperature and rate measurements could result from sample-to-sample variations in the position of the thermocouple within each sample. To quantify any such effect, dual thermocouple probes were constructed to allow simultaneous temperature measurement at the center and edge of a sample. Cooling and warming rates measured for a range of sample volumes using the two thermocouples differed on average by 1% and at most by 10%.
2.4 Critical cooling rates
Critical cooling rates were measured for aqueous solutions of DMSO, ethylene glycol, and PEG 200, at lower concentrations and faster cooling rates than have been previously examined. These measurements were performed using the method described in [57], by plunging solution- and thermocouple- containing capillaries of different diameters into liquid nitrogen. Using capillaries instead of loops simplified thermocouple positioning and temperature measurements, but limited maximum achievable cooling rates.
2.5 Theoretical modeling
Several models based upon classical theories of crystal nucleation and growth have been developed to explain ice formation in aqueous solutions and in cells as a function of temperature [32–35,39,41,54]. Karlsson [32] recently compared these models, and showed that the model of Karlsson, Cravalho and Toner [33–35] (hereafter referred to as the KCT model) most closely matches experimental results for melting point depression, nucleation point depression and time to nucleation in NaCl (0–6 mol/kg) and glycerol (40% w/w) solutions [32]. The KCT model has also been applied to describe ice formation upon warming [31].
The KCT model was developed to describe cells, and includes a model for transport of water across the cell membrane and intracellular dehydration in response to extracellular ice formation. To analyze our data for cell-free aqueous solutions, we use the ice nucleation and growth components of the KCT model, which build upon earlier analyses of nucleation [54] and growth [20,41]. We summarize below these model components, and then use glycerol-specific parameters to model glycerol critical cooing and warming rate data. Unless otherwise noted, all temperatures are in K and, to facilitate connection to experiment, all concentrations are in units of weight per weight ( 0 < c < 1).
The total ice fraction formed during warming is obtained by summing contributions from ice nucleation and growth of those nuclei and from growth of pre-existing nuclei formed during cooling. The homogeneous ice nucleation rate, J, is given by [32,54]
| (1) |
where c is the solute (in our case, cryoprotectant) concentration, T is the temperature, Ω(c, T) and κ (c, T) are the kinetic and thermodynamic homogeneous nucleation rate coefficients [54] as defined in [32], and τ (c, T) is a dimensionless temperature [34].
Following [34], ice growth is described using a non-isothermal diffusion-limited growth model [41]. The radius at a time t of a crystal nucleated at time t′ is [41]
| (2) |
where α (T ) is a dimensionless crystal growth parameter (of order unity), D̄ (c, T) is an effective diffusion coefficient as defined in Eq. (9) below, and q is the cooling or warming rate. Assuming spherical ice growth and that growing ice fronts do not run into each other (no impingement), the extended volume fraction of ice formed on cooling is given by
| (3) |
where V0 is the sample volume, qc < 0 is the cooling rate, Ti is the initial temperature and Tf is the (lower) final temperature. This calculated volume fraction overestimates the actual ice fraction at larger fractions when the probability of ice fronts intersecting is much larger.
Similarly, the extended ice volume fraction for warming is
| (4) |
where qw > 0 is the warming rate. The first term — an integral from warm Ti to cold Tf —gives the ice fraction due to crystal nucleation and growth on cooling and then subsequent additional growth of those crystals on warming. The last term — an integral from cold Tf to warm Ti — gives the ice fraction due to ice nucleation on warming and the subsequent growth of those nuclei [31]. The actual (experimental) volume ice fraction χ, which includes the effects of (soft and hard) impingement of ice fronts during growth, is conventionally estimated [34] as
| (5) |
χ is smaller than Vice,w/V0, but approaches Vice,w/V0 when Vice,w/V0 is small.
The model requires as input a function for the concentration- and temperature-dependent solution viscosity, the concentration-dependent homogeneous nucleation temperature and melting temperature, and the concentration- and temperature-dependent diffusion coefficient. Karlsson [32] provides a parameterization of the viscosity for DMSO and glycerol and for the melting and nucleation temperatures for a general aqueous solution. For glycerol, the viscosity used in [32] differs from measurements given in [55], and the melting temperature in [32] disagrees with measured values, particularly at high concentration [7]. We have used the concentration and temperature dependent viscosity model from [55] and a fit to Tm (c) from [7] given by
| (6) |
In [34], the diffusion constant is evaluated using the Stokes-Einstein equation,
| (7) |
where η(c, T) is the solution viscosity, kB is the Boltzmann constant, and a0 is the hydrodynamic radius of water. Recent experimental evidence suggests that nanoconfined water, protein hydration water, bulk water, and bulk water with solutes violate the Stokes-Einstein relation at low temperatures [1,19,42]. The effects of solutes on the diffusion constant and non-Stokes-Einstein behavior have not yet been systematically evaluated. We thus calculate the diffusion constant of the solution as
| (8) |
where η is the solution viscosity [55], ηw is the viscosity of water [55], and Dw (c, T ) is the diffusion constant of water as measured in [19].
Finally, for diffusion-limited growth, water near ice crystals is depleted relative to the bulk solution. Following [34], we average the diffusion coefficient of Eq. (8) between the edge of the ice crystal and a point in the bulk solution to find the effective diffusion coefficient,
| (9) |
where cw∞ is the water concentration far from a crystal, cwliq < cw∞ is the liquidus water concentration, cw = 1 − c, and the “m” subscripts denote concentrations in mol/L [34]; the conversion from w/w to mol/L is given by
| (10) |
where c = m1/(m1 + m2 ) is the concentration in w/w, m1 and ρ1 ( m2 and ρ2 ) are the mass and density of the first (second) component of the solution in g/cm3, and M1 is the molar mass of the first component in mol/g. The liquidus concentration is the water concentration at the ice-liquid boundary, where the solution melting point is equal to the temperature. The equilibrium water-glycerol phase diagram has a eutectic point at 66.7 % w/w glycerol and 226.5 K (−46.6°C), but at higher glycerol concentrations the observed crystallization is of glycerol, not water. Thus, following [7], the water melting curve is simply extrapolated to higher concentration and lower temperatures, and cwliq is found by solving equation (6) for c(Tm).
The dimensionless crystal growth parameter α is defined by the transcendental equation [41]
| (11) |
with
| (12) |
where cws is the nondimensional supersaturation and cwβ is the water concentration inside the ice crystal (assumed to be 55.6 M), and the “m” subscript again denotes concentrations in mol/L [34]. Equation (11) can be solved numerically.
To evaluate the predictions of this model for critical cooling rates of aqueous glycerol solutions, Mathematica was used to numerically solve equation (3) and (5), using Ti = Tm (c) and Tf = Tg (c), temperatures corresponding to the melting transition and glass transition temperature of the solution. The assumed critical ice volume fraction was 0.01 (1%) roughly matched the minimum detectable ice fractions in our experiments.
The ice fraction formed on warming depends on the cooling history through the first term in Eq. (4). Critical warming rates were calculated using the same cooling rates as were used in preparing the samples for each CWR measurement (Table 1) at all glycerol concentrations except 40% w/w where the predicted CCR is higher than the experimental cooling rate.
Table 1.
Measured critical warming rate, CWR; the uncertainty in the measurement, as discussed in the Methods section; the cooling rate, CR, at which the critical warming rate was measured; and previously measured critical cooling rate, CCR, if known. As discussed in Section 2.3, warming rates are varied by varying the drop size, which also leads to variations cooling rate. The conversion from concentration c in w/w to v/v is given by where ρs is the solute density in g/cm3. Drop volumes were roughly 5, 1, 0.2, 0.01 and 0.005 μl for CWRs of 20, 300, 1200, 7000 and 19,000 K/s, respectively.
| Cryoprotectant | Concentration (% w/w) | CWR (K/s) | CWR Uncertainty (K/s) | CR (K/s) | CCR (K/s) if known |
|---|---|---|---|---|---|
| Glycerol ρs = 1.261g/cm3 |
54 | 67.1 | 3 | 38.8 | |
| 52 | 379 | 46 | 66.1 | ||
| 50 | 866 | 162 | 168 | 0.7–1.4 [8,15,53,58] | |
| 48 | 1150 | 50 | 95.1 | 2.3 [53] | |
| 46 | 2590 | 490 | 500 | 4.0–4.8 [6,53] | |
| 44 | 7520 | 2310 | 753 | 7.5 [6] | |
| 42 | 13300 | 700 | 856 | 20.7 [57] | |
| 40 | 18700 | 400 | 1050 | 35.8 | |
| DMSO ρs = 1.1004g/cm3 |
46 | 22.1 | 8.8 | 9 | 3.1 [6] |
| 44 | 248 | 45 | 31.9 | 0.7–4.0 [6,53] | |
| 42 | 2160 | 400 | 309 | 1.8 [53] | |
| 40 | 11400 | 5300 | 738 | 7.5–8.3 [2,6] | |
| Ethylene Glycol ρs = 1.1132g/cm3 |
50 | 14.3 | 5.9 | 8 | 0.08–.18 [4,58] |
| 48 | 156 | 34 | 42.6 | 0.3–3.1 [4,6] | |
| 46 | 299 | 9 | 141 | 3.1 [6] | |
| 44 | 1160 | 140 | 178 | 3.1 [6] | |
| 42 | 3230 | 1270 | 295 | 4.8–17.7 [6] | |
| 40 | 7690 | 6 | 567 | 9.0–9.5 [4,58] | |
| PEG 200 ρs = 1.1239 g/cm3 |
52 | 185 | 16 | 69.4 | |
| 50 | 227 | 11 | 60.9 | ||
| 48 | 353 | 79 | 71.7 | 3.1 [6] | |
| 46 | 1040 | 140 | 189 | 4.0 [6] | |
| 44 | 1270 | 200 | 259 | 7.5–17.8 [6] | |
| 42 | 11700 | 1800 | 231 | 7.5 [6] | |
| Sucrose ρs = 1.587g/cm3 |
64 | 178 | 40 | 37.1 | |
| 62 | 1400 | 430 | 107 | ||
| 60 | 5560 | 2090 | 564 | ||
| 58 | 19400 | 7090 | 812 |
To obtain a lower bound on the predicted ice fraction and thus a lower bound on the critical warming rate, we neglected ice nucleated on cooling and evaluated only the second term of equation (4), which gives the ice that forms on warming a perfectly vitrified sample. CWRs for glycerol concentrations from 1% to 55% w/w. were evaluated numerically in Mathematica, using the same temperature limits as the CCR calculations.
CCR and CWR calculations were repeated for DMSO using functional forms for the viscosity as a function of temperature and concentration and for the melting/liquidus temperature as a function of concentration given in [32]. The calculated CCRs and CWRs (not shown) were orders of magnitude greater than those calculated for glycerol, likely due to less accurate input parameters. In [32] functional forms for the viscosity and melting temperature of aqueous solutions of DMSO are provided. However, no comparison with experimental data is provided for the viscosity, and the melting temperature expression is based on data extending only to ~253 K (−20 °C). The viscosity and melting temperature for glycerol in [32] does not agree with measurements [7,55] and so there may be similar inaccuracies in the DMSO data.
3. Results
3.1 Critical warming and cooling rate measurements
Figure 3 shows semi-log plots of critical warming rates, measured after cooling to T=100 K in the cold gas stream, as well as new and published critical cooling rates as a function of cryoprotectant concentration for glycerol [6,13,53,57,58], DMSO [2,6,53], ethylene glycol [4,6,13,58], PEG 200 [6] and sucrose [6]. Table 1 gives the measured critical warming rates and Table 2 gives the measured critical cooling rates. Over the concentration range measured, both critical warming rates and critical cooling rates roughly fall on straight lines, which suggests an exponential dependence on concentration. Figure 3 shows that the critical warming rates are uniformly larger – by factors of 10 to 1000 – than the critical cooling rates at the same concentration. The slopes of the critical warming rate data are larger than those of the critical cooling rate data, as summarized in Table 3. Figure 3(b) shows that previous critical warming rate data for large concentrations of DMSO [2,14,16] are consistent with the present measurements at lower concentrations and higher warming rates
Figure 3.

(a)–(e): Measured critical warming rates (red circles); previously predicted critical warming rates (orange squares) for glycerol [16], DMSO [2,14,16], and ethylene glycol [4,16,58]; previously measured CWRs (pink circles) for DMSO [2,14,16]; previously measured CCRs (blue diamonds) for glycerol [6,13,53,57,58], DMSO [2,6,53], ethylene glycol [4,6,13,58], PEG 200 [6], and sucrose [6] solutions; and the CCR of water (teal diamond) [18,37]. The red and blue (upper and lower) lines are exponential fits to the critical warming and cooling rate data, respectively. (f): Measured critical warming rates (circles), the CCR of water (diamond) [18,37], and exponential fits (solid lines) to the CWRs for the aqueous solutions of (a)–(e).
Table 2.
Critical cooling rates (CCR) for DMSO, ethylene glycol and PEG 200, measured as described in Section 2.4.
| Cryoprotectant | Concentration (% w/w) | CCR (K/s) |
|---|---|---|
| DMSO | 39 | 17.7 |
| 37 | 35.8 | |
| 35 | 60 | |
| 33 | 123 | |
| 32 | 300 | |
| 29 | 574 | |
| 27 | 784 | |
| Ethylene Glycol | 42 | 17.7 |
| 38 | 35.8 | |
| 35 | 60 | |
| 31 | 123 | |
| 29 | 300 | |
| 25 | 784 | |
| PEG 200 | 44 | 17.7 |
| 40 | 35.8 | |
| 38 | 60 | |
| 37 | 123 | |
| 33 | 300 | |
| 31 | 574 | |
| 29 | 784 |
Table 3.
Coefficients αCCR, αCWR, q0,CCR and q0,CWR for exponential fits of the form qcrit (c)= q0 exp(−αc) to experimental data for the critical cooling warming rates, respectively, for aqueous solutions of five cryoprotectants. Note that c is in w/w, and takes values from 0 to 1.
| Cryoprotectant | αCCR | αCWR | αCWR/αCCR | q0,CCR (K/s) | q0,CWR (K/s) |
|---|---|---|---|---|---|
|
| |||||
| Glycerol | 26 | 39 | 1.5 | 5.3 × 10⁵ | 1.4·1011 |
| DMSO | 34 | 110 | 3.2 | 4.0 ·106 | 3.6·1022 |
| Ethylene Glycol | 29 | 54 | 1.9 | 9.4 ·105 | 2.3·1013 |
| PEG 200 | 32 | 37 | 1.2 | 1.1 ·107 | 1.9·1010 |
| Sucrose | 37 | 79 | 2.1 | 9.5 ·107 | 2.2·1024 |
The effect of cooling rate on the critical warming rate was measured for a 44% w/w ethylene glycol solution. The critical cooling rate of this solution, ~3–5 K/s [4,6,13,58], was just below the smallest cooling rate we could achieve with our setup. This allowed the effect of cooling rate on critical warming rate to be measured for cooling rates from ~1 to 102 times the CCR. Figure 4 shows the results. At cooling rates from ~2 to 20 times the critical cooling rate, the critical warming rate was larger than 5000 K/s (the fastest rate measurable with the apparatus used for this set of measurements). However, at a cooling rate of ~1000 K/s, ~200 times the critical cooling rate, the critical warming rate dropped to ~350 K/s.
Figure 4.

Measured critical warming rate versus sample cooling rate for 44% w/w ethylene glycol solutions. Red circles indicate measured critical warming rates. Orange arrows indicate measured lower limits for the critical warming rate when the rate was too fast to measure; the actual warming rates must lie in or above the red shaded region. The dashed line indicates the measured critical cooling rate [4,6,13,58].
3.2 Model calculations
Figure 5 shows critical warming rates predicted assuming the experimental cooling rates (and thus including effects of ice formed during cooling), lower bound critical warming rates predicted assuming warming from an ice-free (fully vitrified) initial state, predicted critical cooling rates, critical warming rates predicted by Eq. (15) of Ref. [16], and our experimental data versus concentration for glycerol. At all concentrations, the model’s predicted lower bound on the critical warming rate is larger than the critical cooling rate, consistent with experiment. This predicted lower bound is in rough agreement with measured CWRs at larger concentrations, but is orders of magnitude larger than observed rates at smaller concentrations. Critical warming rates from 42–54% w/w glycerol predicted using the experimental cooling rates from are uniformly higher than the lower bound prediction by a factor of ~10, and larger than measured rates by a factor of ~10–100. Predicted critical cooling rates are in rough agreement with experiment at large concentrations, are orders of magnitude larger than experiment at small concentrations, and do not reproduce the observed exponential concentration dependence. The discrepancies between predicted and measured rates are relatively insensitive to the assumed “critical” ice fraction: increasing (decreasing) the fraction from 0.01 to 0.1 (0.001) changes the critical warming and cooling rates by less than a factor of four over the examined concentration range. Consequently, the discrepancies are relatively insensitive to uncertainty/variation in the minimum detectable ice fractions in our experiments. From a previous simulation of the KCT model [31], a critical warming rate of ~20 K/s can be deduced for an initially ice-free (i.e., fully vitrified) solution containing 7.9 M (63% w/w) glycerol and 0.6 M NaCl, too large given our measured CWR of 67.7 K/s at 54% w/w glycerol. Our calculated lower bound is 0.06 K/s, and our experimental data extrapolates to ~1 K/s. Slow rates are at this concentration are expected, as water crystallization in glycerol concentrations greater than 66.7% w/w is so slow as to be unobservable on laboratory timescales [7].
Figure 5.

Measured critical warming (red circles) and cooling rates (blue diamonds) [6,13,53,57,58], predicted critical warming rates from previous data (yellow squares) [16], our modeled critical warming rates using the experimental cooling rate at each data point (green squares), our modeled lower bound on the critical warming rates (assuming warming from an ice-free state) (red line), and our modeled critical cooling rates (blue line). CCR of water (diamond) [18,37] shown for reference.
As a check on the model and our calculations in their most likely regime of applicability (i.e., at high concentrations), nucleation rates and isothermal ice growth rates were calculated as a function of temperature for a 50% glycerol solution. For the diffusion limited growth model used in the KCT model, the linear growth rate depends on the size r of the particle [41]
| (13) |
To compare model predictions with the experimental data in [29], an initial radius of 0.1 μm – an estimate for the smallest detectable nucleus based on images in [29] - was used As shown in Fig. 6, predicted initial growth rates are a factor of four below experimentally measured growth rates [29]. The temperature of the peak nucleation rate is roughly 10 K below the temperature with the smallest time to transition (183 K (−90°C)) on the measured TTT curve [30]. The calculations thus provide a reasonable but not completely accurate description of the experimental nucleation and growth rates relevant at high glycerol concentrations.
Figure 6.

Calculated nucleation rate (red, left axis) and growth rate (blue, right axis) for a 50% w/w glycerol solution, using the KCT model. Experimentally measured growth rates (green circles) and the temperature of least time on a TTT curve (dotted vertical line) are shown for comparison [29,30].
4. Discussion
4.1 Concentration dependence
For all cryoprotectants studied here, the available data for both the critical cooling and warming rates show an approximately exponential variation with cryoprotectant concentration (w/w) c, i.e.
| (14) |
where qcrit is the critical rate, q0 is the critical rate at zero concentration and α is a scale factor. Table 3 gives parameters obtained by fitting Eq. (14) to data for several cryoprotectants. For all cryoprotectants, α is larger, by factors ranging from 1.2 to 3.2, for warming than for cooling.
Previous exponential fits to critical cooling rate data for glycerol [57] extrapolated at c=0 to the measured critical cooling rate of pure water, as one would expect if the concentration dependence of the critical cooling rate was, in fact, exponential. As shown in Fig. 3(f), extrapolations of exponential fits to the present CWR data do not converge to the same c= 0 value — the (presently unknown and possibly unmeasurable) critical warming rate of pure water.
4.2 Variation of critical warming rate with cooling rate
The critical warming rate strongly depends upon the cooling rate, even when cooling rates are much larger than the critical cooling rate. As shown in Fig. 4, increasing the cooling rate from ~20 to ~200 times the critical cooling rate decreases the critical warming rate by a factor of at least 15. This strong dependence is likely due to the rapid growth during warming of ice that nucleated during cooling.
The measured critical cooling rate is defined as the minimum rate required so that no ice is detectable, and so depends on the ice detection sensitivity. Calculations suggest that reducing the ice volume fraction from 2.3% to 10−4% requires cooling rates be increased by roughly two orders of magnitude [39]. Consequently, even cooling rates much larger than the measured critical cooling rates should yield ‘vitreous’ samples with significant ice nuclei concentrations.
The strong cooling rate dependence of the critical warming rates in Fig. 4 suggests that, for the cryoprotectant concentration and cooling rate range shown, growth during warming of nuclei formed on cooling produces much more ice than growth of nuclei formed on warming. With sufficiently large cooling rates, this should no longer be the case, and the CWR should asymptote to a minimum, cooling-rate-independent value (which of course will still depend upon the minimum detectable ice fraction.) These CWR values might then show simpler asymptotic variation to c=0 than is seen in Fig. 3. Achieving the required cooling rates, especially at smaller concentrations, may be difficult or impossible.
4.3 Excess of CWR over CCR
For the concentration ranges shown in Fig. 3, critical warming rates for all cryoprotectants examined are larger, by a factor of 10 to 1000, than the critical cooling rates for the same concentration. This difference can be explained by differences in ice crystal nucleation and growth. As shown in Fig. 6, on cooling from the liquid phase the probability per unit time of ice nucleation grows, reaching a maximum at some temperature below the homogeneous nucleation temperature. The final ice fraction within a sample then depends upon the number of nuclei formed and how much they grow before the temperature drops below the vitrification temperature. Growth rates decrease with decreasing temperature, and are small at temperatures comparable to and below that corresponding to the peak nucleation rate (e.g., as experimentally observed for glycerol and DMSO [29,30]). Consequently, on cooling only modest ice growth following nucleation occurs, and so relatively modest cooling rates are required to achieve small ice fractions.
On warming above the devitrification temperature, existing ice crystals can resume their growth, new crystals can nucleate and grow, larger crystals can grow at the expense of smaller ones (recrystallization), and growth can continue all the way up to the melting temperature. More nuclei combined with much larger growth rates at temperatures above that of the peak nucleation rate lead to much larger ice fractions for a given rate qw than on cooling. Critical warming rates to achieve a given ice fraction are thus much larger than the critical cooling rates of the same solution.
4.4 Predictions of critical warming rates based upon previous data
Differential scanning calorimetery has been used to measure the devitrification temperature Td and the melting temperature Tm of many aqueous solutions at small warming rates (~0.04 – 5 K/s). As the warming rate qw increases, Tm − Td decreases, and over the range of warming rates explored Tm − Td varies roughly linearly with log(1/qw) [2,3,5,8–12,14–17,44,45,58]. Ice formation on warming at a given rate is reduced if the difference between Td and Tm is small. By extrapolating the measured warming rate dependence of Tm − Td to an arbitrary threshold Tm − Td = 5 K, the critical warming rate was estimated.
A reformulation of this method used a critical ice fraction rather than a Tm −Td threshold to obtain improved, somewhat lower estimates of the CWR [16]. From measurements of the devitrification temperature at two different warming rates qw1 and qw2, the critical warming rate qw, crit was calculated as
| (15) |
Here Acrit corresponds to the ratio Td/Tm at the desired critical volume fraction of ice, and has usually been chosen to be 0.95. Predictions based upon data collected at warming rates between 0.04 and 5 K/s are available for glycerol [16], DMSO [2,14,16] and ethylene glycol [4,16,58], and are shown in Fig. 3(a), (b) and (c). These calculated rates are close to the measured ones at large concentrations, i.e., closer to the range explored in previous critical warming rate measurements. But at the smaller concentrations examined here, the predicted critical warming rates rapidly diverge above our measured values.
4.5 Predictions of critical warming and cooling rates based upon models of ice nucleation and growth
The predicted critical warming rates (using measured cooling rates) and the predicted critical cooling rates differ from the experimental results as shown in Figure 5, and are orders of magnitude larger than experiment at lower cryoprotectant concentrations. Since the predicted critical cooling rates are much larger than observed, the pre-existing ice fraction at the start of warming following cooling at a given rate should be overestimated, which should lead to an over-estimate (within the model) of the critical warming rate. Even a predicted lower bound on critical warming rates (assuming warming from an initially ice-free state) is far larger than experiment. As discussed in Section 3.2 differences between model predictions and experiment are relatively insensitive to differences between calculated and experimentally estimated ice fractions.
These very large differences between model predictions for CCRs and CWRs and experiment at lower concentrations could be due to flaws in the input parameters and/or in the model itself. Available data for water-glycerol solution viscosities only extend to ~240 K (−33°C)[55], and so extrapolations to lower temperatures may be in error. The non-Stokes-Einstein fragile to strong transition observed in the diffusion constant and assumed in our calculations is not well characterized in the presence of solutes [42], and may not exist at large concentrations [46]. However, simulations using the Stokes-Einstein diffusion relation using otherwise unchanged parameters resulted in a decrease in the predicted CCRs and an increase in the predicted CWRs by at most a factor of ~5. Critical cooling rates for water-glycerol mixtures predicted for the vitrification regime (where water transport across the cell membrane becomes unimportant) in Ref. [34], using a different viscosity model, are also orders of magnitude larger than experiment. Reasonable quantitative agreement between simulations using our original viscosity model and CCR data for glycerol concentrations below 40% w/w can be obtained by increasing the viscosity at all temperatures by a factor of 104, but we have no physical basis for this increase.
Classical nucleation theories typically yield reasonable estimates for the thermodynamic barriers to nucleation, but predicted nucleation rates are often off by many orders of magnitude due to challenges in correctly modeling nucleation kinetics. The nucleation model used here [54] has only been tested at small (~2 K/s) cooling rates, where ice forms at relatively high temperatures for which experiment-based estimates of model parameters are more accurate. The model has not been verified at large cooling rates, where large supercooling may occur before appreciable nucleation and growth, nor has it been verified during warming from the vitrified state. In addition, the model calculates steady state rates, which may not be appropriate for large cooling/warming rates and small samples. On abruptly cooling (or warming) to a given temperature the nucleation rate does not instantaneously reach the steady-state value, as time is required to establish the steady-state distribution of sub- and supercritical nuclei sizes [36]. Transient nucleation rates are smaller than steady-state nucleation rates [36], and so could result in smaller predicted critical cooling and warming rates in the low-concentration, high rate regime, closer to experiment. While a numerical calculation of the lag time of the transient nucleation rate in an aqueous solution is beyond the scope of this paper, we note that for some systems measured lag times are as large as 104 s [28] and that calculated lag times range from at least 10−7 [22] to 107 s [23]. A lag time of ~1 ms or greater would have an effect on our measured critical rates at low concentration.
The diffusion limited growth model [34,41] we use has not been verified at the large cooling and warming rates studied here, or at lower temperatures. In this model, the growth rate varies as t1/2, but measured isothermal growth rates in 50% glycerol solutions were time independent at temperatures lower than ~233 K (−40°C) [29]. At large supersaturations and large cooling and warming rates, transfer of latent heat from the phase boundary becomes a bottleneck and the assumption of local equilibrium may break down. Dendritic growth may then dominate [29]. Dendritic growth has been observed to be the primary mode of ice growth in solutions of ~20–60% glycerol at temperatures less than ~200 K (−73°C) [49].
4.6 Application to biological cryopreservation
The primary objective of the work presented here is to quantify fundamental aspects of ice formation in aqueous cryoprotectant solutions, especially in the largely unexplored regime of large warming rates. These results for two-component systems provide a basis for understanding the behavior of more complex systems.
What complications may arise in applying these results to cellular systems? Unlike at small cooling and warming rates, at high rates characteristic of vitrification procedures the effects of water transport across cell membranes and intracellular dehydration driven by extracellular ice nucleation can be neglected [31,34,59].
Nucleation and growth behavior may be different in the cellular environment. Some experiments on cellular solutions have been interpreted as providing evidence that ice forms by heterogeneous nucleation [25], while others suggest that cryoprotectants suppress heterogeneous nucleation so that homogeneous nucleation dominates [48]. These studies used small cooling rates (< 0.3 K/s), where there is ample time for heterogeneous nucleation before temperatures at which rapid homogeneous nucleation occurs are reached. At the much larger cooling and warming rates studied here, homogeneous nucleation should dominate, consistent with our high speed video observation that ice always first appeared in the bulk both on cooling and on warming.
Cellular components could also affect ice crystal growth and recrystallization rates. Our preliminary attempts to measure critical cooling and warming rates in aqueous solutions containing up to 50% w/w lysozyme suggest that soluble proteins are very poor cryoprotectants, as has been found in studies of ice formation in hydrated protein powders [50].
Consequently, at the large cooling and warming rates studied here, critical warming and cooling rates for cryoprotectant-containing cellular solutions may be similar to those obtained here for cell-free solutions.
5. Conclusions
The present work provides a more quantitative basis for rational selection of cryoprotectants for cryopreservation. We have measured critical warming rates for several cryoprotectants at rates up to three orders of magnitude larger than have been previously reported. For all cryoprotectants studied, measured critical warming rates are orders of magnitude larger than the critical cooling rates. For comparable rates, warming yields much larger maximum ice fractions than cooling. Consequently, an increase in warming rate has a much larger effect on maximum ice fraction in freeze-thaw cycles than a comparable increase in cooling rate. This is consistent with recent observations that warming rate is more important to biological survival than cooling rate [43,51,52].
Critical warming rates are also strongly dependent on cooling rates, and can be decreased by an order of magnitude or more by increasing cooling rates. Since maximum warming rates are limited by maximum tolerable sample temperatures, this suggests that samples should always be cooled at the maximum rate possible, and that maximizing both cooling and warming rates are necessary to minimize ice formation and required cryoprotectant concentrations.
Acknowledgments
We would like to acknowledge an anonymous reviewer, whose exceedingly thorough review of this paper led to important corrections in the modeling work. This work was supported by the NIH (R01 GM65981) and by the NSF (DMR-0805240). RET acknowledges a significant financial interest in MiTeGen, LLC which manufactured some of the tools used in this work.
Footnotes
Publisher's Disclaimer: This is a PDF file of an unedited manuscript that has been accepted for publication. As a service to our customers we are providing this early version of the manuscript. The manuscript will undergo copyediting, typesetting, and review of the resulting proof before it is published in its final citable form. Please note that during the production process errors may be discovered which could affect the content, and all legal disclaimers that apply to the journal pertain.
References
- 1.Banerjee D, Bhat SN, Bhat SV, Leporini D. Proc Natl Acad Sci U S A. 2009;106:11448–53. doi: 10.1073/pnas.0900734106. [DOI] [PMC free article] [PubMed] [Google Scholar]
- 2.Baudot A, Alger L, Boutron P. Cryobiology. 2000;40:151–158. doi: 10.1006/cryo.2000.2234. [DOI] [PubMed] [Google Scholar]
- 3.Baudot A, Cacela C, Duarte ML, Fausto R. Cryobiology. 2002;44:150–60. doi: 10.1016/s0011-2240(02)00017-2. [DOI] [PubMed] [Google Scholar]
- 4.Baudot A, Odagescu V. Cryobiology. 2004;48:283–94. doi: 10.1016/j.cryobiol.2004.02.003. [DOI] [PubMed] [Google Scholar]
- 5.Baudot A, Peyridieu JF, Boutron P, Mazuer J, Odin J. Cryobiology. 1996;33:363–375. doi: 10.1006/cryo.1996.0037. [DOI] [PubMed] [Google Scholar]
- 6.Berejnov V, Husseini NS, Alsaied OA, Thorne RE. J Appl Crystallogr. 2006;39:244–251. doi: 10.1107/S0021889806037484. [DOI] [PMC free article] [PubMed] [Google Scholar]
- 7.Bohon RL, Conway WT. Thermochim Acta. 1972;4:321–341. [Google Scholar]
- 8.Boutron P. Cryobiology. 1993;30:86–97. [Google Scholar]
- 9.Boutron P. Cryobiology. 1990;27:55–69. doi: 10.1016/0011-2240(90)90015-v. [DOI] [PubMed] [Google Scholar]
- 10.Boutron P, Delage D, Roustit B. J Chim Phys. 1980;77:567–570. [Google Scholar]
- 11.Boutron P, Delage D, Roustit B, Körber C. Cryobiology. 1982;19:550–64. doi: 10.1016/0011-2240(82)90184-5. [DOI] [PubMed] [Google Scholar]
- 12.Boutron P, Kaufmann A. Cryobiology. 1979;16:557–568. doi: 10.1016/0011-2240(79)90074-9. [DOI] [PubMed] [Google Scholar]
- 13.Boutron P, Kaufmann A. Cryobiology. 1979;16:83–89. doi: 10.1016/0011-2240(79)90015-4. [DOI] [PubMed] [Google Scholar]
- 14.Boutron P, Kaufmann A. Cryobiology. 1978;15:93–108. doi: 10.1016/0011-2240(78)90012-3. [DOI] [PubMed] [Google Scholar]
- 15.Boutron P, Kaufmann A, Dang NV. Cryobiology. 1979;16:372–389. doi: 10.1016/0011-2240(79)90050-6. [DOI] [PubMed] [Google Scholar]
- 16.Boutron P, Mehl P. Cryobiology. 1990;27:359–377. doi: 10.1016/0011-2240(90)90015-v. [DOI] [PubMed] [Google Scholar]
- 17.Boutron P, Mehl P, Kaufmann A, Angibaud P. Cryobiology. 1986;23:453–469. doi: 10.1016/0011-2240(86)90031-3. [DOI] [PubMed] [Google Scholar]
- 18.Brüggeller P, Mayer E. Nature. 1980;288:569–571. [Google Scholar]
- 19.Chen S-H, Mallamace F, Mou C-Y, Broccio M, Corsaro C, Faraone A, Liu L. Proc Natl Acad Sci U S A. 2006;103:12974–8. doi: 10.1073/pnas.0603253103. [DOI] [PMC free article] [PubMed] [Google Scholar]
- 20.Christian JW. The Theory of Transformations in Metals and Alloys. 2. 1975. [Google Scholar]
- 21.Debenedetti PG. J Phys: Condens Matter. 2003;25:R1669–R1726. [Google Scholar]
- 22.Demetriou MD, Ghoniem NM, Lavine AS. J Chem Phys. 2002;117:10739. [Google Scholar]
- 23.Demo P, Kozisek Z. Thermochem Acta. 1996;280/281:101–126. [Google Scholar]
- 24.Fowler A, Toner M. Ann N Y Acad of Sci. 2005;1066:119–135. doi: 10.1196/annals.1363.010. [DOI] [PubMed] [Google Scholar]
- 25.Franks F, Mathias SF, Galfre P, Webster SD, Brown D. Cryobiology. 1983;20:298–309. doi: 10.1016/0011-2240(83)90018-4. [DOI] [PubMed] [Google Scholar]
- 26.Fuller BJ. CryoLetters. 2004;25:375–388. [Google Scholar]
- 27.Gook DA. Reproductive BioMedicine Online. 2010. [Google Scholar]
- 28.Gutzow I, Schmelzer J, Dobreva A. J Non-Cryst Solids. 1997;219:1–16. [Google Scholar]
- 29.Hey JM, MacFarlane DR. Cryobiology. 1998;37:119–30. doi: 10.1006/cryo.1998.2108. [DOI] [PubMed] [Google Scholar]
- 30.Hey JM, MacFarlane DR. Cryobiology. 1996;33:205–216. doi: 10.1006/cryo.1996.0021. [DOI] [PubMed] [Google Scholar]
- 31.Karlsson JOM. Cryobiology. 2001;42:154–169. doi: 10.1006/cryo.2001.2318. [DOI] [PubMed] [Google Scholar]
- 32.Karlsson JOM. Cryobiology. 2010;60:43–51. doi: 10.1016/j.cryobiol.2009.07.004. [DOI] [PubMed] [Google Scholar]
- 33.Karlsson JOM, Cravalho EG, Borel Rinkes IHM, Tompkins RG, Yarmush ML, Toner M. Biophys J. 1993;65:2524–2536. doi: 10.1016/S0006-3495(93)81319-5. [DOI] [PMC free article] [PubMed] [Google Scholar]
- 34.Karlsson JOM, Cravalho EG, Toner M. J Appl Phys. 1994;75:4442–4455. [Google Scholar]
- 35.Karlsson JOM, Eroglu A, Toth TL, Cravalho EG, Toner M. Hum Reprod. 1996;11:1296–305. doi: 10.1093/oxfordjournals.humrep.a019375. [DOI] [PubMed] [Google Scholar]
- 36.Kelton KF, Greer aL, Thompson CV. The Journal of Chemical Physics. 1983;79:6261. [Google Scholar]
- 37.Kohl I, Bachmann L, Hallbrucker A, Mayer E, Loerting T. Phys Chem Chem Phys. 2005;7:3210–3220. doi: 10.1039/b507651j. [DOI] [PubMed] [Google Scholar]
- 38.Kraust GF, Greer SC. J Phys Chem. 1984;88:4781–4785. [Google Scholar]
- 39.Kresin M, Körber C. J Chem Phys. 1991;95:5249–5255. [Google Scholar]
- 40.Kriminski S, Kazmierczak M, Thorne RE. Acta Crystallogr Sect D: Biol Crystallogr. 2003;59:697–708. doi: 10.1107/s0907444903002713. [DOI] [PubMed] [Google Scholar]
- 41.MacFarlane DR, Fragoulis M. Phys Chem Glasses. 1986;27:228–234. [Google Scholar]
- 42.Mallamace F, Branca C, Corsaro C, Leone N, Spooren J, Stanley HE, Chen S-H. J Phys Chem B. 2010;114:1870–1878. doi: 10.1021/jp910038j. [DOI] [PubMed] [Google Scholar]
- 43.Mazur P, Seki S. Cryobiology. 2011;62:1–7. doi: 10.1016/j.cryobiol.2010.10.159. [DOI] [PMC free article] [PubMed] [Google Scholar]
- 44.Mehl P, Boutron P. CryoLetters. 1987;8:64–73. [Google Scholar]
- 45.Mehl PM. Thermochim Acta. 1993;226:325–332. [Google Scholar]
- 46.Nakanishi M, Griffin P, Mamontov E, Sokolov AP. J Chem Phys. 2012;136:124512. doi: 10.1063/1.3697841. [DOI] [PubMed] [Google Scholar]
- 47.Pereira RM, Marques CC. Cell Tissue Banking. 2008;9:267–277. doi: 10.1007/s10561-008-9075-2. [DOI] [PubMed] [Google Scholar]
- 48.Rall WF, Mazur P, McGrath JJ. Biophys J. 1983;41:1–12. doi: 10.1016/S0006-3495(83)84399-9. [DOI] [PMC free article] [PubMed] [Google Scholar]
- 49.Rapatz G, Luyet B. Biodynamica. 1966;10:69–80. [PubMed] [Google Scholar]
- 50.Sartor G, Hallbrucker A, Mayer E. Biophys J. 1995;69:2679–2694. doi: 10.1016/S0006-3495(95)80139-6. [DOI] [PMC free article] [PubMed] [Google Scholar]
- 51.Seki S, Mazur P. Biol Reprod. 2008;79:727–737. doi: 10.1095/biolreprod.108.069401. [DOI] [PMC free article] [PubMed] [Google Scholar]
- 52.Seki S, Mazur P. Cryobiology. 2009;59:75–82. doi: 10.1016/j.cryobiol.2009.04.012. [DOI] [PMC free article] [PubMed] [Google Scholar]
- 53.Sutton RL. Journal of the Chemical Society, Faraday Transactions. 1991;87:101. [Google Scholar]
- 54.Toner M, Cravalho EG, Karel M. J Appl Phys. 1990;67:1582–1593. [Google Scholar]
- 55.Trejo González JA, Longinotti MP, Corti HR. J Chem Eng Data. 2011;56:1397–1406. [Google Scholar]
- 56.Warkentin M, Berejnov V, Husseini NS, Thorne RE. J Appl Crystallogr. 2006;39:805–811. doi: 10.1107/S0021889806037484. [DOI] [PMC free article] [PubMed] [Google Scholar]
- 57.Warkentin M, Stanislavskaia V, Hammes K, Thorne RE. J Appl Crystallogr. 2008;41:791–797. doi: 10.1107/S0021889808018451. [DOI] [PMC free article] [PubMed] [Google Scholar]
- 58.Wowk B, Darwin M, Harris S, Russell S, Rasch C. Cryobiology. 1999;39:215–227. doi: 10.1006/cryo.1999.2203. [DOI] [PubMed] [Google Scholar]
- 59.Zhao G, Luo D, Gau D. AiChE J. 2006;52:2596–2606. [Google Scholar]
- 60.Zhmakin AI. Phys-Usp. 2008;51:231–252. [Google Scholar]