

Abstract
Background
Diffusion tensor imaging (DTI) has been used over the past decade to study structural differences in the brains of children with autism compared to typically developing children. These studies generally find reduced fractional anisotropy (FA) and increased mean diffusivity (MD) in children with autism, however the regional pattern of findings varies greatly.
Methods
We used DTI to investigate the brains of sedated children with autism (N=39) and naturally asleep typically developing children (N=39) between 2 and 8 years of age. Tract Based Spatial Statistics (TBSS) and whole brain voxel-wise analysis were performed to investigate the regional distribution of differences between groups.
Results
In children with autism, we found significantly reduced FA in widespread regions, and increased MD only in posterior brain regions. Significant age by group interaction was found, indicating a difference in developmental trends of FA and MD between children with autism and typically developing children. The magnitude of the measured differences between groups was small, on the order of ~1–2%. Subjects and controls showed distinct regional differences in imaging artifacts that can affect DTI measures.
Conclusions
We found statistically significant differences in DTI metrics between children with autism and typically developing children, including different developmental trends of these metrics. However, this study indicates that between-group differences in DTI studies of autism should be interpreted with caution, as their small magnitude make these measurements particularly vulnerable to the effects of artifacts and confounds, which may lead to false positive and/or false negative biological inferences.
Keywords: Autism, diffusion tensor imaging, MRI, white matter, fractional anisotropy, mean diffusivity
Introduction
Autism is a neurodevelopmental disorder defined by impairments in communication and social interaction, along with repetitive behaviors and restricted interests (1). Although research on autism has expanded in recent years, the neuropathology of the disorder remains poorly understood (2–3). A growing body of evidence suggests that autism is a disorder of neural connectivity (4–5). Functional magnetic resonance imaging (fMRI) and positron emission tomography (PET) studies demonstrate aberrant functional connectivity during rest (6), and during active tasks such as sentence comprehension (7), working memory (8–9), and attribution of mental states to animated shapes (10). Given that aberrant functional connectivity may result from pathology of the white matter axonal connections, the next logical step is to understand the underlying structural architecture of the brain’s white matter.
Diffusion tensor imaging (DTI) (11) is a magnetic resonance imaging (MRI) technique that allows in vivo investigation of compositional, microstructural, and architectural characteristics of tissues (12–13) and is currently the most common method for examining the architecture of white matter in the human brain. A number of DTI studies of autism with normal control comparisons have been published, which include a range of Autism Spectrum Disorders (ASD), including Autistic Disorder, Asperger Syndrome, and Pervasive Developmental Disorder-Not Otherwise Specified (PDD-NOS). Results vary widely across studies, for example, using voxel-wise analysis techniques, researchers found reduced FA in frontal and temporal white matter in children with high functioning autism (HFA) (14–15), reduced FA within and near the corpus callosum and internal capsule in a group of individuals with HFA that span childhood through adulthood (16), and widespread reductions in FA throughout the white matter in a group of children with ASD (17). Using a volume-of-interest approach, reductions in FA were found in the corpus callosum (18), and the superior temporal gyrus and temporal stem (19) of children and young adults with autism and PDD-NOS. Tractography studies found reduced FA in the frontal lobe of children with ASD (20), and the cerebellum of adults with Asperger syndrome (21). Using multiple techniques, reduced FA was found in the uncinate fasciculus, arcuate fasciculus, cingulum and corpus callosum in young children with ASD (22). A few studies have found increased FA in children and adolescents with ASD (23–25). MD is less frequently reported, however, studies mainly found either no difference or higher MD in subjects with autism compared to typically developing in a variety of brain regions (26–28), although some find reduced MD in autism (29). The subject demographics, analysis approach and overall results of these studies are summarized in Table 1.
Table 1.
Summary of relevant literature on DTI and Autism, including results of FA and MD differences in children with autism compared to typically developing children, and a listing of brain regions where statistically significant differences were found. Please note that some studies looked at the whole brain, while others targeted specific regions, thus, reported regions should be interpreted taking into account the analysis method used.
| First Author (Reference) | Year | Diagnosis | Analysis Method | N | Age Range/Mean (years) | Result | Affected Brain Regions | |||
|---|---|---|---|---|---|---|---|---|---|---|
|
| ||||||||||
| AUT | TYP | AUT | TYP | FA | MD | |||||
| Bashat (23) | 2007 | Autism | ROI | 7 | 41 | 1.8–3.3 | 0.25–23 | ↓, ↑ | NR | cst, cc, plic, ec |
| Weinstein (25) | 2011 | Autism | TBSS, ROI, Tract | 22 | 32 | 1.5–5.8 | 1.5–5.8 | ↑ | NS | cc, sfl, cg |
| Sundaram (20) | 2008 | ASD | Tract | 50 | 16 | 4.79 | 6.84 | ↓ | ↑ | frontal |
| Jeong (53) | 2011 | ASD | Tract | 32 | 14 | 4.9 | 5.6 | ↓ | NR | af, uf, cc |
| Kumar (22) | 2010 | ASD | TBSS | 32 | 16 | 2.5–8.9 | 2.5–8.6 | ↓ | ↑ | uf, af, cc, cg, ifo |
| Mengotti (29) | 2011 | Autism | ROI | 20 | 22 | 4–14 | 4–11 | NR | ↑, ↓ | frontal, cc |
| Peters (28) | 2012 | TSC | Tract | 40 | 29 | 0.5–25 | 0.9–25 | ↓ | ↑ | cc |
| Hong (65) | 2011 | HFA | Tract | 18 | 16 | 8.69 | 9.81 | NS | ↑ | cc |
| Ke (15) | 2009 | HFA | SPM | 12 | 10 | 8.75 | 9.4 | ↓ | NR | frontal, stg |
| Barnea-Goraly (30) | 2010 | ASD | TBSS | 13 | 11 | 10.5 | 9.6 | ↓ | NR | widespread WM |
| Jou (17) | 2011 | ASD | TBSS | 15 | 8 | 4.9–17.0 | 8.9–16.7 | ↓ | NR | widespread WM |
| Cheon (34) | 2011 | HFA | TBSS | 17 | 17 | 8–14 | 8–14 | ↓ | ↑ | uf, ilf, cc, thal |
| Shukla (27) | 2010 | ASD | ROI | 26 | 24 | 9–18 | 9–19 | ↓ | ↑ | cc, ic, mcp |
| Shukla (55) | 2011 | ASD | TBSS | 26 | 24 | 9–18 | 9–19 | ↓ | ↑ | frontal, temporal, parietal |
| Shukla (32) | 2011 | ASD | TBSS | 26 | 24 | 9–20 | 9–19 | ↓ | ↑ | widespread WM |
| Cheng (31) | 2010 | ASD | TBSS | 25 | 25 | 10–18 | 10–18 | ↓, ↑ | NR | widespread WM |
| Noriuchi (33) | 2010 | HFA | SPM | 7 | 7 | 11–18 | 11–18 | ↓ | NR | cc, cg, slf, dlpfc, amyg, temporal |
| Fletcher (66) | 2010 | HFA | VOI | 10 | 10 | 11–17 | 11–16 | NS | ↑ | af |
| Groen (26) | 2011 | HFA | SPM | 17 | 25 | 12–18 | 12–18 | ↓ | ↑ | widespread WM |
| Barnea-Goraly (14) | 2004 | HFA | SPM | 7 | 9 | 14.6 | 13.4 | ↓ | NR | cc, cg, fontal, temporal, amyg |
| Bode (24) | 2011 | HFA | TBSS | 27 | 26 | 11.4–17.6 | 11.7–17.3 | ↑ | NS | or, ifo |
| Alexander (18) | 2007 | ASD | ROI | 43 | 34 | 7–33 | 8–29 | ↓ | ↑ | cc |
| Lee (19) | 2007 | ASD | ROI | 43 | 34 | 7–33 | 8–29 | ↓ | ↑ | stg, ts |
| Keller (16) | 2007 | HFA | SPM | 34 | 31 | 10–35 | 10–35 | ↓ | NR | cc, ec |
| Pardini (67) | 2009 | LFA | SPM, Tract | 10 | 10 | 18–27 | 18–26 | ↓ | NR | ofc, uf |
| Thakkar (68) | 2008 | ASD | ROI | 12 | 14 | 30 | 27 | ↓ | NR | acc |
| Catani (21) | 2008 | Asperger | Tract | 15 | 16 | 18–49 | 18–49 | ↓ | NS | scp, cerebellum |
AUT, autism; TYP, typical development; FA, fractional anisotropy; MD, mean diffusivity; ASD, autism spectrum disorders; HFA, high functioning autism; LFA, low functioning autism; TSC, tuberous sclerosis complex; TBSS, tract based spatial statistics; ROI, region of interest; SPM, statistical parametric mapping; Tract, Tractography; VOI, volume of interest; NR, not reported; NS, reported as non-significant; ↓, reduced in AUT compared to TYP; ↑, increased in AUT compared to TYP; cst, cortico-spinal tract; cc, corpus callosum; plic, posterior limb of the internal capsule; ec, external capsule; cg, cingulum; slf, superior longitudinal fasciculus; af, arcuate fasciculus; uf, uncinate fasciculus; ifo, inferior fronto-occipital fasciculus; stg, superior temporal gyrus; ts, temporal stem; icp, inferior cerebellar penduncle; mcp, middle cerebellar peduncle; thal, thalamic radiation; ilf, inferior longitudinal fasciculus; ic, internal capsule; amyg, amygdale; dlpfc, dorsolateral prefrontal cortex; or, optic radiation; ofc, orbitofrontal cortex; acc, anterior cingulate cortex; scp, superior cerebellar peduncle;
Although the variability in methods used (voxel-wise, volume-of-interest, and/or tractography) and differences in participants’ characteristics (age, sex, and/or diagnosis) across studies limits direct comparison, the majority of works found reduced FA and increased MD in children and adults with ASD, but the regional pattern of findings is heterogeneous. While some regions were identified as having statistically significant differences of FA across multiple studies, few if any regions were reproduced in all studies. For example, multiple studies identified differences in the internal capsule (17, 23, 27, 30–32), external capsule (16–17, 30), superior temporal gyrus (15, 17, 19, 30–31), amygdala (14, 30, 33), and thalamus/thalamic radiation (17, 32, 34), without consensus. There is also no apparent pattern of regional differences based on age. For example, the corpus callosum was found to have a statistically significant difference of FA in studies spanning all ages, and across various ASD diagnoses. Yet others did not find it to be different (15, 24, 26, 31). Furthermore, while regional patterns may exist based on other characteristics such as severity of symptoms, cognitive skills, and at younger ages, there are insufficient studies examining these factors to make meaningful inferences.
In this work we used DTI to investigate differences between brains of a large sample of children aged 2 – 8 years, who met full diagnostic criteria for autism, and an age and gender matched sample of typically developing children. Voxel-wise analyses were performed with typical methods (35) for comparison with literature data, along with comparative analysis of average brain white matter morphology between groups (36). The goal of this work is to characterize the regional distribution of differences in the brains of children with autism compared to typically developing in an age range that is under-reported in the literature. We also comment on the influence of confounds in DTI data and their potential impact on results of clinical DTI analyses.
Methods and Materials
Subject groups are composed of 39 children who met DSM-IV criteria for autism (1) and 39 typically developing children. Demographic and diagnostic information are provided in Table 2. Parents of all participating subjects provided written informed consent for study participation, which was approved by the National Institutes of Health (NIH) Combined Neurosciences Institutional Review Board.
Table 2.
Demographics of the subject groups, including age, gender, handedness, race, and results of behavioral tests.
| Characteristic | TYP N=39 | AUT N=39 | Significance |
|---|---|---|---|
| Male/Female | 26 / 13 | 28 / 11 | .624 |
| Age (years), Mean ± SD | 4.74 ± 1.76 | 4.63 ± 1.76 | .783 |
| Age Range (years) | 2.02 – 8.09 | 2.19 – 8.72 | |
| Handedness, left / right / both / n/a | 2 / 28 / 5 / 4 | 4 / 16 / 8 / 11 | |
|
| |||
| Race | |||
| White | 31 | 28 | |
| Black or African American | 3 | 7 | |
| Asian | 2 | 2 | |
| Multiple Races | 3 | 1 | |
| Unknown | 0 | 1 | |
|
| |||
| Behavioral Measures (Mean ± SD) | |||
| Nonverbal DQ | 113.11 ± 16.07 | 60.97 ± 18.90 | <0.000001* |
| Nonverbal DQ Range | 88.82 – 150.00 | 32.79 – 109.18 | |
| ADOS Social Affect | 0.86 ± 1.03 | 14.22 ± 2.97 | <0.000001* |
| ADOS Restricted/Repetitive Behavior | 0.53 ± 0.77 | 5.49 ± 1.79 | <0.000001* |
indicates significant difference between groups.
AUT, autism; TYP, typically developing; DQ, developmental quotient; ADOS, Autism Diagnostic Observation Schedule; n/a, handedness not established.
Children with autism (AUT) were included after an evaluation consisting of research-reliable administrations of the Autism Diagnosis Interview-Revised (ADI-R) (37), the Autism Diagnostic Observation Schedule (ADOS) (38), and clinical judgment of a best estimate diagnosis by qualified doctoral level clinicians at the NIH. Typically developing children (TYP) were assessed using cognitive measures, administration of the ADOS, and parent-report questionnaires such as the Social Communication Questionnaire (39) and the Child Behavior Checklist (40). TYP exclusion criteria included the presence of any cognitive impairments or signs of an autism spectrum disorder, or a history of a substantial medical, neurological, or developmental disorder. Children’s nonverbal developmental quotients (DQ) were estimated on the basis of age- and developmentally-appropriate cognitive/developmental tests (Mullen Scales of Early Learning (MSEL) (41) or Differential Ability Scales, Second Edition (DAS) (42)).
AUT were scanned under sedation using propofol and TYP were scanned during natural sleep, without sedation, on a 1.5T GE scanner (General Electric, Milwaukee, Wisconsin) with an eight channel head coil. DTI data were acquired using single shot, spin-echo, echo-planar imaging (EPI) with 2.5mm isotropic voxels (TE/TR ~ 84.5/21330ms). DTI datasets consisted of 80 imaging volumes: 50 independent gradient directions at b=1100s/mm2, 10 directions at b=300s/mm2, and 10 non-diffusion weighted images (b=0s/mm2). At the beginning of the study a longer protocol was used with a larger number of intermediate b-values. Both protocols were found to be equivalent in quality. Diffusion weighted images went through a comprehensive correction pipeline using TORTOISE (43), which registers the volumes of a DTI dataset to reduce the effects of motion, eddy current distortions (44) and EPI distortions (45). Corrections were performed in the native space of each subject, and appropriate rotations were applied to the b-matrix (44, 46). More details about the scanning protocol and correction pipeline are provided in the supplemental methods.
Following corrections, RESTORE robust tensor fitting (47) was used to estimate the diffusion tensor and tensor derived metrics. RESTORE was selected for its ability to detect and remove artifactual data points on a voxel-wise basis, correcting for subtle artifacts such as cardiac pulsation and respiration signal drop-outs, which has been shown to be an important consideration in clinical population analyses of DTI data (48). In this study we focus on analyses of FA and MD, and also report results of axial and radial diffusivities (AD, RD).
Voxel-wise analysis was performed using Tract Based Spatial Statistics (TBSS) (35), with statistics computed only in the voxels of the white matter skeleton (FA > 0.2). Images were registered to the FMRIB58_FA standard space template. Permutation based nonparametric statistics (Randomise (49), FSL (50)) were used with 10,000 permutations, controlling for age by using it as a covariate in the model, with threshold free cluster enhancement (TFCE), and corrected for multiple comparisons with family wise error correction (FWE-corrected, p < 0.05).
TBSS analysis is by design limited to only the most central portion of the white matter tracts (the white matter skeleton). In order to assess the whole brain, tensor based registration was used to register the diffusion tensors from all children, AUT and TYP, into a common space using DTI-TK (36, 51). This type of registration uses the directional information of the diffusion tensor to align all subjects’ data with a high level of agreement. Randomise (49) was used on the DTI-TK registered images to perform voxel-wise statistics in the whole brain, using TFCE optimized for 3D data.
In addition to whole brain voxel-wise analysis, population average tensors were created from the DTI-TK registered tensors for each group. Subtraction maps were then computed for average FA and MD to assess the magnitude of the between-group differences both visually and quantitatively, using regions of interest (ROIs). See the supplemental methods for details on ROI placement.
Results
TBSS Analysis
TBSS analysis found lower FA in AUT compared to TYP throughout the white matter including but not limited to the cerebellum, gCC, sCC, body of the corpus callosum, corticospinal tract, pons, PLIC, left superior temporal gyrus, superior-anterior, and temporal-parietal regions (Figure 1A). MD was greater in AUT compared to TYP in most white matter regions, but only in the posterior half of the brain (Figure 1B). Both AD and RD were greater in AUT compared to TYP, with a pattern that closely matches the MD findings.
Figure 1.

Results of TBSS analysis of A) FA and B) MD overlaid on mean FA and MD computed from all subjects. Differences between AUT and TYP were observed in widespread regions of FA, and large clusters predominantly in posterior regions of MD. Statistically significant voxels are displayed in red; white matter skeleton voxels are displayed in green. Significance threshold was set at p<0.05 corrected for multiple comparisons using FWE, and controlled for age. FA, fractional anisotropy; FWE, family wise error; MD, mean diffusivity; TBSS, tract based spatial statistics
In addition to group differences, an age by group interaction was found throughout the white matter. This includes nearly all (>99%) of voxels found to have statistically significant group difference of FA and MD, and many more (Figure 2). The age interaction indicates that FA increases with age in both groups, but increases faster in TYP than in AUT, while MD and RD decrease with age in both groups, but decrease faster in AUT than in TYP. AD results also closely matched the MD results with the exception of superior-anterior regions, where AD decreases faster in TYP. Note again the fewer significant voxels observed in the superior-anterior portions of the brain. Average developmental trends of FA and MD in all statistically significantly different voxels are shown in Figure 2, and selected regional plots are provided in supplemental Figures S1 and S2.
Figure 2.

Age by group interaction for A) FA and B) MD from TBSS analysis, overlaid on mean FA and MD computed from all subjects. FA increases with age in both groups, but increases faster in TYP than in AUT, while MD decreases with age in both groups, but decreases faster in AUT than in TYP. Trends are demonstrated in plots of the average of all significant voxels of FA and MD versus age respectively. AUT, autism; TYP, typical development; FA, fractional anisotropy; MD, mean diffusivity; TBSS, tract based spatial statistics
Whole Brain Statistical Analysis
Statistical analysis of DTI-TK registered data revealed similar findings of reduced FA and increased MD in AUT, but with some marked differences compared to the TBSS results. Regions with reduced FA were in similar locations as those from the TBSS analysis, but largely failed to reach statistical significance. In addition, FA was found to be greater in AUT than TYP in a small cluster in the cerebellum. Also similar to TBSS results, MD was greater in AUT than TYP with large clusters in inferior-posterior areas of the brain, but none in the anterior-superior areas. These clusters extend beyond the white matter to include large portions of cortical gray matter and thalamus. In a small superior-anterior cortical area MD was greater in TYP than AUT (supplemental Figure S3).
Age by group interaction was observed in large portions of the brain parenchyma (Figure 3). FA increases faster in TYP than AUT in many white matter structures, and also in the basal ganglia. In the cerebellum FA increases faster in TYP, but the trajectory is relatively flat with age in AUT. For MD, the age interaction was more of a global effect, including much of the sub-cortical white matter and cortical gray matter in the posterior portions of the brain, with MD decreasing faster in AUT than TYP. Again, a difference between superior-anterior and inferior-posterior portions of the brain was present.
Figure 3.

Age by group interaction for A) FA and B) MD from whole brain analysis, overlaid on mean FA and MD computed from all subjects. Red voxels indicate regions where metrics are greater in TYP than AUT, and blue voxels indicate regions where metrics are greater in AUT than TYP. Plots for red and blue voxels are presented to demonstrate average trends with age. AUT, autism; TYP, typical development; FA, fractional anisotropy; MD, mean diffusivity
Whole Brain Average Morphology
Average directionally encoded color (DEC) (52), FA and MD maps from the AUT and TYP groups are strikingly similar when viewed qualitatively (supplemental Figure S4). Subtraction of average FA and MD (AUT minus TYP) show very small magnitude differences between groups (supplemental figure S5). ROI analysis revealed differences of average FA and MD of about 1–2% between AUT and TYP (supplemental Table S1).
Impact of Artifacts
The curious pattern of MD differences between superior-anterior and inferior-posterior regions suggest that an artifact or confound without anatomical origin may be impacting the MD findings of this study. This was hypothesized because of the abrupt border between statistically significant and non-significant voxels (Figure 1) which does not coincide with anatomical structures. One of the outputs of RESTORE is a map of the artifactual voxels detected in the diffusion weighted images (DWIs) of each dataset. A pattern of artifacts not conforming to the expected distribution (48) was detected in 6 subjects: 5 TYP and 1 AUT. This pattern includes a large number of artifactual voxels in superior-anterior regions of the brain (Supplemental Figure S7). We computed the average distribution of artifactual voxels for AUT and TYP groups and present the subtraction of these maps (AUT minus TYP) in Figure 4. The subtraction shows a different pattern of artifacts in each population, with a greater overall incidence of artifacts in the AUT group, particularly in the cerebellum, and in the TYP group a greater incidence of artifacts in superior-anterior and temporal regions.
Figure 4.
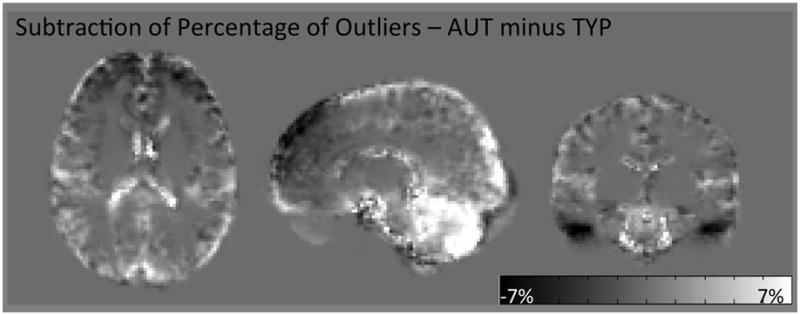
Subtraction of maps of the average distribution of artifactual data points (AUT minus TYP). Bright voxels indicate a higher incidence of artifacts in AUT, dark voxels indicate a higher incidence of artifacts in TYP, and gray (background) voxels are exactly equal to zero. Note the distinctly different distribution of artifacts between groups, with greater incidence in the cerebellum for AUT, and greater incidence in superior-anterior and temporal regions in TYP. AUT, autism; TYP, typically developing; FA, fractional anisotropy; MD, mean diffusivity
Discussion
Investigation of DTI data revealed widespread differences of FA and MD in brain parenchyma of a group of young children who met full diagnostic criteria for autism (AUT) compared to typically developing children (TYP), with a predominant pattern of reduced FA and increased MD in AUT.
Only two other DTI studies of ASD coincide closely with our age range (22, 53). These studies similarly find reduced FA and increased MD in AUT compared to TYP. Regionally, our study is generally consistent with these studies, but also implicates more widespread regions. At our age range and older, most studies have also reported reduced FA and increased MD in ASD, however, the regions affected are inconsistent across studies. For instance, some report findings in isolated regions (26) while others report widespread differences (27, 30). This discrepancy in regional pattern has led different studies to propose various interpretations of physiology and behavior. Differences in the frontal lobes were attributed to functional deficits in social cognition (15, 22), differences in temporal regions are linked to socio-emotional and language deficits (17, 22), and differences in the corpus callosum are purported to reflect non-verbal cognition (18), or repetitive behavior (54), amongst other interpretations. The widespread regional distribution of differences found in this work favor an interpretative hypothesis of global differences, similar to the findings of Shukla, et al. (27, 32, 55), with no specificity to any one brain “network”.
In addition to group differences in mean value of tensor derived metrics, we found significant age by group interactions in the brain parenchyma, with anisotropy increasing with age and diffusivity decreasing with age, but at different rates for the two groups. Moreover, as demonstrated in supplemental Figures S1–S2, the trends are regionally dependent. For example, trends in the gCC and sCC are fairly flat over our age range in contrast to regions such as the PLIC. This is in agreement with previous studies in healthy children (56–57), where FA and MD values in the corpus callosum generally plateau earlier in development, and may not be well modeled by linear regression in our age range. Interestingly, studies in very young subjects have shown the opposite trend; mainly increased FA and non-significant MD findings in ASD (23, 25). The different trends with age between groups observed in this work suggest that the difference of FA between AUT and TYP is less pronounced at younger ages, and increases with age. One could hypothesize that the developmental trends of FA may cross at ages younger than were included in this study, resulting in a reversal of the trends of FA at an earlier developmental stage. In support of this hypothesis, a recent longitudinal DTI study of autism showed differential developmental trajectories of FA, with an average cross-over of the trajectories occurring between 6 and 16 months of age, depending on the region (58). In addition to DTI findings, atypical brain volume growth patterns have been previously reported in autism (59), with a specific indication of early over-growth in the first year of life (60). Given the crucial role that neurodevelopment plays in the pathophysiology and clinical presentation of autism, abnormalities in developmental trajectories are potentially more interesting and informative than the absolute differences of tensor derived metrics, and deserves further study, including longitudinal investigations of large groups of children with autism and children with typical development followed from early childhood through the key developmental ages.
Although significant group differences in DTI metrics were found, it is important to note that the difference in measured FA and MD values between groups is modest, on the order of ~1–2%. A close review of studies that include regional mean and standard deviation values also suggest that group differences are small (17, 19, 22, 25). We notice substantial overlap in the distribution of the values of DTI metrics between groups. Although not explicitly mentioned in previous works that present scatter plots of diffusion metrics (16, 28, 32), overlap can also be noticed in their data. Examination of the overlap and spread of data in the scatter plots suggests that many of the AUT subjects cannot be distinguished from TYP subjects based on the value of DTI metrics alone. However, a small subset of AUT subjects are further removed from the TYP subjects, thereby driving the statistically significant differences detected in this work. This fact suggests a potential biological heterogeneity of the brains of children with autism, even within a diagnostically homogenous group.
The small magnitude of between-group differences has potential repercussions on the analysis and interpretation of DTI data. The primary concern is that experimental artifacts or other confounding factors may affect the AUT and TYP groups differently, such that an experimental confound of large magnitude might overshadow smaller differences of biological origin or even create false positive findings. We found a spatial distribution of statistical significance in MD that suggests the presence of this phenomenon in our data. Specifically, MD was significantly greater in AUT than TYP in the inferior-posterior regions of the brain, was not significantly different in a middle band, and finally was significantly greater in TYP than AUT in the superior-anterior region of the brain (Figure 3). Based on consistency with previous literature, we believe that the finding in the posterior region has biological origin, but that artifacts have destroyed significance in the middle regions of the brain, and produced false positive results in the superior-anterior region. In fact, motion artifacts in the DWI data were more pronounced specifically in the superior-anterior regions in TYP subjects.
The different pattern of artifacts for the two groups could be attributed to the fact that AUT were scanned under sedation, while TYP were scanned during natural sleep. The un-sedated typically developing children were more likely to move during the scan than the sedated children with autism. Given the recent fMRI results showing a significant confound of motion on resting state fMRI results primarily in the frontal lobes (61), this may be consistent with the observed greater incidence of artifacts in superior-anterior regions for TYP.
Additionally, sedation may result in altered patterns of physiological noise, i.e. a systematically different heart rate and breathing pattern, compared to non-sedated subjects. These types of artifacts are known to have a regionally varying effect on DTI data, with predominant effects in the cerebellum (48, 62). While RESTORE tensor fitting used in this study is intended to correct for artifacts such as physiological noise on a voxel-wise basis, the algorithm may break down in cases where the number of artifactual voxels is greater than the number of good ones (47). Thus, this analysis contains an example of correctable artifacts (i.e. cerebellum) and uncorrectable artifacts (i.e. superior-anterior).
While DTI is a promising method for revealing anatomic abnormalities in the brains of subjects with autism, caution must be exercised in interpreting between-group differences. Because of the consistent nature of findings of reduced FA and increased MD in the literature, and replicated in our work, the results of this study are likely related to between-group differences with a biological origin, perhaps related to a fundamental difference in underlying brain structure between autism and typical development. Due to the small magnitude of these differences, however, these particular measures are unlikely to be useful biomarkers for single subject diagnoses. Further, the lack of reproducible regional findings across studies implies that specifics of analysis method, group size, and sample heterogeneity are likely to play a role in the particular regions identified by a study. Indeed, in this work, the use of two slightly different approaches to data analysis (TBSS and whole brain voxel-wise analysis) resulted in very different levels of statistically significant differences in FA; the pattern of between-group differences remained the same, but with TBSS the results reached significance thresholds, while only a few voxels reached this same threshold with whole brain analysis. This difference may be due simply to strict penalties incurred for increased multiple comparisons. If differences between these groups are truly widespread, hypothesis driven studies that focus on searching for differences in a few specific regions may not be the correct approach. In fact, these studies, which are intrinsically more powerful than whole brain voxel-wise analyses, may lead to the false conclusion that the specific region(s) tested is uniquely implicated in autism.
Finally, one may question the histopathological underpinnings of the FA and MD differences observed between AUT and TYP. It is tempting to attribute these differences to a specific biological feature of the brain, but unfortunately, without independent histological validation this type of inference is rarely warranted from DTI data. In the literature, FA differences are frequently reported as an indication of “white matter integrity”. Although white matter disruption may result in reduced diffusion anisotropy, equating FA to a specific measure of integrity of white matter is misleading. For example, in healthy white matter the underlying organization of fibers heavily influences the value of anisotropy, i.e. the more coherent the fiber organization, the higher the measured value of FA (12). In regions with complex white matter architecture, FA may even paradoxically increase following white matter degeneration (63). More recently, it was shown that FA values increased in perilesioned cortex following traumatic brain injury in a rat model because of organized gliosis, not axonal regeneration (64). In healthy white matter, diffusion anisotropy is known to increase during post-natal maturation (53), although the relative importance of each specific maturational process, i.e. change in the size of the extracellular space, composition of the extracellular matrix, and degree of myelination, in driving the FA increase is not clear. MD generally decreases during post-natal maturation. On the other hand, degenerative processes also often result in reduced FA and increased MD. Given these considerations, our finding of reduced FA and increased MD in AUT cannot be attributed to a single biological factor. Because the FA and MD changes are widespread, the abnormality does not seem to involve any one specific brain structure. However, this pattern could be consistent with global differences in the level of tissue maturity between groups, abnormal maturation or degenerative processes.
Supplementary Material
Acknowledgments
The authors wish to thank Madison Berl for her advice and insights in the interpretation of the statistical analysis. This data was previously published in abstracts at the International Society for Magnetic Resonance in Medicine (ISMRM), Melbourne, Australia, 2012, and the International Meeting for Autism Research (IMFAR), Toronto, Ontario, Canada, 2012. This research was supported by the Intramural Research Programs of the Eunice Kennedy Shriver National Institute of Child Health and Human Development (NICHD), and the National Institute of Mental Health (NIMH), National Institutes of Health (NIH). Support for this work included funding from the Department of Defense through the Center for Neuroscience and Regenerative Medicine (CNRM). The authors would also like to thank the Henry M. Jackson Foundation (HJF) for their administrative support.
Footnotes
Disclaimer: The views herein do not necessarily represent the official views of the National Institute of Child Health and Human Development, the NIH, the US Department of Health and Human Services, or any other agency of the US Government.
Financial Disclosures
The authors report no biomedical financial interests or potential conflicts of interest.
Publisher's Disclaimer: This is a PDF file of an unedited manuscript that has been accepted for publication. As a service to our customers we are providing this early version of the manuscript. The manuscript will undergo copyediting, typesetting, and review of the resulting proof before it is published in its final citable form. Please note that during the production process errors may be discovered which could affect the content, and all legal disclaimers that apply to the journal pertain.
References
- 1.APA. Diagnostic and Statistical Manual of Mental Disorders. 4. Washington, DC: American Psychiatric Association; 2000. [Google Scholar]
- 2.Casanova MF. The neuropathology of autism. Brain Pathol. 2007;17:422–433. doi: 10.1111/j.1750-3639.2007.00100.x. [DOI] [PMC free article] [PubMed] [Google Scholar]
- 3.Schmitz C, Rezaie P. The neuropathology of autism: where do we stand? Neuropathol Appl Neurobiol. 2008;34:4–11. doi: 10.1111/j.1365-2990.2007.00872.x. [DOI] [PubMed] [Google Scholar]
- 4.Minshew NJ, Williams DL. The new neurobiology of autism: cortex, connectivity, and neuronal organization. Arch Neurol. 2007;64:945–950. doi: 10.1001/archneur.64.7.945. [DOI] [PMC free article] [PubMed] [Google Scholar]
- 5.Muller RA, Shih P, Keehn B, Deyoe JR, Leyden KM, Shukla DK. Underconnected, but how? A survey of functional connectivity MRI studies in autism spectrum disorders. Cereb Cortex. 2011;21:2233–2243. doi: 10.1093/cercor/bhq296. [DOI] [PMC free article] [PubMed] [Google Scholar]
- 6.Cherkassky VL, Kana RK, Keller TA, Just MA. Functional connectivity in a baseline resting-state network in autism. Neuroreport. 2006;17:1687–1690. doi: 10.1097/01.wnr.0000239956.45448.4c. [DOI] [PubMed] [Google Scholar]
- 7.Just MA, Cherkassky VL, Keller TA, Minshew NJ. Cortical activation and synchronization during sentence comprehension in high-functioning autism: evidence of underconnectivity. Brain. 2004;127:1811–1821. doi: 10.1093/brain/awh199. [DOI] [PubMed] [Google Scholar]
- 8.Luna B, Minshew NJ, Garver KE, Lazar NA, Thulborn KR, Eddy WF, et al. Neocortical system abnormalities in autism: an fMRI study of spatial working memory. Neurology. 2002;59:834–840. doi: 10.1212/wnl.59.6.834. [DOI] [PubMed] [Google Scholar]
- 9.Koshino H, Carpenter PA, Minshew NJ, Cherkassky VL, Keller TA, Just MA. Functional connectivity in an fMRI working memory task in high-functioning autism. Neuroimage. 2005;24:810–821. doi: 10.1016/j.neuroimage.2004.09.028. [DOI] [PubMed] [Google Scholar]
- 10.Castelli F, Frith C, Happe F, Frith U. Autism, Asperger syndrome and brain mechanisms for the attribution of mental states to animated shapes. Brain. 2002;125:1839–1849. doi: 10.1093/brain/awf189. [DOI] [PubMed] [Google Scholar]
- 11.Basser PJ, Mattiello J, LeBihan D. Estimation of the effective self-diffusion tensor from the NMR spin echo. J Magn Reson B. 1994;103:247–254. doi: 10.1006/jmrb.1994.1037. [DOI] [PubMed] [Google Scholar]
- 12.Pierpaoli C, Basser PJ. Toward a quantitative assessment of diffusion anisotropy. Magn Reson Med. 1996;36:893–906. doi: 10.1002/mrm.1910360612. [DOI] [PubMed] [Google Scholar]
- 13.Pierpaoli C, Jezzard P, Basser PJ, Barnett A, Di Chiro G. Diffusion tensor MR imaging of the human brain. Radiology. 1996;201:637–648. doi: 10.1148/radiology.201.3.8939209. [DOI] [PubMed] [Google Scholar]
- 14.Barnea-Goraly N, Kwon H, Menon V, Eliez S, Lotspeich L, Reiss AL. White matter structure in autism: preliminary evidence from diffusion tensor imaging. Biol Psychiatry. 2004;55:323–326. doi: 10.1016/j.biopsych.2003.10.022. [DOI] [PubMed] [Google Scholar]
- 15.Ke X, Tang T, Hong S, Hang Y, Zou B, Li H, et al. White matter impairments in autism, evidence from voxel-based morphometry and diffusion tensor imaging. Brain Res. 2009;1265:171–177. doi: 10.1016/j.brainres.2009.02.013. [DOI] [PubMed] [Google Scholar]
- 16.Keller TA, Kana RK, Just MA. A developmental study of the structural integrity of white matter in autism. Neuroreport. 2007;18:23–27. doi: 10.1097/01.wnr.0000239965.21685.99. [DOI] [PubMed] [Google Scholar]
- 17.Jou RJ, Mateljevic N, Kaiser MD, Sugrue DR, Volkmar FR, Pelphrey KA. Structural neural phenotype of autism: preliminary evidence from a diffusion tensor imaging study using tract-based spatial statistics. AJNR Am J Neuroradiol. 2011;32:1607–1613. doi: 10.3174/ajnr.A2558. [DOI] [PMC free article] [PubMed] [Google Scholar]
- 18.Alexander AL, Lee JE, Lazar M, Boudos R, DuBray MB, Oakes TR, et al. Diffusion tensor imaging of the corpus callosum in Autism. Neuroimage. 2007;34:61–73. doi: 10.1016/j.neuroimage.2006.08.032. [DOI] [PubMed] [Google Scholar]
- 19.Lee JE, Bigler ED, Alexander AL, Lazar M, DuBray MB, Chung MK, et al. Diffusion tensor imaging of white matter in the superior temporal gyrus and temporal stem in autism. Neurosci Lett. 2007;424:127–132. doi: 10.1016/j.neulet.2007.07.042. [DOI] [PubMed] [Google Scholar]
- 20.Sundaram SK, Kumar A, Makki MI, Behen ME, Chugani HT, Chugani DC. Diffusion tensor imaging of frontal lobe in autism spectrum disorder. Cereb Cortex. 2008;18:2659–2665. doi: 10.1093/cercor/bhn031. [DOI] [PMC free article] [PubMed] [Google Scholar]
- 21.Catani M, Jones DK, Daly E, Embiricos N, Deeley Q, Pugliese L, et al. Altered cerebellar feedback projections in Asperger syndrome. Neuroimage. 2008;41:1184–1191. doi: 10.1016/j.neuroimage.2008.03.041. [DOI] [PubMed] [Google Scholar]
- 22.Kumar A, Sundaram SK, Sivaswamy L, Behen ME, Makki MI, Ager J, et al. Alterations in frontal lobe tracts and corpus callosum in young children with autism spectrum disorder. Cereb Cortex. 2010;20:2103–2113. doi: 10.1093/cercor/bhp278. [DOI] [PubMed] [Google Scholar]
- 23.Ben Bashat D, Kronfeld-Duenias V, Zachor DA, Ekstein PM, Hendler T, Tarrasch R, et al. Accelerated maturation of white matter in young children with autism: a high b value DWI study. Neuroimage. 2007;37:40–47. doi: 10.1016/j.neuroimage.2007.04.060. [DOI] [PubMed] [Google Scholar]
- 24.Bode MK, Mattila ML, Kiviniemi V, Rahko J, Moilanen I, Ebeling H, et al. White matter in autism spectrum disorders - evidence of impaired fiber formation. Acta Radiol. 2011 doi: 10.1258/ar.2011.110197. [DOI] [PubMed] [Google Scholar]
- 25.Weinstein M, Ben-Sira L, Levy Y, Zachor DA, Ben Itzhak E, Artzi M, et al. Abnormal white matter integrity in young children with autism. Hum Brain Mapp. 2011;32:534–543. doi: 10.1002/hbm.21042. [DOI] [PMC free article] [PubMed] [Google Scholar]
- 26.Groen WB, Buitelaar JK, van der Gaag RJ, Zwiers MP. Pervasive microstructural abnormalities in autism: a DTI study. J Psychiatry Neurosci. 2011;36:32–40. doi: 10.1503/jpn.090100. [DOI] [PMC free article] [PubMed] [Google Scholar]
- 27.Shukla DK, Keehn B, Lincoln AJ, Muller RA. White matter compromise of callosal and subcortical fiber tracts in children with autism spectrum disorder: a diffusion tensor imaging study. J Am Acad Child Adolesc Psychiatry. 2010;49:1269–1278. 1278 e1261–1262. doi: 10.1016/j.jaac.2010.08.018. [DOI] [PMC free article] [PubMed] [Google Scholar]
- 28.Peters JM, Sahin M, Vogel-Farley VK, Jeste SS, Nelson CA, 3rd, Gregas MC, et al. Loss of white matter microstructural integrity is associated with adverse neurological outcome in tuberous sclerosis complex. Acad Radiol. 2012;19:17–25. doi: 10.1016/j.acra.2011.08.016. [DOI] [PMC free article] [PubMed] [Google Scholar]
- 29.Mengotti P, D’Agostini S, Terlevic R, De Colle C, Biasizzo E, Londero D, et al. Altered white matter integrity and development in children with autism: a combined voxel-based morphometry and diffusion imaging study. Brain Res Bull. 2011;84:189–195. doi: 10.1016/j.brainresbull.2010.12.002. [DOI] [PubMed] [Google Scholar]
- 30.Barnea-Goraly N, Lotspeich LJ, Reiss AL. Similar white matter aberrations in children with autism and their unaffected siblings: a diffusion tensor imaging study using tract-based spatial statistics. Arch Gen Psychiatry. 2010;67:1052–1060. doi: 10.1001/archgenpsychiatry.2010.123. [DOI] [PubMed] [Google Scholar]
- 31.Cheng Y, Chou KH, Chen IY, Fan YT, Decety J, Lin CP. Atypical development of white matter microstructure in adolescents with autism spectrum disorders. Neuroimage. 2010;50:873–882. doi: 10.1016/j.neuroimage.2010.01.011. [DOI] [PubMed] [Google Scholar]
- 32.Shukla DK, Keehn B, Muller RA. Tract-specific analyses of diffusion tensor imaging show widespread white matter compromise in autism spectrum disorder. J Child Psychol Psychiatry. 2011;52:286–295. doi: 10.1111/j.1469-7610.2010.02342.x. [DOI] [PMC free article] [PubMed] [Google Scholar]
- 33.Noriuchi M, Kikuchi Y, Yoshiura T, Kira R, Shigeto H, Hara T, et al. Altered white matter fractional anisotropy and social impairment in children with autism spectrum disorder. Brain Res. 2010;1362:141–149. doi: 10.1016/j.brainres.2010.09.051. [DOI] [PubMed] [Google Scholar]
- 34.Cheon KA, Kim YS, Oh SH, Park SY, Yoon HW, Herrington J, et al. Involvement of the anterior thalamic radiation in boys with high functioning autism spectrum disorders: a Diffusion Tensor Imaging study. Brain Res. 2011;1417:77–86. doi: 10.1016/j.brainres.2011.08.020. [DOI] [PubMed] [Google Scholar]
- 35.Smith SM, Jenkinson M, Johansen-Berg H, Rueckert D, Nichols TE, Mackay CE, et al. Tract-based spatial statistics: voxelwise analysis of multi-subject diffusion data. Neuroimage. 2006;31:1487–1505. doi: 10.1016/j.neuroimage.2006.02.024. [DOI] [PubMed] [Google Scholar]
- 36.Zhang H, Avants BB, Yushkevich PA, Woo JH, Wang S, McCluskey LF, et al. High-dimensional spatial normalization of diffusion tensor images improves the detection of white matter differences: an example study using amyotrophic lateral sclerosis. IEEE Trans Med Imaging. 2007;26:1585–1597. doi: 10.1109/TMI.2007.906784. [DOI] [PubMed] [Google Scholar]
- 37.Lord C, Rutter M, Le Couteur A. Autism Diagnostic Interview-Revised: a revised version of a diagnostic interview for caregivers of individuals with possible pervasive developmental disorders. J Autism Dev Disord. 1994;24:659–685. doi: 10.1007/BF02172145. [DOI] [PubMed] [Google Scholar]
- 38.Lord C, Risi S, Lambrecht L, Cook EH, Leventhal BL, DiLavore PC, et al. The Autism Diagnostic Observation Schedule—Generic: A Standard Measure of Social and Communication Deficits Associated with the Spectrum of Autism. Journal of Autism and Developmental Disorders. 2000;30:205–223. [PubMed] [Google Scholar]
- 39.Rutter M, Bailey A, Lord C. Social Communication Questionnaire. Los Angeles, CA: Western Psychological Services; 2003. [Google Scholar]
- 40.Achenbach TM, Rescorla LA. Manual for the ASEBA Preschool Forms & Profiles. Burlington, VT: University of Vermont, Research Center for children, Youth, and Families; 2000. [Google Scholar]
- 41.Mullen EM. Mullen Scales of Early Learning (AGS Ed) Circle Pines, MN: American Guidance Service; 1995. [Google Scholar]
- 42.Elliott CD. Differential Ability Scales. 2. San Antonio, TX: Harcourt Assessment; 2007. [Google Scholar]
- 43.Pierpaoli C, Walker L, Irfanoglu MO, Barnett AS, Chang L-C, Koay CG, et al. TORTOISE: an integrated software package for processing of diffusion MRI data. ISMRM 18th annual mtg; Stockholm, Sweden. 2010. [Google Scholar]
- 44.Rohde GK, Barnett AS, Basser PJ, Marenco S, Pierpaoli C. Comprehensive approach for correction of motion and distortion in diffusion-weighted MRI. Magn Reson Med. 2004;51:103–114. doi: 10.1002/mrm.10677. [DOI] [PubMed] [Google Scholar]
- 45.Wu M, Chang L-C, Walker L, Lemaitre H, Barnett AS, Marenco S, et al. Comparison of EPI distortion correction methods in diffusion tensor MRI using a novel framework. Med Image Comput Comput Assist Interv Int Conf Med Image Comput Comput Assist Interv. 2008;11:321–329. doi: 10.1007/978-3-540-85990-1_39. [DOI] [PMC free article] [PubMed] [Google Scholar]
- 46.Leemans A, Jones DK. The B-matrix must be rotated when correcting for subject motion in DTI data. Magn Reson Med. 2009;61:1336–1349. doi: 10.1002/mrm.21890. [DOI] [PubMed] [Google Scholar]
- 47.Chang LC, Jones DK, Pierpaoli C. RESTORE: robust estimation of tensors by outlier rejection. Magn Reson Med. 2005;53:1088–1095. doi: 10.1002/mrm.20426. [DOI] [PubMed] [Google Scholar]
- 48.Walker L, Chang LC, Koay CG, Sharma N, Cohen L, Verma R, et al. Effects of physiological noise in population analysis of diffusion tensor MRI data. Neuroimage. 2011;54:1168–1177. doi: 10.1016/j.neuroimage.2010.08.048. [DOI] [PMC free article] [PubMed] [Google Scholar]
- 49.Nichols TE, Holmes AP. Nonparametric permutation tests for functional neuroimaging: a primer with examples. Hum Brain Mapp. 2002;15:1–25. doi: 10.1002/hbm.1058. [DOI] [PMC free article] [PubMed] [Google Scholar]
- 50.Smith SM, Jenkinson M, Woolrich MW, Beckmann CF, Behrens TE, Johansen-Berg H, et al. Advances in functional and structural MR image analysis and implementation as FSL. Neuroimage. 2004;23(Suppl 1):S208–219. doi: 10.1016/j.neuroimage.2004.07.051. [DOI] [PubMed] [Google Scholar]
- 51.Zhang H, Yushkevich PA, Gee JC. Deformable registration of diffusion tensor MR images with explicit orientation optimization. Med Image Comput Comput Assist Interv. 2005;8:172–179. doi: 10.1007/11566465_22. [DOI] [PubMed] [Google Scholar]
- 52.Pajevic S, Pierpaoli C. Color schemes to represent the orientation of anisotropic tissues from diffusion tensor data: application to white matter fiber tract mapping in the human brain. Magn Reson Med. 1999;42:526–540. [PubMed] [Google Scholar]
- 53.Jeong JW, Kumar AK, Sundaram SK, Chugani HT, Chugani DC. Sharp curvature of frontal lobe white matter pathways in children with autism spectrum disorders: tract-based morphometry analysis. AJNR Am J Neuroradiol. 2011;32:1600–1606. doi: 10.3174/ajnr.A2557. [DOI] [PMC free article] [PubMed] [Google Scholar]
- 54.Thomas C, Humphreys K, Jung KJ, Minshew N, Behrmann M. The anatomy of the callosal and visual-association pathways in high-functioning autism: a DTI tractography study. Cortex. 2011;47:863–873. doi: 10.1016/j.cortex.2010.07.006. [DOI] [PMC free article] [PubMed] [Google Scholar]
- 55.Shukla DK, Keehn B, Smylie DM, Muller RA. Microstructural abnormalities of short-distance white matter tracts in autism spectrum disorder. Neuropsychologia. 2011;49:1378–1382. doi: 10.1016/j.neuropsychologia.2011.02.022. [DOI] [PMC free article] [PubMed] [Google Scholar]
- 56.Mukherjee P, Miller JH, Shimony JS, Conturo TE, Lee BC, Almli CR, et al. Normal brain maturation during childhood: developmental trends characterized with diffusion-tensor MR imaging. Radiology. 2001;221:349–358. doi: 10.1148/radiol.2212001702. [DOI] [PubMed] [Google Scholar]
- 57.Lebel C, Walker L, Leemans A, Phillips L, Beaulieu C. Microstructural maturation of the human brain from childhood to adulthood. Neuroimage. 2008;40:1044–1055. doi: 10.1016/j.neuroimage.2007.12.053. [DOI] [PubMed] [Google Scholar]
- 58.Wolff JJ, Gu H, Gerig G, Elison JT, Styner M, Gouttard S, et al. Differences in White Matter Fiber Tract Development Present From 6 to 24 Months in Infants With Autism. Am J Psychiatry. 2012 doi: 10.1176/appi.ajp.2011.11091447. [DOI] [PMC free article] [PubMed] [Google Scholar]
- 59.Courchesne E, Karns CM, Davis HR, Ziccardi R, Carper RA, Tigue ZD, et al. Unusual brain growth patterns in early life in patients with autistic disorder: an MRI study. Neurology. 2001;57:245–254. doi: 10.1212/wnl.57.2.245. [DOI] [PubMed] [Google Scholar]
- 60.Courchesne E, Carper R, Akshoomoff N. Evidence of brain overgrowth in the first year of life in autism. JAMA. 2003;290:337–344. doi: 10.1001/jama.290.3.337. [DOI] [PubMed] [Google Scholar]
- 61.Power JD, Barnes KA, Snyder AZ, Schlaggar BL, Petersen SE. Spurious but systematic correlations in functional connectivity MRI networks arise from subject motion. Neuroimage. 2012;59:2142–2154. doi: 10.1016/j.neuroimage.2011.10.018. [DOI] [PMC free article] [PubMed] [Google Scholar]
- 62.Pierpaoli C, Marenco S, Rohde GK, Jones DK, Barnett AS. Analyzing the contribution of cardiac pulsation to the variability of quantities derived from the diffusion tensor. ISMRM 11th annual mtg; Toronto, Ontario, Canada. 2003. p. 70. [Google Scholar]
- 63.Pierpaoli C, Barnett A, Pajevic S, Chen R, Penix LR, Virta A, et al. Water diffusion changes in Wallerian degeneration and their dependence on white matter architecture. Neuroimage. 2001;13:1174–1185. doi: 10.1006/nimg.2001.0765. [DOI] [PubMed] [Google Scholar]
- 64.Budde MD, Janes L, Gold E, Turtzo LC, Frank JA. The contribution of gliosis to diffusion tensor anisotropy and tractography following traumatic brain injury: validation in the rat using Fourier analysis of stained tissue sections. Brain. 2011;134:2248–2260. doi: 10.1093/brain/awr161. [DOI] [PMC free article] [PubMed] [Google Scholar]
- 65.Hong S, Ke X, Tang T, Hang Y, Chu K, Huang H, et al. Detecting abnormalities of corpus callosum connectivity in autism using magnetic resonance imaging and diffusion tensor tractography. Psychiatry Res. 2011;194:333–339. doi: 10.1016/j.pscychresns.2011.03.009. [DOI] [PubMed] [Google Scholar]
- 66.Fletcher PT, Whitaker RT, Tao R, DuBray MB, Froehlich A, Ravichandran C, et al. Microstructural connectivity of the arcuate fasciculus in adolescents with high-functioning autism. Neuroimage. 2010;51:1117–1125. doi: 10.1016/j.neuroimage.2010.01.083. [DOI] [PMC free article] [PubMed] [Google Scholar]
- 67.Pardini M, Garaci FG, Bonzano L, Roccatagliata L, Palmieri MG, Pompili E, et al. White matter reduced streamline coherence in young men with autism and mental retardation. Eur J Neurol. 2009;16:1185–1190. doi: 10.1111/j.1468-1331.2009.02699.x. [DOI] [PubMed] [Google Scholar]
- 68.Thakkar KN, Polli FE, Joseph RM, Tuch DS, Hadjikhani N, Barton JJ, et al. Response monitoring, repetitive behaviour and anterior cingulate abnormalities in autism spectrum disorders (ASD) Brain. 2008;131:2464–2478. doi: 10.1093/brain/awn099. [DOI] [PMC free article] [PubMed] [Google Scholar]
Associated Data
This section collects any data citations, data availability statements, or supplementary materials included in this article.