Abstract
There is compelling evidence to suggest that serous tubal intraepithelial carcinoma (STIC) is the likely primary site for the development of pelvic high-grade serous carcinomas (HGSCs). Identifying molecules that are upregulated in STIC is important not only to provide biomarkers to assist in the diagnosis of STIC but also to elucidate our understanding of the pathogenesis of HGSC. In this study, we performed RNA sequencing to compare transcriptomes between HGSC and normal fallopian tube epithelium (FTE), and identified LAMC1 encoding laminin γ1 as one of the preferentially upregulated gene associated with HGSC. RT-PCR further validated LAMC1 upregulation in HGSC as compared to normal FTE. Immunohistochemistry was performed on 32 cases of concurrent HGSC and STIC. The latter was diagnosed based on morphology, TP53 mutations, p53 and Ki-67 immunohistochemical pattern. Laminin γ1 immunostaining intensity was found to be significantly higher in STIC and HGSC compared to adjacent FTE in all cases (p< 0.001). In normal FTE, laminin γ1 immunoreactivity was predominantly localized in the basement membrane or on the apical surface of ciliated cells whereas in STIC and HGSC cells, laminin γ1 staining was diffuse and intense throughout the cytoplasm. More importantly, strong laminin γ1 staining was detected in all 13 STICs which lacked p53 immunoreactivity due to null mutations. These findings suggest that the overexpression of laminin γ1 immunoreactivity and alteration of its staining pattern in STICs can serve as a useful tissue biomarker, especially for those STICs that are negative for p53 and have a low Ki-67 labeling index.
Keywords: ovarian cancer, serous tubal intraepithelial carcinoma, STIC, laminin, LAMC1
Introduction
One of the major problems in the diagnosis of STIC is a lack of reproducible diagnostic criteria. This was highlighted by a morphology-based study showing that the inter-observer reproducibility of the diagnosis of STICs compared to non-STICs, including normal fallopian tube epithelium (FTE) and intratubal lesions that were atypical but not clearly malignant was only fair-to-good even among experienced gynecologic pathologists (3). This lack of reproducibility has serious implications for both clinical management and research. To address this issue, we developed an algorithm that incorporates morphologic features and immunostaining for p53 and Ki-67 (22). Although with this algorithm the reproducibility for the diagnosis of STIC was significantly improved (kappa=0.73; 95% CI 0.58–0.86) compared to morphologic assessment alone, interpretation of immunostaining was sometimes problematic. In fact, while intense and diffuse p53 immunostaining pattern correlates with missense TP53 mutations, approximately 40% of STICs are p53 negative, due to frameshift, nonsense or splicing junction mutations of TP53 (9). Therefore, as negative staining for p53 may be mistakenly interpreted as an absence of a TP53 mutation, mutational analysis, which necessitates laser capture microdissection, would be a better approach but this is not feasible in routine pathology practice. In addition, estimation of the Ki-67 labeling index can be challenging if this marker is used alone because of small lesional size which makes it sometimes difficult to count a statistically sufficient number of cells. Other potential markers, such as p16, may be useful but have not been studied for their diagnostic potential in the diagnosis of STIC. In an attempt to facilitate and improve the diagnosis of STIC without having to resort to mutational analysis, we have attempted to identify STIC-associated markers, which might be superior to p53 and Ki-67 immunostaining. To that end, we have applied RNA sequencing to compare the transcriptomes between HGSC and normal FTE (Morin, unpublished data). One of the genes that showed preferential expression in HGSC as compared to normal FTE is LAMC1, which encodes laminin γ1 chain, a protein essential for assembly of basement membrane. Laminins have been described in a wide variety of biological and pathological processes including tissue development, tumor cell invasion and metastasis (4, 6, 18). In the current study, we validated the overexpression of LAMC1 in STICs and HGSCs compared to normal FTE based on laminin γ1 immunoreactivity and used this technique to determine whether it could be used as a marker in the diagnosis of STIC.
MATERIALS AND METHODS
Case selection and RNA preparation
To validate the RNA sequencing results, we collected 8 ovarian HGSCs, 9 ovarian cancer cell lines (A2780, Hey, JH514, OVCAR3, OVCAR4, OVCAR5, OVCAR8, OWA28 and SKOV3) and 12 primary cultures of normal FTE. The total RNA was extracted from HGSC tissues and normal tubal epithelium using the RNease mini kit (Qiagen) following a standard protocol. Immunohistochemistry was performed in a total of 32 formalin-fixed paraffin-embedded samples containing concurrent STICs and HGSCs, which were retrieved from the Ovarian Cancer Tissue Bank at the Johns Hopkins Medical institutions. Many of them were the consultation cases from the Legacy Health System (Portland, OR), and Memorial Sloan Kettering Cancer Center (New York, NY). Microscopically, STICs were discrete from the associated HGSCs. Furthermore, we also determined whether laminin γ1 was expressed in the so called “p53 signatures” (benign-appearing FTE cells that show p53 immunoreactivity) and in serous tubal intraepithelial lesions (STIL), tubal lesions with cytologic atypia but insufficient to be called STIC. The detailed algorithm and criteria used in this study in distinguishing STIC, STIL and p53 signature has been previously reported (21, 22). The acquisition of tissue samples was approved by the Institutional Review Board.
Immunohistochemistry
The following antibodies were used for immunohistochemistry: laminin γ1 polyclonal antibody (cat # HPA001909, Sigma-Aldrich, St Louis, MO), laminin α3 polyclonal antibody (cat # HPA009309, Sigma-Aldrich), p53 mouse monoclonal antibody (clone Bp53–11, cat # 760–2542; Ventana Medical Systems, Tucson, AZ) and Ki-67 antibody (Mib-1, Ventana Medical Systems). Antigen retrieval and immunostaining followed previous reports (7, 9). The staining patterns in normal-appearing FTE adjacent to STIC were also recorded. Percentage of strongly positive nuclei was used to score the immunostaining for p53 and Ki-67 and intensity scores were used to record the expression levels of laminin γ1 and α3. Two pathologists (EK and IMS) independently scored all cases. The scoring system for p53 staining has been detailed in our recent report (9). If ≥60% of nuclei were positive the stain was interpreted as positive. This cutoff was based on our experience and a previous study showing that HGSCs with intense p53 nuclear staining correlated with TP53 missense mutations [8]. The laminin α3 and laminin γ1 scoring was based on a 5-tiered intensity score system. Of note, among 32 cases containing STIC and HGSC, p53 staining in 24 cases (9) and Ki-67 staining in 31 cases have been previously reported (7).
Quantitative real-time PCR
The first strand cDNA was generated using the iScript cDNA synthesis kit (Bio-Rad) from 1 μg of total RNA isolated using the RNeasy Plus Mini Kit (Qiagen). The quantitative reverse transcription-PCR was performed using the CFX96 Real-Time PCR Detection System (Bio-Rad) with SYBR Green I (Invitrogen). The primer sequences used are summarized in Table S1. All RT-qPCR experiments were performed in duplicate and a mean value was used for the determination of mRNA levels. Relative quantification of the mRNA levels was performed using comparative Cq method with GAPDH as reference gene with the formula 2 −ΔΔCq.
Cell Culture, Gene Knockdown and Western Blotting analysis
The ovarian cancer cell line, OVCAR3, was obtained from American Type Culture Collection (Manassas, VA). OVCAR3 were seeded into 12-well plates at 1.0 × 10⁵ cells per well, in RPMI-1640 media supplemented with 10% fetal bovine serum, penicillin (500 IU/mL), and streptomycin (50 μg/mL) at 37 °C in a humid atmosphere with 5% CO2. Cells were transfected with 2 different LAMC1-specific short interfering RNA (siRNAs) (Qiagen cat # SI00035756 and SI03063396) and scramble siRNA (Qiagen cat # SI03650325) as the control, with HiPerfect (Qiagen) reagent, following the protocol provided by the manufacturer. The approximate silencing efficiency at the mRNA and protein level was assessed by qRT-PCR and Western blot, respectively.
Protein was obtained by lysing the cells in lysis buffer (50mM Tris-HCl at pH 7.5, 150 mM NaCl, 1% NP40) with protease and phosphatase inhibitors (Roche), and then separated by electrophoresis on 4% to 12% Tris-glycine gels and transferred onto a polyvinylidene difluoride membrane. After blocking, the membrane was incubated with anti-laminin γ1 antibody and anti-GAPDH antibody (clone D16H11, cat # 5174, Cell Signaling Technology, Beverly, MA) overnight, washed, incubated with horseradish peroxidase-conjugated secondary antibody, and detected with enhanced chemiluminescence solution (Thermo Scientific).
RESULTS
Identification and validation of laminin γ1 gene expression in high-grade ovarian serous carcinoma
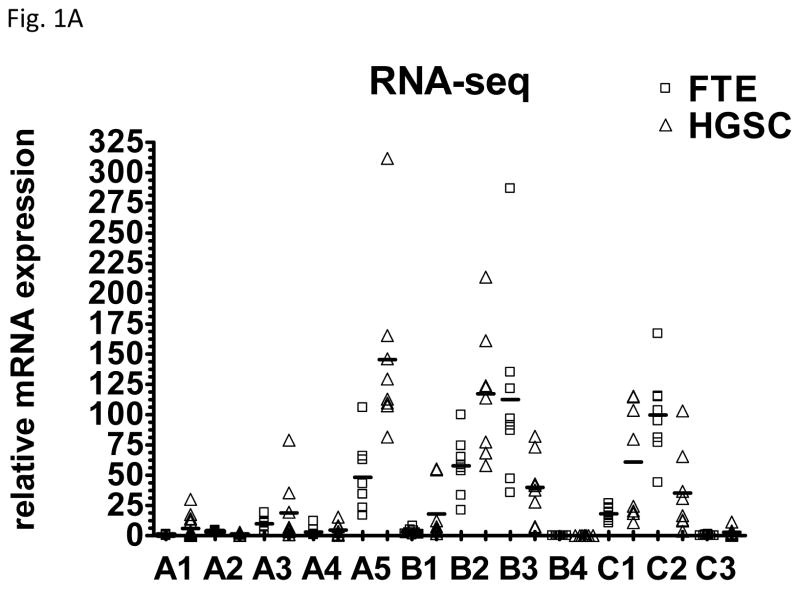
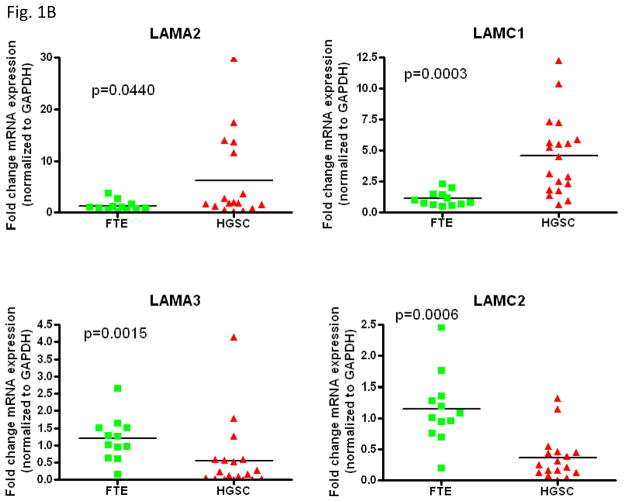
Laminins are extracellular matrix glycoproteins, composed of 3 chains, laminin α, β and γ chains. At present five α, four β and three γ chains have been identified, and their combination bears the 16 laminin known heterotrimeric isoforms. We analyzed the mRNA levels of laminin chains including A1, A2, A3, A4, A5, B1, B2, B3, B4, C1, C2, and C3 according to RNA sequencing data obtained from 8 HGSCs and 8 samples of affinity purified normal FTE. As shown in Fig. 1A, as compared to normal FTE, upregulation of LAMC1 was most significant among all other chains examined. Next, we applied quantitative real-time PCR to validate the RNA sequencing results in representative chains including A2, A3, C1 and C2. Fig. 1B demonstrated that like the RNA sequencing data, the expression levels of LAMC1 encoding laminin γ1 chain were significantly higher in HGSC than in normal FTE (p< 0.001). In contrast, other laminin chains did show lower significant change between HGSC and normal FTE.
Fig. 1.
Expression of different laminin chains in high-grade serous carcinoma tissues and samples prepared from normal fallopian tube epithelium. A. Relative mRNA levels of each chain were plotted according to tissue prepared. HGSC: high-grade serous carcinoma; FTE: normal fallopian tube epithelium. B. Relative mRNA levels of representative laminin chains were plotted.
Immunohistochemical analysis of laminin γ1 in normal fallopian tube, serous tubal intraepithelial carcinoma and high-grade serous carcinoma
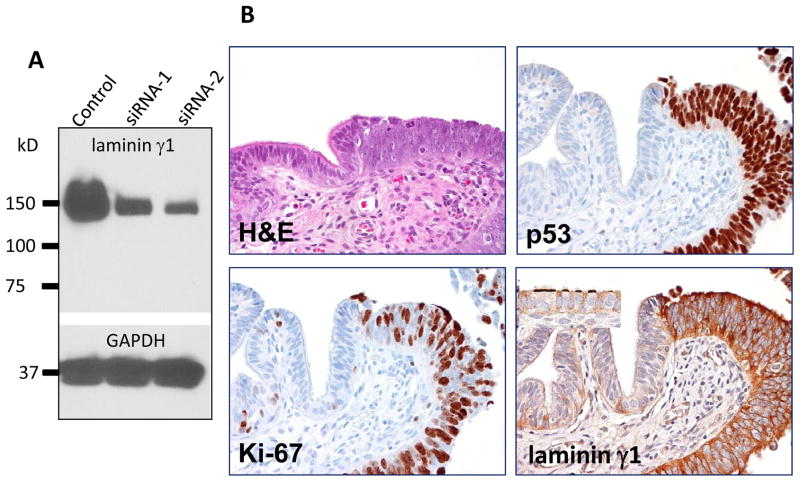
To demonstrate the relative specificity of the laminin γ1 antibody used in immunohistochemistry, we applied siRNA knockdown to an ovarian carcinoma cell line, OVCAR3, and performed Western blot analysis using this antibody. As shown in Fig. 2A, the protein expression levels of OVCAR3 cells transfected with two independent LAMC1 targeting siRNAs were significantly decreased as compared to scrambled siRNA treated OVCAR3 cells, indicating the specificity of the antibody in recognizing laminin γ1.
Fig. 2.
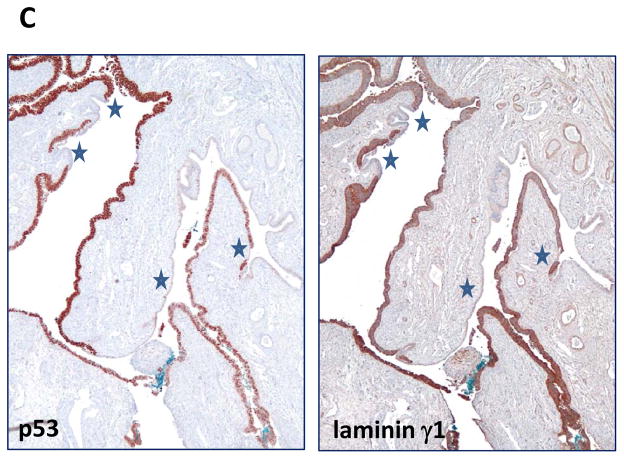
Comparison of immunoreactivity of p53 and laminin γ1 in a fallopian tube diffusely involved by a serous tubal intraepithelial carcinoma. A. Western blot analysis shows a marked decrease in lamininγ1 protein expression after OVCAR3 cells were treated with siRNA-1 and siRNA-2 that target LAMC1 gene. GAPDH is used as a loading control. B. Immunostaining of laminin γ1, p53 and Ki-67 in a STIC. A high magnification view of a STIC and adjacent normal-appearing tubal epithelium. The STIC demonstrates a diffuse and intense p53 staining, a high Ki-67 labeling index and diffuse of laminin γ1 expression. In normal tubal epithelium, of lamininγ1 immunoreactivity is detected in basement membrane and apical surface of ciliated cells (inset) whereas of laminin γ1 immunoreactivity in STIC cells loses the “polarity” with strong staining in both cell surface and cytoplasm. C. A low magnification view of a fallopian tube section contains diffuse STIC. The distribution of laminin γ1 immunoreactivity faithfully overlapped with p53 staining. Asterisks highlight the discrete areas of tubal epithelium that is negative for both stains.
In this study, we used TP53 mutation as the molecular “determinant” to define STICs in 24 cases of which the mutational status was known (9). In additional 8 STICs which contained insufficient lesional cells for sequencing, the diagnosis was based on criteria described in a recent study (22). Immunohistochemistry was performed on 32 cases in which there was a STIC and a concurrent HGSC. As compared to adjacent normal-appearing FTE, STICs showed substantially more intense laminin γ1 immunoreactivity in all 32 cases (Table 1). Moreover, the immunostaining intensity was similar in the STICs and concurrent HGSCs, but more heterogeneous. In addition to increased expression levels of laminin γ1 in STIC cells, we also observed that the cellular distribution in STIC and HGSC was different from normal-appearing FTE. In normal FTE, laminin γ1 immunoreactivity was mainly detected in the basement membrane and occasionally in the apical surface of ciliated cells (Fig. 2B) whereas, in STIC and HGSC cells, the laminin γ1 staining exhibited a diffuse distribution involving both the membrane and cytoplasm. In order to further investigate the correlation of laminin γ1 expression and TP53 mutation in STICs, we compared the immunostaining patterns of laminin γ1 and p53 in 12 STICs with known missense TP53 mutations which were associated with intense and diffuse p53 staining (9) and found that the distribution of laminin γ1 immunoreactivity faithfully replicated the p53 stains (Fig. 2B and Fig. 2C), providing cogent evidence that STIC cells co-expressed laminin γ1 and p53.
Table 1.
Expression of p53, Ki-67, laminin γ1 and laminin α3 as well as TP53 mutation status in serous tubal intraepithelial carcinoma (STIC), concurrent high-grade serous carcinoma (HGSC) and normal-appearing fallopian tubal epithrlium (FTE).
| # | p53 (%) | Ki-67 (%) | laminin γ1 (intensity) | laminin α3 (intensity) | TP53 mutation Type | ||||||
|---|---|---|---|---|---|---|---|---|---|---|---|
| STIC | HGSC | STIC | HGSC | STIC | HGSC | FTE | STIC | HGSC | FTE | ||
| 1 | 100 | 100 | 10 | 25 | 4 | 4 | 1 | 4 | 3 | 4 | NA |
| 2 | 100 | 100 | 40 | 25 | 1 | 1 | 0 | 4 | 3 | 4 | MISSENSE |
| 3 | 0 | 0 | 35 | 80 | 4 | 3 | 0 | 4 | 3 | 4 | SPLICING JUNCTION |
| 4 | 0 | 0 | 15 | 10 | 4 | 3 | 0 | 4 | 3 | 4 | SPLICING JUNCTION |
| 5 | 100 | 80 | 60 | 20 | 3 | 3 | 0 | 4 | 4 | 4 | MISSENSE |
| 6 | 100 | 100 | 60 | 30 | 4 | 4 | 0 | 4 | 4 | 3 | MISSENSE |
| 7 | 0 | 0 | 15 | 40 | 4 | 3 | 0 | 4 | 4 | 3 | SPLICING JUNCTION |
| 8 | 0 | 0 | 25 | 40 | 3 | 2 | 0 | 4 | 4 | 4 | FRAMESHIFT |
| 9 | 100 | 100 | 10 | 35 | 3 | 3 | 1 | 4 | 3 | 4 | MISSENSE |
| 10 | 100 | 100 | 10 | 40 | 3 | 3 | 1 | 4 | 3 | 4 | MISSENSE |
| 11 | 100 | 100 | 25 | 30 | 4 | 3 | 0 | 4 | 3 | 4 | MISSENSE |
| 12 | 0 | NA | 70 | NA | 2 | NA | 0 | 4 | NA | 4 | NONSENSE |
| 13 | 0 | 0 | 50 | 15 | 3 | 3 | 0 | 4 | 4 | 4 | NONSENSE |
| 14 | 70 | 90 | 40 | 15 | 3 | 3 | 0 | 4 | 3 | 4 | MISSENSE |
| 15 | 100 | 100 | 40 | 25 | 3 | 2 | 0 | 4 | 4 | 4 | NA |
| 16 | 100 | 100 | 30 | 50 | 2 | 3 | 0 | 4 | 4 | 4 | MISSENSE |
| 17 | 100 | 60 | 60 | 25 | 4 | 3 | 0 | 4 | 3 | 4 | MISSENSE |
| 18 | 0 | 0 | 20 | 40 | 4 | 3 | 0 | NA | NA | NA | NONSENSE |
| 19 | 100 | 100 | 20 | 25 | 4 | 3 | 0 | NA | NA | NA | MISSENSE |
| 20 | 0 | 0 | 35 | 50 | 3 | 3 | 1 | NA | NA | NA | FRAMESHIFT |
| 21 | 0 | 0 | 50 | 20 | 3 | 3 | 0 | NA | NA | NA | FRAMESHIFT |
| 22 | 100 | NA | 60 | NA | 3 | NA | 0 | NA | NA | NA | NA |
| 23 | 0 | 0 | 40 | 40 | 4 | 3 | 0 | NA | NA | NA | NA |
| 24 | 80 | 85 | 30 | 25 | 2 | 2 | 0 | NA | NA | NA | NA |
| 25 | 100 | 100 | 35 | 30 | 4 | 4 | 1 | NA | NA | NA | NA |
| 26 | 100 | 100 | 35 | 60 | 4 | 3 | 0 | NA | NA | NA | MISSENSE |
| 27 | 100 | 100 | 20 | 30 | 4 | 3 | 1 | NA | NA | NA | NA |
| 28 | 0 | 0 | 35 | 50 | 3 | 3 | 1 | NA | NA | NA | FRAMESHIFT |
| 29 | 100 | 100 | 35 | 30 | 4 | 4 | 0 | NA | NA | NA | NA |
| 30 | 100 | NA | 30 | NA | 2 | NA | 1 | NA | NA | NA | MISSENSE |
| 31 | 0 | 0 | 30 | 50 | 3 | 3 | 1 | NA | NA | NA | FRAMESHIFT |
| 32 | 0 | 0 | 50 | 25 | 2 | 2 | 0 | NA | NA | NA | FRAMESHIFT |
We also performed laminin α3 immunohistochemistry in representative 17 of the 32 cases. Since laminin α3, unlike laminin γ1, did not show upregulation in HGSC as compared to normal-appearing FTE based on RNA sequencing and real-time PCR analyses, we used this marker as a control. As shown in Table 1, relatively intense laminin α3 staining was seen in STIC, HGSC and FTE in all cases tested, indicating that there was no differential expression of laminin α3 in those cells.
The performance of laminin γ1 in the diagnosis of serous tubal intraepithelial carcinoma
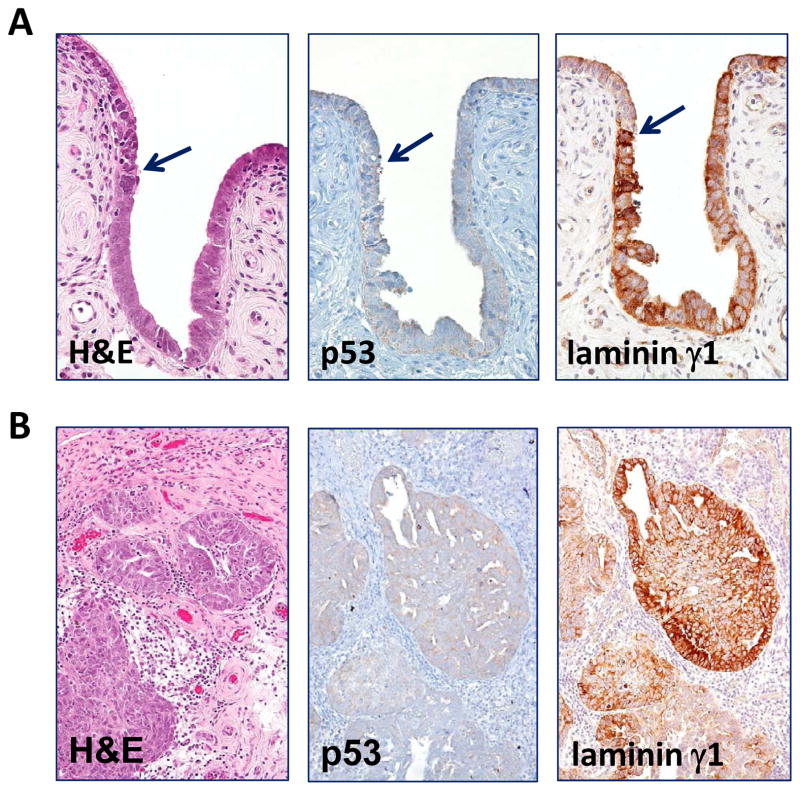
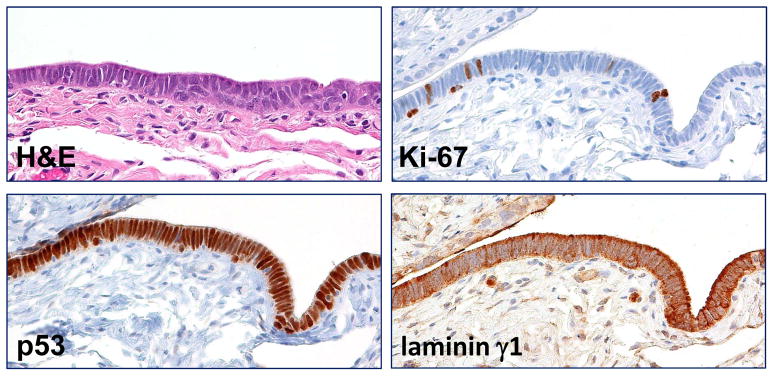
The main purpose of this study was to determine the potential use of laminin γ1 staining in assisting in the diagnosis of STIC. Accordingly, we compared the performance of laminin γ1 and p53 staining in all STICs. Of the 32 STICs, positive p53 staining (intense and diffuse) pattern was observed in 19 (60%) while there was an absence of staining in 13. In contrast, this latter discordant pattern in which there was complete loss of p53 expression and overexpression of laminin γ1 in the STIC and HGSC cells is illustrated in Fig. 3. Also as compared to Ki-67, the immunostaining intensity of laminin γ1 was a better marker for STIC because of the highly variable Ki-67 labeling index, ranging from 10% to 60%. Another problem with the Ki-67 labeling index was the small number of cells on which the labeling index can be determined in small STICs (Table 1). We also analyzed 3 atypical tubal intraepithelial lesions that morphologically fell short of the diagnosis of STIC. Because their relationship to STIC is not clear, that is to say, whether they are precursors of STIC or benign reactive atypias, we use the noncommittal term “serous tubal intraepithelial lesion (STIL)”. All 3 STILs overexpressed laminin γ1 and showed a similar cellular distribution to STICs (Fig. 4). We also analyzed 3 “p53 signatures”, defined as short stretches of normal-appearing FTE that show strong expression of p53, but none of them demonstrated an increase in laminin γ1 immunostaining intensity as compared to the adjacent normal FTE.
Fig. 3.
Laminin γ1 immunoreactivity in p53 negative STIC and HGSC. A. A p53 negative STIC shows upregulation of laminin γ1 expression. Arrows: junction between the STIC and normal-appearing tubal epithelium. B. Laminin γ1 expression is detected in the concurrent p53 negative HGSC.
Fig. 4.
Expression of laminin γ1 in a serous tubal intraepithelial lesion (STIL). The lesion is composed of atypical epithelial cells with enlarged nuclei and lacks of ciliated cells. Although the p53 staining, like a STIC, is diffuse and intense, the Ki-67 labeling index is lower than established STIC with an estimation of approximately 9%. Significantly higher laminin γ1 immunoreactivity is observed in STIL than in adjacent normal-appearing tubal epithelium (asterisk).
DISCUSSION
The site of origin of ovarian cancer has been long debated but recently a growing body of evidence has implicated the fallopian tube, rather than the ovary, as the primary source, thereby calling into question the very existence of primary “ovarian” carcinoma. Several lines of evidence have supported the proposal that STIC is the likely precursor of pelvic HGSC (8, 12). First, STICs are detected in more than half the cases of sporadic pelvic HGSCs (ovarian, tubal, and “primary” peritoneal) (2, 16) and in approximately 10–15% of fallopian tubes prophylactically removed from women at high-risk of developing ovarian carcinoma because of germline BRCA mutations. In these latter cases the STIC morphologically resembles ovarian HGSC and importantly there are no similar lesions in the ovary. Second, in an analysis of 342 consecutive gynecologic cases that were entirely submitted for histologic examination, Tang et al. reported that STICs were only associated with cases in which there was either a pelvic HGSC or uterine serous carcinoma but not with endometrioid, clear cell or mucinous ovarian carcinomas (20). Third, STICs frequently upregulate oncogene products, such as cyclin E1, fatty acid synthase and Rsf-1, that are always overexpressed in HGSC (19). Fourth, in cases in which there is a STIC and a concordant ovarian HGSC, TP53 mutational analysis has demonstrated the identical TP53 mutation in both the STIC and the associated ovarian neoplasm indicating that the two lesions are clonally related (9, 13). Finally, STICs have been reported to contain relatively shorter telomeres compared to normal-appearing FTE as occurs in precursor lesions of other cancer types (10). This latter finding and the presence of STICs in prophylactic salpingectomy specimens in the absence of carcinoma are among the most important pieces of evidence that argue against the view that STIC represents lateral extension or metastasis from the adjacent HGSC. Since HGSC represents approximately 70% of all ovarian cancer and accounts for the vast majority of deaths from this disease, this new model has profound implications for prevention and early detection.
Compared to normal-appearing FTE, we found that laminin γ1 chain is upregulated in all STICs, including those with TP53 mutations as well as those in which the mutational status is not known but where the diagnosis is based on stringently defined criteria (22). As p53 staining has been considered the most useful adjunct in the diagnosis of STIC, we compared it to laminin γ1 immunoreactivity and found that laminin γ1 has greater sensitivity. Indeed, we found that 13 of 32 STICs that failed to express detectable p53 expressed high levels of laminin γ1 relative to adjacent normal-appearing FTE. Although in our morphologic and immunohistochemical algorithm we regard a completely negative p53 stain as indicative of a null TP53 mutation as has been demonstrated in correlated immunohistochemical and mutational analysis (Table 1) (9). It is more desirable to have an immunohistochemistry marker that is overexpressed rather than one in which an absence of expression is interpreted as a positive result. To this end, laminin γ1 appears to be a highly promising candidate marker as the antibody is relatively specific, commercially available, and can be performed on formalin-fixed paraffin-embedded tissue sections.
Besides the quantitative difference in laminin γ1 expression levels between STIC and normal-appearing FTE, we also observed a remarkable difference in the cellular distribution of laminin γ1 immunoreactivity between STICs and FTE. In STIC cells, laminin γ1 immunoreactivity is diffusely localized in the cytoplasm and cell surface in contrast to the pattern of expression in normal FTE where laminin γ1 immunoreactivity is localized to the basement membrane and occasionally on the apical surface of cililated cells. Thus, this unique immunostaining pattern together with the overexpression of laminin γ1 is useful in the diagnosis of a STIC. In addition, HGSC and STIC display the same pattern of laminin γ1 immunoreactivity suggesting that a similar mechanism of altered laminin γ1 production is operative in both lesions.
Our observation of laminin γ1 overexpression in STIL suggests that it, may be molecularly related to STIC. The finding of laminin γ1 overexpression in STIC and STIL is consistent with the atypical morphology of STIL and its p53 immunostaining pattern that correlates with a TP53 missense mutation (22). Accordingly, it is tempting to speculate that STIL represents a transitional stage in the development of STIC that has not developed proliferation activity comparable to a conventional STIC (5). In contrast, laminin γ1 overexpression was not detected in p53 signatures. It has been proposed that p53 signature is a precursor of STIC (5). The absence of laminin γ1 overexpression in p53 signatures that we studied does not necessarily exclude this possibility. The number of cases of STIL and p53 signatures in this study was small and clearly additional studies are necessary to further elucidate the relationship of p53 signatures and STILs to STIC.
Finally, the similarity of laminin γ1 expression in STIC and HGSC (Fig. 3) suggests that upregulation of laminin γ1 may alter the microenvironment of pre-malignant and malignant tubal epithelial cells confering a competive growth advantage which lead to tumor progression. This is not surprising because the laminin family proteins are major components of the basement membrane and expression of specific laminin isoforms in extracellular matrix has been known to play a pivotal role in regulating a variety of cellular processes during tumor development, such as motility, invasion and metastasis (15). In particular, the lamininγ1 chain has been reported to be involved in carcinogenesis of the liver through Sp1-mediated transactivation at the LAMC1 promoter (14). Moreover, C-16, a peptide derived from lamininγ1 chain, has been shown to significantly promote cell adhesion, enhance pulmonary metastasis and migration of murine melanoma B-16 cells, possibly by inducing the secretion of matrix metalloproteasis-9 (11). Although the detailed mechanisms by which lamininγ1 facilitates tumor progression remains to be determined, it is plausible that expression of lamininγ1 contributes to the detachment, protection from anoikis (detachment-induced cell death) and dissemination of STIC cells to ovary and peritoneal surfaces. Moreover, adhesion of cancer cells to the peritoneal mesothelium is a key step in the malignant progression of this disease. Accordingly, upregulation of lamininγ1 may play an important role in tumor spread by promoting adherence of STIC cells to peritoneal surfaces since mesothelial cells express abundant laminin receptors such asα3β1 integrin (1, 17, 23).
In summary, laminin γ1, encoded by the gene LAMC1, is the predominant laminin protein in HGSC and is preferentially upregulated in STIC and HGSC as compared to normal FTE. Overexpression of laminin γ1 in essentially all STICs, including p53 negative cases, suggests that its immunostaining pattern can serve as a biomarker. Since the lamininγ1 antibody is commercially available, lamininγ1 staining may assist in diagnostic surgical pathology as well as helping to standardize the diagnosis of STIC for investigators which is fundamental for all future studies exploring the biological and clinical significance of STIC.
Supplementary Material
Acknowledgments
This study is supported by a CDMRP grant, OC100517, from the US Department of Defense, a NIH/NCI grant, U24CA160036, and The HERA Women’s Cancer Foundation.
References
- 1.Barth TF, Rinaldi N, Bruderlein S, et al. Mesothelial cells in suspension expose an enriched integrin repertoire capable of capturing soluble fibronectin and laminin. Cell Commun Adhes. 2002;9:1–14. doi: 10.1080/15419060212184. [DOI] [PubMed] [Google Scholar]
- 2.Callahan MJ, Crum CP, Medeiros F, et al. Primary fallopian tube malignancies in BRCA-positive women undergoing surgery for ovarian cancer risk reduction. J Clin Oncol. 2007;25:3985–3990. doi: 10.1200/JCO.2007.12.2622. [DOI] [PubMed] [Google Scholar]
- 3.Carlson JW, Jarboe EA, Kindelberger D, et al. Serous tubal intraepithelial carcinoma: diagnostic reproducibility and its implications. Int J Gynecol Pathol. 2010;29:310–314. doi: 10.1097/PGP.0b013e3181c713a8. [DOI] [PubMed] [Google Scholar]
- 4.Engbring JA, Kleinman HK. The basement membrane matrix in malignancy. The Journal of pathology. 2003;200:465–470. doi: 10.1002/path.1396. [DOI] [PubMed] [Google Scholar]
- 5.Folkins AK, Jarboe EA, Roh MH, et al. Precursors to pelvic serous carcinoma and their clinical implications. Gynecol Oncol. 2009;113:391–396. doi: 10.1016/j.ygyno.2009.01.013. [DOI] [PubMed] [Google Scholar]
- 6.Gritsenko PG, Ilina O, Friedl P. Interstitial guidance of cancer invasion. The Journal of pathology. 2012;226:185–199. doi: 10.1002/path.3031. [DOI] [PubMed] [Google Scholar]
- 7.Kuhn E, Kurman RJ, Sehdev AS, et al. Ki-67 labeling index as an adjunct in the diagnosis of serous tubal intraepithelial carcinoma. Int J Gyn Pathol. 2012 doi: 10.1097/PGP.0b013e31824cbeb4. in press. [DOI] [PMC free article] [PubMed] [Google Scholar]
- 8.Kuhn E, Kurman RJ, Shih IM. Ovarian cancer is an imprted disease: fact or fiction? Curr Obstet Gynecol Rep. 2012;1:1–9. doi: 10.1007/s13669-011-0004-1. [DOI] [PMC free article] [PubMed] [Google Scholar]
- 9.Kuhn E, Kurman RJ, Vang R, et al. TP53 mutations in serous tubal intraepithelial carcinoma and concurrent pelvic high-grade serous carcinoma- evidence supporting the clonal relationship of the two lesions. The Journal of pathology. 2011;226:421–6. doi: 10.1002/path.3023. [DOI] [PMC free article] [PubMed] [Google Scholar]
- 10.Kuhn E, Meeker A, Wang TL, et al. Shortened telomeres in serous tubal intraepithelial carcinoma: an early event in ovarian high-grade serous carcinogenesis. Am J Surg Pathol. 2010;34:829–836. doi: 10.1097/PAS.0b013e3181dcede7. [DOI] [PMC free article] [PubMed] [Google Scholar]
- 11.Kuratomi Y, Nomizu M, Tanaka K, et al. Laminin gamma 1 chain peptide, C-16 (KAFDITYVRLKF), promotes migration, MMP-9 secretion, and pulmonary metastasis of B16-F10 mouse melanoma cells. British journal of cancer. 2002;86:1169–1173. doi: 10.1038/sj.bjc.6600187. [DOI] [PMC free article] [PubMed] [Google Scholar]
- 12.Kurman RJ, Shih IM. The origin and pathogenesis of epithelial ovarian cancer: a proposed unifying theory. Am J Surg Pathol. 2010;34:433–443. doi: 10.1097/PAS.0b013e3181cf3d79. [DOI] [PMC free article] [PubMed] [Google Scholar]
- 13.Lee Y, Miron A, Drapkin R, et al. A candidate precursor to serous carcinoma that originates in the distal fallopian tube. J Pathol. 2007;211:26–35. doi: 10.1002/path.2091. [DOI] [PubMed] [Google Scholar]
- 14.Lietard J, Musso O, Theret N, et al. Sp1-mediated transactivation of LamC1 promoter and coordinated expression of laminin-gamma1 and Sp1 in human hepatocellular carcinomas. The American journal of pathology. 1997;151:1663–1672. [PMC free article] [PubMed] [Google Scholar]
- 15.Patarroyo M, Tryggvason K, Virtanen I. Laminin isoforms in tumor invasion, angiogenesis and metastasis. Semin Cancer Biol. 2002;12:197–207. doi: 10.1016/S1044-579X(02)00023-8. [DOI] [PubMed] [Google Scholar]
- 16.Przybycin CG, Kurman RJ, Ronnett BM, et al. Are all pelvic (nonuterine) serous carcinomas of tubal origin? Am J Surg Pathol. 2010;34:1407–1416. doi: 10.1097/PAS.0b013e3181ef7b16. [DOI] [PubMed] [Google Scholar]
- 17.Saito Y, Sekine W, Sano R, et al. Potentiation of cell invasion and matrix metalloproteinase production by alpha3beta1 integrin-mediated adhesion of gastric carcinoma cells to laminin-5. Clin Exp Metastasis. 2010;27:197–205. doi: 10.1007/s10585-010-9314-3. [DOI] [PubMed] [Google Scholar]
- 18.Scheele S, Nystrom A, Durbeej M, et al. Laminin isoforms in development and disease. J Mol Med (Berl) 2007;85:825–836. doi: 10.1007/s00109-007-0182-5. [DOI] [PubMed] [Google Scholar]
- 19.Sehdev AS, Kurman RJ, Kuhn E, et al. Serous tubal intraepithelial carcinoma upregulates markers associated with high-grade serous carcinomas including Rsf-1 (HBXAP), cyclin E and fatty acid synthase. Mod Pathol. 2010;23:844–855. doi: 10.1038/modpathol.2010.60. [DOI] [PMC free article] [PubMed] [Google Scholar]
- 20.Tang S, Onuma K, Deb P, et al. Frequency of serous tubal intraepithelial carcinoma in various gynecologic malignancies: a study of 300 consecutive cases. Int J Gynecol Pathol. 2012;31:103–110. doi: 10.1097/PGP.0b013e31822ea955. [DOI] [PubMed] [Google Scholar]
- 21.Vang R, Visvanathan K, Gross A, et al. Validation of an Algorithm for the Diagnosis of Serous Tubal Intraepithelial Carcinoma. Int J Gynecol Pathol. doi: 10.1097/PGP.0b013e31823b8831. in press. [DOI] [PMC free article] [PubMed] [Google Scholar]
- 22.Visvanathan K, Vang R, Shaw P, et al. Diagnosis of serous tubal intraepithelial carcinoma based on morphologic and immunohistochemical features: a reproducibility study. The American journal of surgical pathology. 2011;35:1766–1775. doi: 10.1097/PAS.0b013e31822f58bc. [DOI] [PMC free article] [PubMed] [Google Scholar]
- 23.Witz CA, Takahashi A, Montoya-Rodriguez IA, et al. Expression of the alpha2beta1 and alpha3beta1 integrins at the surface of mesothelial cells: a potential attachment site of endometrial cells. Fertil Steril. 2000;74:579–584. doi: 10.1016/s0015-0282(00)00701-9. [DOI] [PubMed] [Google Scholar]
Associated Data
This section collects any data citations, data availability statements, or supplementary materials included in this article.


