Abstract
In this, the seventh iteration of the National Practice Benchmark, the authors made significant changes in the approach and analysis of the survey, including restructuring and shortening the survey instrument to facilitate the participation of hospital and academic oncology practices, in recognition of the ongoing changes in the oncology industry.
Introduction
This year marks the seventh year that we have analyzed data submitted voluntarily by oncology practices across the country to produce what is now known as the National Practice Benchmark (NPB). We have made significant changes in the way we approach and analyze the survey this year in recognition of the ongoing changes in oncology. Our survey instrument has been restructured and shortened to facilitate the participation of hospital and academic oncology practices. We have developed a minimum data set from which we can produce meaningful production statistics. In an effort to include all data that are reasonable, we have altered our analytic methodology to include individual data elements when we find them, even from practices that do not provide sufficient information to be included in the analytic data set. Although the profitability of buy-and-bill injectable chemotherapy and supportive care drugs arguably breaks even at Medicare rates, a well-managed pharmacy operation remains a necessary component of running an oncology practice. To more efficiently track the slim margins left in this line of business, we have changed our reporting for revenue and costs to show these net of the cost of drugs.
In last year's report, based on 2010 data,1 we discussed a transition from measuring physician work productivity on the basis of the number of new patients to measuring work relative value unit (wRVU) productivity and suggested that 6,000 wRVU be used as the productive capacity of each full-time equivalent (FTE) hematology/oncology (HemOnc) physician. The 2011 data supports a higher wRVU as a standard, and that is included in this report. Last year, we were surprised to find that many survey participants were significantly engaged in clinical research; to expand that section this year, we added questions that will start benchmarking that important activity. Last but not least, we designed the survey to allow us to segment the data to provide a discrete set of data representing the HemOnc business unit operations in practices that also include other specialties.
Minimum Data Set
Changes in the oncology industry, most notably decreasing margins for chemotherapy drugs and increases in practice expense, are believed to have driven significant numbers of physician-owned practices to associate themselves with hospitals, seeking refuge from the economic challenges of running a small business with declining margins. When this occurs, we believe that the oncologists generally continue to provide services to the same patients but under new management. Along with the new hospital management structure, there is frequently a loss of access to information about revenue and costs. The minimum data set was developed to allow practices without access to detailed financial data to continue to participate in the NPB in a meaningful way. For the minimum data set, we ask for basic counts of patients (both new and established) who have received services, as well as the number and type of staff who provide those services. With these data, we can benchmark production and, to some extent, capacity.
Data Validation and Inclusion
In past years, we have validated the data provided by the survey participants and have only included in the analytic data set those practices that have passed every requirement. In some instances, this all or none approach resulted in the exclusion of data that seemed valid but was submitted by a practice that did not meet all of the requirements for analytics. This year, we have included every reasonable data submission. As in the past, we continue to exclude data that just do not make any sense. Examples of such data errors include misplaced decimal points (which we attempt to validate with the submitting practice when possible) or transposing FTE staff numbers and staff salary information on the survey form. New this year, we are reporting the numerical average and also the average calculated without the highest and lowest values reported. Although this doesn't have a big impact on the average in most cases, sometimes it does make a material difference and, we believe, offers a more accurate measure.
Net Revenue and Net Drug Revenue
For many years, we have encouraged practices to report practice revenue after deducting the cost of the drugs that were used to produce that revenue. For a variety of reasons, this accounting practice has not been widely adopted. As the cost of the drugs used in oncology is so high and increases every year, stating revenue without deducting this significant cost leads to an overstatement of the revenue generation of a medical oncology practice. This results in the creation of the perception that the medical oncology practice is very profitable because of the high revenue generated per medical oncologist. That perception is dangerous to the management of the business unit given that it can and does lead to a false sense of security.
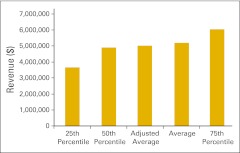
In this year's NPB, we report revenue net of the cost of the drugs used to produce the revenue. The effect of this is to capture only the gross margin attributable to drugs as revenue. For example, the total revenue per FTE medical oncologist in 2011 was $4,963,033. When the cost of drugs is subtracted the net revenue is $2,050,246. Almost $3,000,000 in top-line revenue per FTE HemOnc is just passing through and is not available for practice operations. The top-line revenue per FTE HemOnc is $2,000,000, from which all the operating costs to run the practice must be paid. In accounting terms, we treat the cost of drugs not as operating costs but as the cost of goods sold. This change in how to capture the cost of drugs in the accounting process results in a much more balanced view about the relative contributions to revenue made by the various business units within the practice. We continue to encourage all oncology practices to adopt this accounting convention to achieve more efficient management.
HemOnc Productivity
In 2008, we introduced the concept of a standard HemOnc physician on the basis of the number of new patients being seen per HemOnc physician. At that time, we set 350 new patients per year as the standard. Production of various measurements with standard HemOnc physician as the denominator proved more reliable than reporting the same metric using the practice estimate of the number of FTE HemOnc physicians. In 2011, we introduced another measure of the standard HemOnc physician on the basis of wRVU. Data that first year supported the use of 6,000 wRVU as standard work production for one FTE HemOnc physician. The data this year are quite convincing, and we are raising the standard wRVU to 7,000 per FTE HemOnc physician per year. Additionally, we are reporting several other wRVU measurements so that a standard HemOnc physician can be calculated in settings for which it is not plausible to measure total wRVU production.
Methodology
Approximately 1,400 medical oncologists, practice administrators, and other key staff members from more than 900 practices and institutions across the country were invited to participate in the 2012 NPB. Participants were invited via e-mail, and the survey was completed entirely online. Practices were instructed to submit only one survey per practice; multiple results from the same practice were deleted.
Respondents were offered incentives for participation. Those completing the minimum data set received a copy of the survey report, and the first 50 minimum data set respondents also received a $25 e-gift certificate. Respondents completing the full survey and whose data passed the validation process received a full survey report, a practice-specific benchmarking analysis, and a $25 e-gift certificate.
The NPB survey instrument reflects data from calendar year 2011 or the most recently completed 12-month accounting period. Practices were not required to answer all questions, and data from incomplete surveys are included in the final survey results. Data were submitted by HemOnc single-specialty practices as well as by multispecialty practices.
Confidentiality
Oncology Metrics is committed to protecting the confidentiality of individual practice data and makes a data commitment to NPB participants: “All of the individual data that you provide in the survey is absolutely confidential and will never be disclosed. Access to the data file that Oncology Metrics creates from this survey will never be made available to any party. Oncology Metrics will create analytic reports including aggregated data from this survey but will always publish in a manner that completely obscures the source of the data so that no reader can make any supported inference of data to any individual practice.”
Understanding the NPB Report
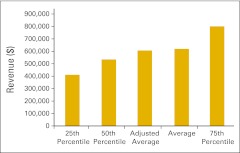
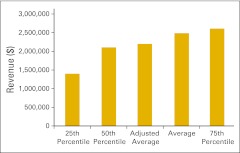
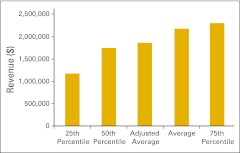
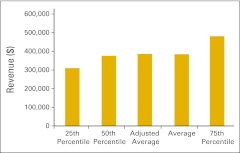
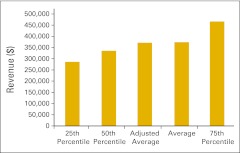
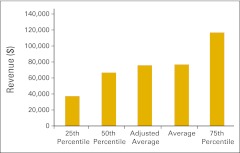
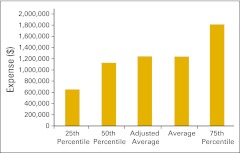
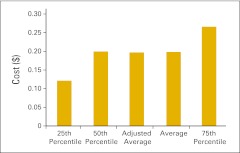
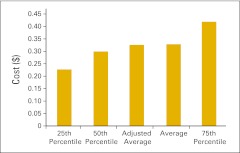
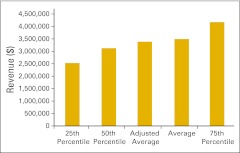
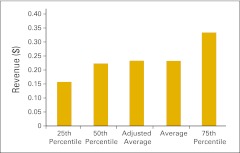
NPB data are presented in an easy-to-understand format using pie charts and bar graphs. NPB data is generally presented in vertical bar graphs using 25th percentile, 50th percentile (or median), average, and 75th percentile. As mentioned previously, in addition to reporting the numerical average, this year we are also reporting the average calculated without the highest and lowest values (adjusted average). Although this does not have a big impact in most cases, there are benchmarks for which it does make a material difference. This allows us to responsibly include more data contributors while still offering our best efforts to keep the underlying data reasonable.
When interpreting this data, remember that a percentile is a point on a scale below which a certain percent of responses fall. For example, the 75th percentile is the point in a distribution of data below which 75% of responses fall. Likewise, the 25th percentile is the point below which 25% of responses fall. Note that a percentile may or may not correspond to a value judgment about whether it is good or bad. The interpretation of whether a certain percentile is good or bad depends on the context to which the data applies. In some situations, a low percentile would be considered good—for example, number of days sales outstanding. In other contexts, a high percentile might be considered good—for instance, the number of new patients per FTE HemOnc physician.
Our continued goal in producing and presenting this report is to provide readers with a valuable tool to evaluate one's own practice and manage in today's complex health care environment. We have not attempted to draw conclusions from these data in this article but refer you to our article in the regular issue of Journal of Oncology Practice.2
Respondent Demographics
A total of 114 survey responses were submitted: 11 were determined to be duplicates and were discarded. Respondents identified their roles in the practice as practice administrator/office manager (52% of respondents), chief financial officer/director of finance (16%), physician (8%), billing manager (4%), registered nurse (4%), chief executive officer/executive director (3%), pharmacist (2%), and other (8%). Responses were received from 42 states. Seven states—California, Florida, Illinois, Indiana, Michigan, Ohio, and Tennessee—had responses from five or more practices. There were no responses from practices in Hawaii, Kansas, Louisiana, Minnesota, North Dakota, Oregon, Rhode Island, or Wyoming. The number of practices responding to individual questions varied.
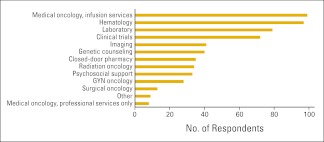
Survey participants from 96 practices reported an average of 8.1 FTE HemOnc physicians per practice for a total of 777 FTE HemOnc physicians in the data set. Thirty-six of these practices also reported 136 physicians in specialties other than HemOnc for a total of 913 FTE physicians (all specialties) in the survey population. Figure 1 shows the services provided by the reporting practices. Responses in the “Other” category include dietician, endocrine oncology, full complement of patient and family support services, interventional oncology, wellness center, complementary therapy, retail pharmacy, and survivorship. Practices reported an average of 3.5 clinical sites per practice, 0.55 clinical sites per FTE HemOnc physician, and just over five chemotherapy chairs per FTE HemOnc physician.
Figure 1.
Services provided by the practice (n = 103 practices). GYN, gynecologic.
Practice Operations and Planning
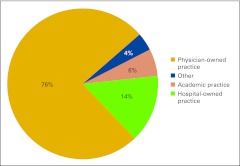
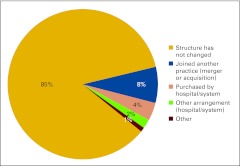
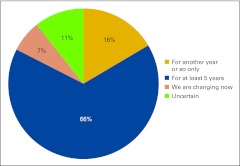
Practices described their current business structure from a list of four options: physician-owned private practice, hospital-owned practice, academic practice, and other (Fig 2). Physician-owned private practice continues to represent the majority of the survey respondents at 76%, which is down from 86% in last year's survey. We see an increase in hospital-owned practices participating in the NPB this year from 10% last year to 14%, as well as an increase in academic practice participation from 1% to 6%. We believe this represents current shifts in the marketplace; although in a new question this year, 85% of respondents indicated that practice structure has not changed (Fig 3). Practices were asked to indicate how long they expected their current business structure to remain unchanged and viable (Fig 4) and two thirds of respondents believe their current business structures will remain viable for at least 5 years.
Figure 2.
Current business structure (n = 103 practices).
Figure 3.
Business structure changes in the last year (n = 103 practices).
Figure 4.
Responses to survey question “How long do you expect your current business structure will remain unchanged and viable?” (n = 103 practices).
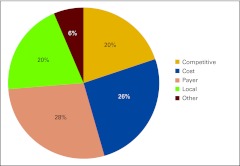
We repeated a question that was new in last year's survey, asking respondents to rank the pressures that impact their business decisions (Fig 5). Five options were provided and described:
Competitive Pressures (eg, market competition)
Cost Pressures (eg, drug costs, rent, staff costs, physician compensation, general operating costs)
Payer Pressures (eg, declining reimbursement rates, contracting challenges, preauthorization/precertification requirements, retrospective denials, audits, underinsured patients)
Local Economic Pressures (eg, patient job loss, uninsured or underinsured patients, increasing copays)
Other
Many respondents included comments about the pressures they are facing (Table 1). These comments reflect a range of challenges that face today's oncology practice.
Figure 5.
Responses to survey question “What pressures are currently impacting your business decisions?” (n = 102 practices).
Table 1.
Respondent Comments Regarding Pressures Impacting Business Decisions
| Comment |
|---|
| “Staffing shortage” |
| “Retiring physicians” |
| “Regional health care networks evolving” |
| “Health care reform” |
| “Our competition is a cancer clinic, directly across the street, that is owned by a disproportionate-share hospital. This allows them to purchase drugs at pennies on the dollar when compared to our pricing. Yet, we compete openly with them for the local demographic.” |
| “Local provider select care” |
| “Litigation” |
| “Legislative and regulatory restrictions in Massachusetts” |
| “Increased regulations” |
| “Hospitals buying referral sources and making those practices refer to their cancer center” |
| “Hospital changes” |
| “Expansion” |
| “Employee job loss” |
| “Drug shortages” |
| “Difficulty recruiting qualified physicians” |
| “Compliance/5010/ICD-10” |
| “Change in management personnel” |
| “Cash flow, because of ANSI 5010 issues in the beginning of 2012” |
| “Actually, they are all impacting our business!” |
Abbreviations: ANSI, American National Standards Institute; ICD-10, International Classification of Disease 10th revision.
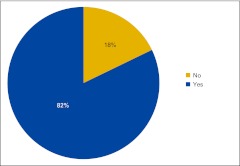
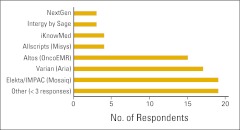
Practices were once again asked if they use an electronic medical record (EMR), and 82% of this year's respondents indicated that they do (Fig 6). Figure 7 shows the number of respondents using specific EMR systems. EMRs are listed by name if they received at least three survey responses.
Figure 6.
Responses to survey question “Does your practice currently use an electronic medical record?” (n = 101 practices).
Figure 7.
Electronic medical record (EMR) systems used by survey respondents (n = 83 practices).
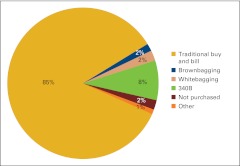
Another repeat question from last year's survey asked respondents to identify how drugs are procured by the practice (Fig 8). Practices were instructed to estimate the percentage by dollar amount in each of six categories (including “other”) for the 12-month period. The categories included:
traditional buy and bill (the business entity purchases drugs and bills payers),
brownbagging (drugs are ordered through a specialty pharmacy or preferred provider who delivers to the patient who then transports to the office),
whitebagging (drugs are ordered through a specialty pharmacy or preferred provider and then delivered directly to the practice),
340B (federal program in which qualified entities [such as disproportionate share hospitals] can purchase drugs at significant discounts),
not purchased (drugs are not purchased by the responding practice), and
other.
It is interesting to note that some practices purchasing drugs through the 340B program indicated that they did not purchase all drugs through this program. Many practices provide services in a variety of practice settings, and the methodology of drug purchasing can vary by setting. Our data show that drug purchases made by the responding practices are proportionate to the percentage of patients being cared for in 340B-eligible settings. Fewer than half of the survey respondents indicating drug purchases through the 340B program reported 100% of all drug purchases being made in this manner.
Figure 8.
Responses to survey question “How are drugs purchased/procured by your practice?” (n = 100 practices).
Practice Guidelines and Clinical Pathways
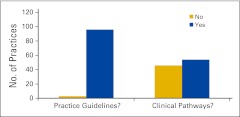
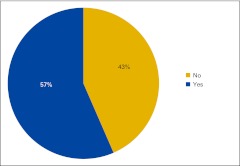
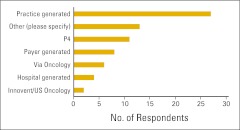
Survey respondents were asked whether the physicians in the practice use practice guidelines and/or clinical pathways (Fig 9). For survey purposes, practice guidelines were defined as evidence-based recommendations for treatment and clinical pathways as standard protocols for treatment-specific groups of patients with cancer; standardization of care processes is a key element. Additional questions were asked about the use of clinical pathways. Figure 10 shows the percentage of respondents not currently using clinical pathways who intend to implement them in the next year, and Figure 11 shows the source of clinical pathways used by the responding practices. Among the responses listed under “other” were the American Society of Clinical Oncology (ASCO), ASCO's Quality Oncology Practice Initiative, National Comprehensive Cancer Network guidelines, Cancer Clinics of Excellence, Oncology Physician Resource's EOBOne, “state society does this with a payer,” and McKesson's Regimen Profiler.
Figure 9.
Responses to survey question “Do the physicians in your practice regularly use practice guidelines or clinical pathways for patient care?” (n = 100 practices).
Figure 10.
Percentage of respondents not currently using clinical pathways who intend to implement them in the next year (n = 46 practices).
Figure 11.
Source of clinical pathways used by survey respondents (n = 71 practices). P4, P4 Healthcare.
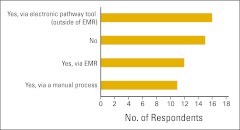
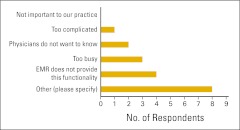
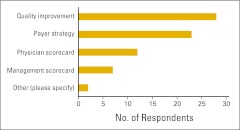
The use of clinical pathways was explored a bit further, and survey participants were asked whether (and how) they routinely measure physician compliance with clinical pathways (Fig 12). Practices not measuring compliance were asked for a reason (Fig 13). In contrast to last year's results, far fewer practices indicated that they were “too busy” to measure compliance this year, and no one said “not important to our practice.” Several practices answered “other” and were asked to specify a reason (Table 2). Finally, practices were asked how they use clinical pathway data (Fig 14).
Figure 12.
Responses to survey question “Do you routinely measure physician compliance with clinical pathways?” (n = 54 practices). EMR, electronic medical record.
Figure 13.
Reasons given for not measuring compliance with clinical pathways (n = 18 practices). EMR, electronic medical record.
Table 2.
Responses to Request to Specify “Other” Reasons for Not Measuring Compliance With Clinical Pathways
| Reason |
|---|
| “Carriers dictate compliance and track” |
| “For the two payers that we use pathways for the patients of, they monitor our compliance” |
| “We are in the process of finding an EMR system that will work for our practice and then we will implement this process for our practice” |
| “Not needed; physician self-monitors” |
| “Evaluating different payers, different pathways” |
| “Although the physicians recognize the benefits of standardized pathways and use them, they do not want independent decision making to be compromised” |
| “Will be measuring physician compliance in the near future” |
| “Would need an EMR at this point; too busy” |
Abbreviation: EMR, electronic medical record.
Figure 14.
Responses to question “How do you use clinical pathway data?” (n = 72 practices).
Benchmarks
As described in the Introduction section, this year we have altered our analytic methodology to include individual data elements from all practices providing credible results, even if practices did not provide complete data sets. We have continued to exclude specific data points when the data are outside the range of credible results. Because of these changes, the number of respondents for each benchmark vary, but the overall result is a larger comparative data set, and we believe this to be beneficial to both participants and readers. Benchmarks are presented in the categories of wRVU metrics, HemOnc physician productivity, revenue, practice expense, pharmacy operations, clinical trials, and staffing and productivity.
wRVU Metrics
wRVU can be used to measure physician productivity. wRVU is the measure of the physician work component that is assigned to each procedure code in the Resource-Based Relative Value System. This is the system used by the Centers for Medicare and Medicaid Services and most other payers to assign reimbursement amounts to all procedure codes. Productivity, measured using wRVUs, is becoming an increasingly important management tool for oncology practices in all settings.
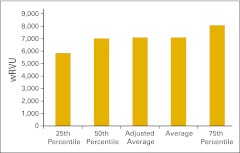
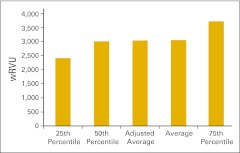
Practices were asked to report wRVU for services rendered in the HemOnc business unit of the practice in several specific categories as well as the total HemOnc wRVU for the 12-month period. Total wRVU includes wRVU associated with all procedures rendered incident to and by the HemOnc physicians in office and hospital settings. These include evaluation and management services, chemotherapy administration, and all procedures. Figure 15 shows the total wRVU per FTE HemOnc physician. As we mentioned in the Introduction section, we have established 7,000 total wRVU as the production capacity for a standard HemOnc physician. This is simply a standard, not a goal, and we have seen many practices with wRVU both much higher and much lower than 7,000, but we believe this is a reasonable industry standard on the basis of 2011 data.
Figure 15.
Total work relative value unit (wRVU) per full-time equivalent hematology/oncology physician (n = 44 practices).
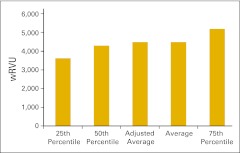
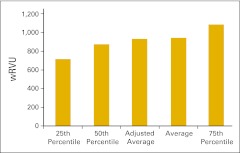
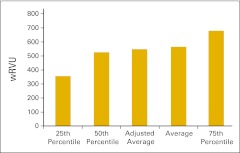
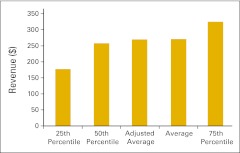
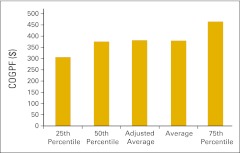
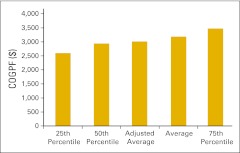
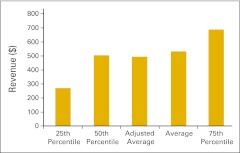
Figure 16 presents total wRVU per FTE provider, defined as HemOnc physicians and nonphysician practitioners working in the HemOnc business unit of the practice. Figure 17 shows the wRVU for only office evaluation and management services per FTE HemOnc physician. Practices unable to report total wRVU may find this benchmark particularly useful. wRVU for chemotherapy administration services is presented in Figures 18 (per FTE HemOnc physician) and 19 (per FTE chemotherapy administration staff). Net medical revenue, defined as total medical revenue less the cost of drugs, per wRVU is reported in Figure 20. Cost of goods paid for (COGPF), defined as the total of all money paid for drugs in the period less rebates or other cost reductions taken in the same period, is reported per total wRVU (Fig 21) and per wRVU for chemotherapy administration services (Fig 22). Finally, we report net drug revenue (total drug revenue less COGPF) per wRVU for chemotherapy administration services in Figure 23.
Figure 16.
Total work relative value unit (wRVU) per provider (full-time equivalent hematology/oncology physician and nonphysician practitioners; n = 36 practices).
Figure 17.
Work relative value unit (wRVU) for office evaluation and management services only per full-time equivalent hematology/oncology physician (n = 58 practices).
Figure 18.
Work relative value unit (wRVU) for chemotherapy administration services per full-time equivalent hematology/oncology physician (n = 42 practices).
Figure 19.
Work relative value unit (wRVU) for chemotherapy administration services per full-time equivalent chemotherapy administration staff (n = 37 practices).
Figure 20.
Net medical revenue per total work relative value unit (n = 29 practices).
Figure 21.
Cost of goods paid for (COGPF) per total work relative value unit (n = 38 practices).
Figure 22.
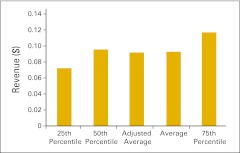
Cost of goods paid for (COGPF) per work relative value unit for chemotherapy administration services (n = 38 practices).
Figure 23.
Net drug revenue per work relative value unit for chemotherapy administration services (n = 33 practices).
Patient Visits
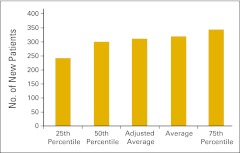
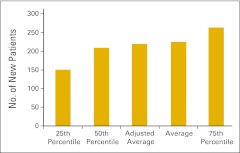
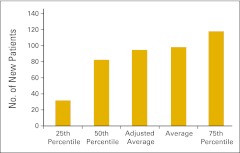
Although we have transitioned to wRVU as the key measure of physician productivity, new patient flow into a practice continues to be an important measure of productivity and practice health and is an essential management tool for strategic planning. Practices were asked to report the number of new HemOnc patients seen in the practice in the 12-month reporting period according to place of service—office or inpatient hospital. A new patient is defined as a patient who has not received services in the practice in the last three years. We report the total number of new patients (Fig 24), the number of new patients seen in the office setting (Fig 25), and number of new patients seen in the hospital setting (Fig 26).
Figure 24.
Total number of new patients per full-time equivalent hematology/oncology physician (n = 81 practices).
Figure 25.
Number of new patients seen in the office setting per full-time equivalent hematology/oncology physician (n = 86 practices).
Figure 26.
Number of new patients seen in the hospital setting per full-time equivalent hematology/oncology physician (n = 79 practices).
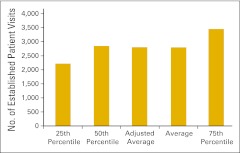
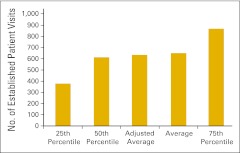
Established patient visit counts were also reported by survey participants. Figure 27 presents the number of established patient visits in the office setting (codes 99212-99215) per FTE HemOnc physician, whereas Figure 28 shows the number of established patient visits in the hospital setting (codes 99217-99220, 99221-99223, 99231-99233, 99234-99236, and 99238-99239).
Figure 27.
Number of established patient visits in the office setting per full-time equivalent hematology/oncology physician (n = 58 practices).
Figure 28.
Number of established patient visits in the hospital setting per full-time equivalent hematology/oncology physician (n = 57 practices).
Revenue
The survey instrument defined revenue as cash collections for the period as reported on the practice's profit and loss statement, or all the money received by the business entity during the year for any service regardless of when that service was provided. Additional pertinent definitions follow:
Total revenue is defined as all collected revenue for the period, medical revenue plus nonmedical revenue (such as medical directorships or publication revenue).
Total net revenue is total revenue less COGPF.
Total medical revenue is total revenue less nonmedical revenue.
Net medical revenue is total revenue less nonmedical revenue less COGPF less radiation oncology (RadOnc) revenue.
Net drug revenue is drug revenue less COGPF.
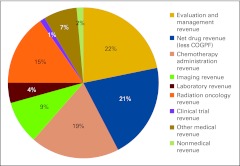
Figure 29 presents the revenue mix for all practices reporting in each category; the number of respondents varies from one category to the next. Please note an important change from previous years' survey results: drug revenue is reported as net drug revenue—that is, total drug revenue less COGPF.
Figure 29.
Revenue mix by service line (number of respondents varies by service line). COGPF, cost of goods paid for.
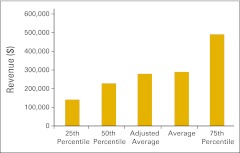
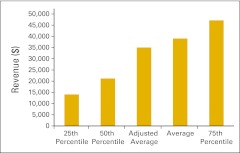
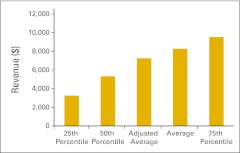
Figures 30 through 36 present revenue data per FTE HemOnc physician for a variety of practice components. Figures 37 and 38 present RadOnc revenue, first per “FTE other physician” and then per FTE physician. “FTE other physician” is defined as a physician in any specialty other than HemOnc. Although we did not ask practices to specifically report the number of FTE RadOnc physicians this year, we assume that most of the physicians reported as “other” are in fact RadOnc physicians. FTE physician is defined as all reported physicians in all specialties in the practice, including HemOnc.
Figure 30.
Total revenue per full-time equivalent hematology/oncology physician (n = 50 practices).
Figure 36.
Imaging revenue per full-time equivalent hematology/oncology physician (n = 26 practices).
Figure 37.
Radiation oncology revenue per full-time equivalent “other” physician (n = 16 practices).
Figure 38.
Radiation oncology revenue per full-time equivalent physician (n = 19 practices).
Figure 31.
Total net revenue per full-time equivalent hematology/oncology physician (n = 42 practices).
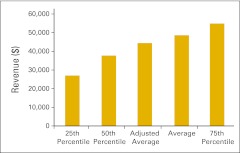
Figure 32.
Net medical revenue per full-time equivalent hematology/oncology physician (n = 37 practices).
Figure 33.
Evaluation and management revenue per full-time equivalent hematology/oncology physician (n = 51 practices).
Figure 34.
Chemotherapy administration revenue per full-time equivalent hematology/oncology physician (n = 51 practices).
Figure 35.
Laboratory revenue per full-time equivalent hematology/oncology physician (n = 44 practices).
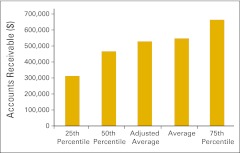
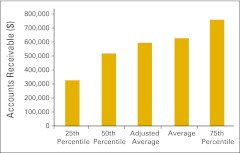
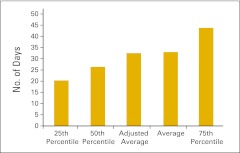
Accounts receivable and days sales outstanding are important measures of practice revenue cycle management. Survey participants were asked to report collectible accounts receivable—defined as gross accounts receivable less contractual allowances less allowance for bad debt less allowance for charity care—at the end of the 12-month reporting period. Figures 39 and 40 report collectible accounts receivable per FTE physician and per FTE HemOnc physician. Business days sales outstanding is a measure of the time that it takes to collect revenue from payers and patients for services that have already been provided. This is calculated by dividing net accounts receivable by average collections per business day (254 business days per year) and is reported in Figure 41.
Figure 39.
Collectible accounts receivable per full-time equivalent physician (n = 43 practices).
Figure 40.
Collectible accounts receivable per full-time equivalent hematology/oncology physician (n = 43 practices).
Figure 41.
Business days sales outstanding (n = 41 practices).
Practice Expense
Total practice expense is defined as all expenses paid for the practice for the reporting period. This includes COGPF and all W-2 salaries (including physicians). Additional definitions for various elements of the practice expense benchmarks follow:
Total operating expense is total practice expense less W-2 HemOnc physician compensation.
Net operating expense is total practice expense less HemOnc physician compensation less COGPF.
Information technology direct expense includes software, hardware, license fees, interfaces, support, maintenance, upgrades, information technology staff (W-2 salary)—all reported on a cash basis (if hardware and/or software are capitalized, respondents were instructed to report only the depreciation during the reporting period).
HemOnc labor cost is total W-2 staff expense for all staff supporting the HemOnc business unit of the practice.
HemOnc net medical revenue is total revenue less COGPF less nonmedical revenue less clinical trial revenue less RadOnc revenue.
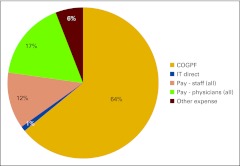
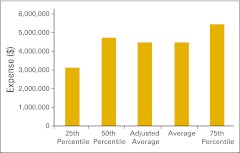
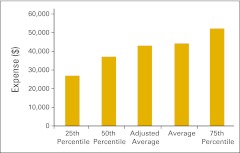
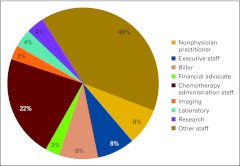
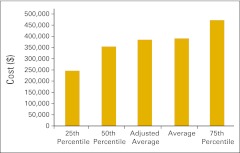
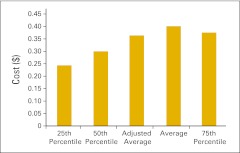
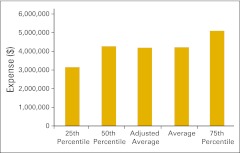
Figure 42 presents the practice expense mix for all practices reporting in each category. Note that the number of respondents varies from one category to the next. Figures 43 through 47 present several important practice expense metrics. Figure 48 shows a HemOnc labor expense mix for all practices reporting in each category. Again, the number of respondents reporting varies from one category to the next. Finally, Figures 49 through 52 detail elements of HemOnc labor costs. Additional staffing information is provided later in this report.
Figure 42.
Practice expense mix (number of respondents varies by category). COGPF, cost of goods paid for.
Figure 43.
Total practice expense per full-time equivalent hematology/oncology physician (n = 47 practices).
Figure 47.
Information technology direct expense per full-time equivalent physician (n = 45 practices).
Figure 48.
Hematology/oncology labor expense mix (number of respondents varies by category).
Figure 49.
Hematology/oncology HemOnc labor cost per full-time equivalent HemOnc physician (n = 45 practices).
Figure 52.
Chemotherapy administration staff labor cost as a percentage of total hematology/oncology labor cost (n = 43 practices).
Figure 44.
Total operating expense per full-time equivalent hematology/oncology physician (n = 44 practices).
Figure 45.
Net operating expense per full-time equivalent hematology/oncology physician (n = 44 practices).
Figure 50.
Hematology/oncology (HemOnc) labor cost as a percentage of HemOnc net medical revenue (n = 31 practices).
Figure 51.
Chemotherapy administration staff labor cost as a percentage of chemotherapy administration revenue (n = 46 practices).
Pharmacy Operations
As mentioned in the Introduction section, pharmacy operations—the so-called buy-and-bill business—remains an important and necessary component of running an oncology practice. Drug purchases represent the largest expense incurred by oncology practices, and margins on those purchases are slim; there is no room for error. Figures 53 through 58 (plus COGPF per FTE HemOnc physician in Fig 46) present several pharmacy operations benchmarks. The following definitions will be helpful to the reader in reviewing these benchmarks:
Total drug revenue is total collected revenue for drugs.
Net drug revenue is total drug revenue less COGPF.
Net drug revenue as a percentage of total revenue and net drug revenue as a percentage of total net revenue are two measures of drug margin. Total net revenue (net of COGPF) is the most accurate and valuable benchmark of revenue for the oncology practice.
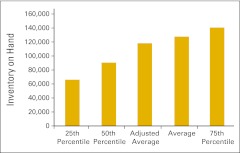
Inventory is the drug inventory on hand at the end of the 12-month reporting period.
Point-of-care pharmacy services are increasingly available in oncology practices. A closed-door pharmacy is a licensed entity that provides retail pharmacy services to patients and employees of the practice but is not available to the public at large. A dispensing unit is a nonlicensed entity that allows physicians to stock and dispense medications (generally oral) to patients of the practice. Figure 59 shows the percentage of respondents dispensing medications in their practice with these point-of-care systems. It is important to note that pharmacy dispensing laws vary dramatically from state to state, and practices are advised to thoroughly research state law before considering these services for their practice.
Figure 53.
Total drug revenue per full-time equivalent hematology/oncology physician (n = 52 practices).
Figure 58.
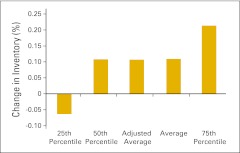
Change in drug inventory as a percentage of beginning inventory in 2011 (n = 38 practices).
Figure 46.
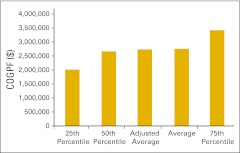
Cost of goods paid for (COGPF) per full-time equivalent hematology/oncology physician (n = 48 practices).
Figure 59.
Responses to survey question “Do you dispense medications to patients via (A) a closed-door pharmacy or (B) a dispensing unit?” (n = 99 practices).
Figure 54.
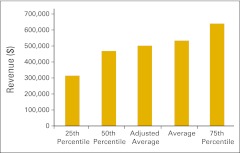
Net drug revenue per full-time equivalent hematology/oncology physician (n = 43 practices).
Figure 55.
Net drug revenue as a percentage of total revenue (n = 40 practices).
Figure 56.
Net drug revenue as a percentage of total net revenue (n = 40 practices).
Figure 57.
Inventory on hand per full-time equivalent hematology/oncology physician (n = 44 practices).
Net point-of-care pharmacy revenue is defined as total point-of-care pharmacy revenue less point-of-care pharmacy COGPF and is presented in Figure 60.
Figure 60.
Net point-of-care pharmacy revenue per full-time equivalent physician (n = 12 practices).
Clinical Trials
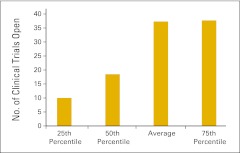
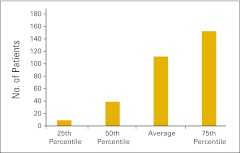
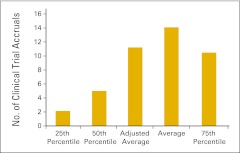
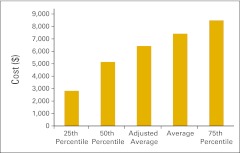
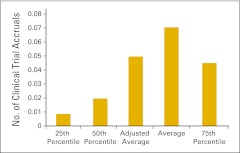
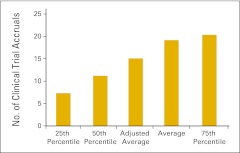
Almost three quarters of the survey respondents (n = 103) indicated that they perform clinical trials in their practices. Figures 61 and 62 report the number of clinical trials open at the end of 2011 and the number of patients accrued to trials in 2011, respectively. Readers will note a wide variation in the responses to these data points. Figures 63 through 68 present clinical trial accrual and revenue benchmarks.
Figure 61.
Number of clinical trials open at the end of 2011 per practice (n = 74 practices).
Figure 62.
Number of patients accrued to clinical trials in 2011 per practice (n = 74 practices).
Figure 63.
Number of clinical trial accruals per full-time equivalent hematology/oncology physician (n = 57 practices).
Figure 68.
Research staff labor cost per accrual (n = 28 practices).
Figure 64.
Number of clinical trial accruals per new patient visit (n = 55 practices).
Figure 65.
Number of clinical trial accruals per full-time equivalent research staff (n = 30 practices).
Figure 66.
Clinical trial revenue per full-time equivalent hematology/oncology physician (n = 29 practices).
Figure 67.
Clinical trial gross revenue per accrual (n = 29 practices).
Staffing and Productivity
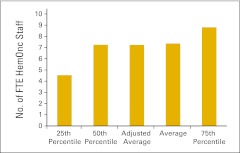
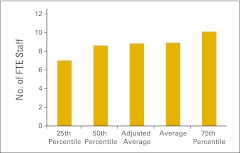
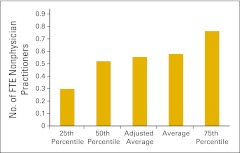
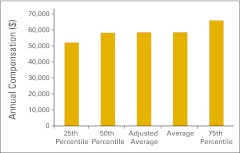
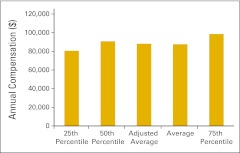
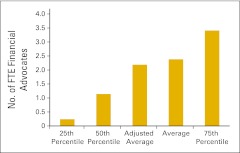
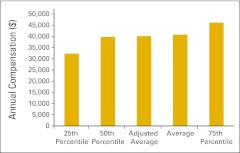
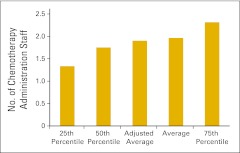
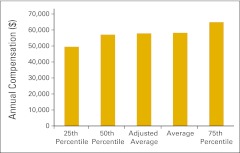
Staffing information was collected and reported in categories as presented in Table 3. Staffing information is reported per FTE physician for some categories (such as executive staff and billing staff) that support all specialties in a multispecialty practice. Other staff categories, such as chemotherapy administration staff, are reported per FTE HemOnc physician. FTE HemOnc staff per FTE HemOnc physician is reported in Figure 69, and all FTE staff per FTE physician are shown in Figure 70. Number of staff and annual compensation by specific staff categories are reported in Figures 71 through 87.
Table 3.
Staffing Categories and Definitions
| Category | Definition | Figure |
|---|---|---|
| Staff all | All staff working in all departments/specialties in the practice; includes nonphysician practitioners; does not include physicians | 70 |
| HemOnc staff | All staff in the HemOnc line of business in the practice; includes nonphysician practitioners; does not include physicians | 69 |
| Nonphysician practitioner | Includes nurse practitioners and physician assistants working the HemOnc line of business | 71, 72 |
| Executive staff | Includes all executive and senior management staff in all departments/specialties in the practice; includes all staff who report to the physician executive or the board; also includes the physician executive; does not include department-level supervisors | 73, 74 |
| Chemotherapy administration staff | Includes all staff responsible for drug purchasing, mixing, delivery to patients, and management of these processes; reported on an FTE basis; based on percentage of time all staff spend on these activities | 79, 80, 88 |
| Billing staff | Includes all staff in the billing and collecting process in the practice for all departments/specialties; does not include patient financial advocates | 75, 76, 89 |
| Financial advocate | Includes all staff in the patient financial advocate or financial counseling process in the practice for all departments/specialties | 77, 78 |
| Research staff | Includes all staff performing clinical research and research clerical support; does not include physician research time | 81, 82, 83 |
| Laboratory staff | Includes all laboratory staff employed by the practice | 84, 85 |
| Imaging staff | Includes all imaging staff employed by the practice | 86, 87 |
Abbreviations: FTE, full-time equivalent; HemOnc, hematology/oncology.
Figure 69.
Full-time equivalent (FTE) hematology/oncology (HemOnc) staff per FTE HemOnc physician (n = 53 practices).
Figure 70.
Full-time equivalent (FTE) staff per FTE physician (n = 51 practices).
Figure 71.
Full-time equivalent (FTE) nonphysician practitioners per FTE hematology/oncology physician (n = 43 practices).
Figure 87.
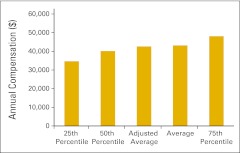
Annual compensation per full-time equivalent imaging staff (n = 22 practices).
Figure 72.
Annual compensation per full-time equivalent nonphysician practitioner (n = 41 practices).
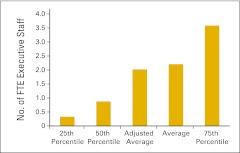
Figure 73.
Full-time equivalent (FTE) executive staff per FTE physician (n = 50 practices).
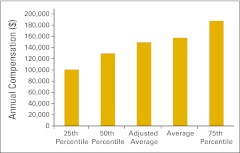
Figure 74.
Annual compensation per full-time equivalent executive staff (n = 46 practices).
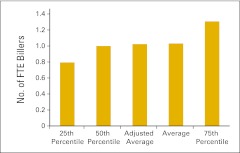
Figure 75.
Full-time equivalent (FTE) biller per FTE physician (n = 49 practices).
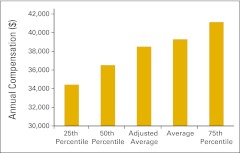
Figure 76.
Annual compensation per full-time equivalent biller (n = 45 practices).
Figure 77.
Full-time equivalent (FTE) financial advocate per FTE physician (n = 47 practices).
Figure 78.
Annual compensation per full-time equivalent financial advocate (n = 43 practices).
Figure 79.
Full-time equivalent chemotherapy administration staff per full-time equivalent hematology/oncology physician (n = 49 practices).
Figure 80.
Annual compensation per full-time equivalent chemotherapy administration staff (n = 48 practices).
Figure 81.
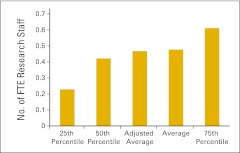
Full-time equivalent (FTE) research staff per FTE physician (n = 30 practices).
Figure 82.
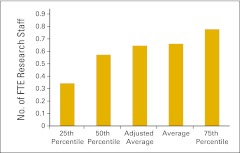
Full-time equivalent (FTE) research staff per FTE hematology/oncology physician (n = 30 practices).
Figure 83.
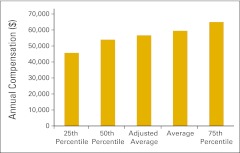
Annual compensation per full-time equivalent research staff (n = 28 practices).
Figure 84.
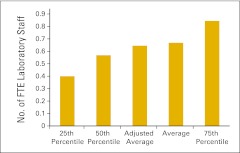
Full-time equivalent (FTE) laboratory staff per FTE physician (n = 40 practices).
Figure 85.
Annual compensation per full-time equivalent laboratory staff (n = 36 practices).
Figure 86.
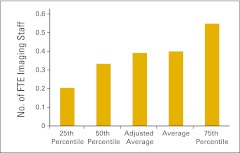
Full-time equivalent (FTE) imaging staff per FTE physician (n = 23 practices).
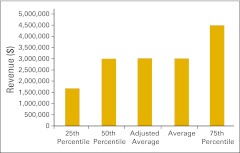
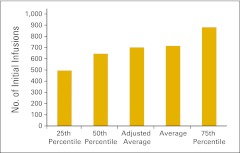
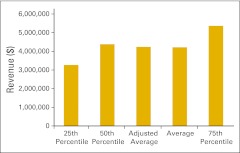
Productivity measures are reported in Figures 88 and 89. Figure 88 reports the number of initial infusions per FTE chemotherapy administration staff. The number of initial infusions is a count of the initial drug administration codes (as defined in the coding manual) billed by the practice during the period and includes initial infusions, initial hydrations, and initial intravenous push services. Each patient receiving infusion services is billed for one—and only one—of these initial drug administration codes, and therefore, these codes become a surrogate for the number of patients receiving infusion services. Interestingly, this number has varied considerably in the last several years. We do not have an explanation for this phenomenon. Additionally, we report collected revenue per FTE billing staff (Figure 89) as a productivity measure for the billing department. This number has been steady at approximately $4,000,000 for the last several years.
Figure 88.
Initial infusions per full-time equivalent chemotherapy administration staff (n = 46 practices).
Figure 89.
Total revenue per full-time equivalent biller (n = 44 practices).
Closing Thoughts
Although we believe that this work represents the most complete compilation of oncology practice data available today, there are some limitations that should be acknowledged. First, of course, is the relatively small sample size and the fact that practices self-select for participation. The NPB has been criticized as a picture of only the practices that are doing well. We accept that criticism and suggest that other practices learn from the data presented. Additionally, the survey respondents are not consistent from one year to the next, which makes comparisons somewhat inaccurate. Despite these limitations, we are confident in our data and know of many practices that have used the NPB as a tool for practice improvement. We present it to the readers with that goal.
Acknowledgments
Oncology Metrics, a division of Altos Solutions, develops information products and services for the oncology community to help accelerate advancements in the treatment of cancer. Oncology Metrics has built networks of community-based oncology practices from which it gathers financial, operational, and clinical information and aggregates the information to provide a platform of knowledge-based products and services. The cornerstone of Oncology Metrics' approach is to promote the discovery and adoption of best practices. Oncology Metrics' customers include oncology care providers and all organizations involved in the quest to improve cancer diagnosis and treatment.
Authors' Disclosures of Potential Conflicts of Interest
Although all authors completed the disclosure declaration, the following author(s) and/or an author's immediate family member(s) indicated a financial or other interest that is relevant to the subject matter under consideration in this article. Certain relationships marked with a “U” are those for which no compensation was received; those relationships marked with a “C” were compensated. For a detailed description of the disclosure categories, or for more information about ASCO's conflict of interest policy, please refer to the Author Disclosure Declaration and the Disclosures of Potential Conflicts of Interest section in Information for Contributors.
Employment or Leadership Position: Elaine L. Towle, Oncology Metrics, a division of Altos Solutions (C); Thomas R. Barr, Oncology Metrics, a division of Altos Solutions (C); James L. Senese, Oncology Metrics, a division of Altos Solutions (C) Consultant or Advisory Role: None Stock Ownership: None Honoraria: None Research Funding: None Expert Testimony: None Other Remuneration: None
Author Contributions
Conception and design: All authors
Administrative support: Elaine L. Towle, Thomas R. Barr
Collection and assembly of data: Elaine L. Towle, Thomas R. Barr
Data analysis and interpretation: All authors
Manuscript writing: All authors
Final approval of manuscript: All authors
References
- 1.Barr TR, Towle EL. National oncology practice benchmark, 2011 report on 2010 data. J Oncol Pract. 2011;7(suppl):67s–82s. doi: 10.1200/JOP.2011.000402. [DOI] [PubMed] [Google Scholar]
- 2.Barr TR, Towle EL. Oncology practice trends from the national practice benchmark. J Oncol Pract. 2012;8:292–297. doi: 10.1200/JOP.2012.000734. [DOI] [PMC free article] [PubMed] [Google Scholar]


