

Abstract
Optical techniques for functional imaging in mice have a number of key advantages over other common imaging modalities such as magnetic resonance imaging, positron emission tomography or computed tomography, including high resolution, low cost and an extensive library of available contrast agents and reporter genes. A major challenge to such work is the limited penetration depth imposed by tissue turbidity. We describe a window chamber technique by which these limitations can be avoided. This facilitates the study of a wide range of processes, with potential endpoints including longitudinal gene expression, vascular remodeling and angiogenesis, and tumor growth and invasion. We further describe several quantitative imaging and analysis techniques for characterizing in vivo fluorescence properties and functional endpoints, including vascular morphology and oxygenation. The procedure takes ~2 h to complete, plus up to several weeks for tumor growth and treatment procedures.
INTRODUCTION
Window chamber models have been used for more than 70 years in the study of angiogenesis, tumor microenvironments and treatment responses1–5. With the advent of fluorescent reporter genes and advancements in fluorescence probes and imaging techniques6, there is a vast array of potential functional and molecular information that can be obtained in vivo using these techniques7, including angiogenesis and vascular function8–10, vascular permeability11, molecular response to therapy12, and tissue oxygen tension and hemoglobin oxygenation13,14.
Overview of the technique
The dorsal window chamber technique involves surgically implanting a titanium frame to support a transparent window. The dorsal skin of a mouse is folded up into the frame, and one side of the skin is removed in a circular region of ~1 cm in diameter. Furthermore, a round cover slip is placed over the opening, thereby enabling high-resolution microscopy. During window implantation, tumor cells can be injected into the underlying skin tissue. Over the course of several days, the tumor will grow in the window, enabling longitudinal imaging of tumor initiation and growth. Quantitative image analysis can then be used to quantify the presence of fluorescent reporter genes, optical probes, hemodynamics and other parameters in both normal and tumor tissue.
There are also some disadvantages of this technique that are important to consider. In particular, the dorsal window chamber requires that a tumor be grown subcutaneously rather than orthotopically (orthotopic windows are also possible for accessible sites such as the mammary fat pad15). The window chamber is also confined such that tumors cannot grow larger than approximately 7–8 mm in diameter without overgrowing the window chamber. Moreover, the window cannot be maintained for longer than ~2 weeks before either the tumor grows too large or the window begins to deteriorate.
Comparison of window chamber models with other imaging modalities
A variety of in vivo optical imaging techniques exist, including diffuse optical imaging and tomography16,17, which are capable of identifying sources of absorption, scattering and fluorescence contrast, but at much lower resolution (typically on the order of mm in mice). High-resolution imaging techniques with depth sectioning capabilities can also be applied in vivo to image the site of interest through the skin or other tissue18. These include optical coherence tomography, multiphoton/nonlinear microscopy and confocal microscopy19,20. The primary limitation of these techniques is their limited penetration depth (approximately 0.2–1 mm), which has led to the adaptation of many of these techniques to invasive needle- or endoscope-based systems20. Other more recent developments include photoacoustic imaging, which allows submillimeter-resolution imaging in deep tissue21; its primary limitations include the need for specialized instrumentation and the ability to image absorption contrast only. Window chamber models fill the niche of enabling high-resolution imaging using wide-field fluorescence, transmission or reflectance imaging, as well as any of the microscopy techniques described above. This technique is uniquely suited for applications requiring longitudinal, high-resolution imaging of dynamic processes.
Other imaging modalities that can retrieve functional information longitudinally include positron emission tomography, computed tomography, ultrasound and magnetic resonance imaging22. All of these methods are noninvasive but suffer from relatively high cost and low resolution. They also do not have the wide range of functional and genetic reporters available for optical techniques. Their primary advantage is the ability to image noninvasively in deep tissue; they can also provide more of a global view of the functional parameters that they are capable of reporting. Optical methods are best suited for high spatial and temporal resolution (micrometer and sub-second scales) imaging of localized treatment effects and microvascular dynamics—or as a low-cost means of monitoring a treatment effect repeatedly over time.
Experimental design
Controls
In applying such techniques to study cancer development and treatment response, appropriate controls are needed to separate treatment effects from tumor growth or normal variability over time. In such cases, a mock or vehicle-only treatment should be used as a control. In some cases, an internal control may be appropriate, such as when the relative change in a parameter immediately after a treatment is of most interest (for example, if one were interested in quantifying the acute change in oxygenation induced by breathing hyperoxic gas). A final control that may be appropriate, depending on the question of interest, is to use a normal window (with no tumor implanted) and/or examination of the normal tissue adjacent to the tumor. This enables separation of normal tissue response from pathological tumor response.
Calibration standards
This includes not only instrument response factors, which can be measured using an appropriate absorption or fluorescence standard, but also variability in tissue-specific factors over time. In in vivo fluorescence microscopy, for example, the signal measured is a function of not only the fluorophore distribution, but also of tissue absorption and scattering. When quantifying tumor GFP fluorescence, the signal could thus change over time as a result of tumor growth, alterations in absorption or scattering properties (e.g., changes in blood volume) or changes in GFP expression. Appropriate controls are critical in this situation, and one effective approach is to use ratiometric indicators, which are less sensitive to these parameters.
Quantification
Moreover, critical to this work is the development of quantitative experimental and analysis methods to fully characterize the range of optical sources of contrast available. Hyperspectral imaging enables acquisition of fluorescence emission or reflectance/transmission spectra on a pixel-by-pixel basis. We have used a liquid-crystal tunable filter for this work, which enables a continuously tunable, narrow band-pass transmission wavelength14. The primary advantage of this is that it enables quantitative separation of multiple sources of contrast using chemometric algorithms23. We focus here on two primary sources of contrast: hemoglobin absorption, which enables quantification of total hemoglobin concentration and oxygen saturation; and quantitative spectral decomposition and extraction of fluorophore distribution.
MATERIALS
REAGENTS
Surgery
Mice (NCI-Frederick Animal Production Program (http://web.ncifcrf.gov/research/animal_production_program)). ▲ CRITICAL Window chamber surgeries can be successfully performed on a variety of mouse strains. However, care must be taken to ensure that the strain is compatible with the cell line of interest. All experiments should be performed in accordance with relevant national and institutional guidelines and regulations
Tumor cell line and appropriate phenol red–free culture medium (American Type Culture Collection (http://www.atcc.org)) (see REAGENT SETUP) ! CAUTION Care must be taken to avoid human exposure to cells. Human-derived or virus-associated tumor lines pose a particular hazard. Consult institutional guidelines for proper cell handling ▲ CRITICAL Cell suspensions should be prepared fresh and used on the same day. Cell suspension should be placed on ice (but not frozen) before use.
Ketamine anesthetic (Ketaset 100 mg ml−1; Fort Dodge Animal Health, NDC 0856-4403-01;). Ketamine solution can be stored for several months at room temperature (25 °C), and generally has an expiration date listed.
Xylazine muscle relaxant (AnaSed Injection; Lloyd Laboratories, cat. no. 4821). Xylazine solution can be stored for several weeks at room temperature, and generally has an expiration date listed.
Sterile NaCl solution (0.9%, wt/vol) (Sodium chloride injection, USP; Hospira, NDC 0409-7983-03). Saline solution can be stored at room temperature up to the expiration date.
Ophthalmic ointment (Rugby, NDC 0536-6550-91). It can be stored at room temperature for several months.
Hair-removal lotion (for removing hair from mice) can be stored at room temperature for several months.
Chlorhexidine (2%, wt/wt) (Boehringer Ingelheim Vetmedica, cat. no. 448315). It can be stored at room temperature for several months.
Isopropyl Alcohol (70%, vol/vol) (Medline Industries, NDC-10565-002-16) It can be stored at room temperature indefinitely.
Antibiotic ointment (E. Fougera, NDC 0168-0012-09) It can be stored at room temperature until expiration.
Buprenophine analgesic (Buprenex Injectable, 0.3 mg ml−1; Reckitt Benckiser Healthcare, cat. no. 7571) It can be stored at room temperature until the expiration date.
Sporicidin (Sporicidin, cat. no. RE-1284C) It can be stored at room temperature until the expiration date.
Imaging
Ophthalmic ointment (Rugby, NDC 0536-6550-91). It can be stored at room temperature for several months.
Isoflurane (Aerrane; Baxter Healthcare, NDC 10019-773-60)—can be stored at room temperature until expiration date.
EQUIPMENT
Surgery
Window chamber units (including nuts, retaining rings and glass cover slips) (12-mm window chamber unit, Research Instruments) (see Fig. 1).
Custom-machined C-holder (C-holder for 12-mm window chamber unit, Research Instruments)
Custom-machined Plexiglas viewing stage (see Fig. 2 for this and other instrument identification)
Leather hole puncher with 1/8-inch hollow punch (or 16G needle; 223 Revolving Leather Hole Punch; C.S. Osborne)
Two large metal binder clips (Staples, cat. no. 10669-CC)
Retaining ring pliers (Stanley Proto Industrial Tools, cat. no. SEPTLS577398)
Glass microsyringe (25–100 μl volume; 702LT 25ul SYR; Hamilton Company, cat. no. 80401)
Metal paper clip (no. 1 size; Staples, cat. no 472480)
Sterilization wrap (40 inches × 40 inches, regular weight; Medline Industries, cat. no. GEM2140)
Sterile pad (18 inches × 26 inches, Polylined sterile field; Busse Hospital Disposables, cat. no. 696)
Surgical marker (150 Skin Marker and Ruler; Devon, Tyco Healthcare Group, cat. no. 31145926)
Monosof 4-0 or silk suture (Monofilament nylon suture; Syncture, Tyco Healthcare Group, cat. no. SN-1964)
Disposable surgical blade (Bard-Parker, Becton Dickinson Acute Care, cat. no. 37120)
Syringe (1 ml; Becton Dickinson, cat. no. 309623)
Two 30G needles (Becton Dickinson, cat. no. 305106)
Mayo scissors (Harvard Apparatus, cat. no. 728461)
Iris scissors (Harvard Apparatus, cat. no. 596903)
Conjunctival scissors (Harvard Apparatus, cat. no. 522284)
Jeweler-type forceps (Medetz Surgical Instruments, cat. no. M11-08360)
Mosquito forceps (Medetz Surgical Instruments, cat. no. 22.1752)
Needle holder (Medetz Surgical Instruments, cat. no. 21.1713)
Nut driver (Wiha Tools, cat. no. 26592)
Petri dish (Sigma-Aldrich, cat. no. P5481-500EA)
Cotton gauze (Curad Pro-Gauze; Medline Industries, cat. no. CUR20423)
Thermostatic blanket (T/Pump; Gaymar Industries, cat. no. TP700)
Gooseneck lamp (Lamps Plus, cat no. N6638)
Hot plate (Fisher Scientific, cat. no. 11-510-49SHQ)
Glass-bead sterilizer (Germinator 500; Roboz)
Custom-machined Plexiglas surgical platform
Phase-change wax heating pad (Braintree Scientific, Model 39 DP)
Vortexer (Vortex Genie 2; Scientific Industries, Model G560)
Surgical tray (Harvard Apparatus, cat. no. 610215)
Lab coat (Fisher Scientific, cat. no. S47453A)
Sterile surgical gloves (Medline Industries, cat. no. MD5104060)
Facemask (3M, cat. no. 1818)
Electric shaver for hirsute mice (Oster Professional Products, cat. no. 76054-010)
Figure 1.
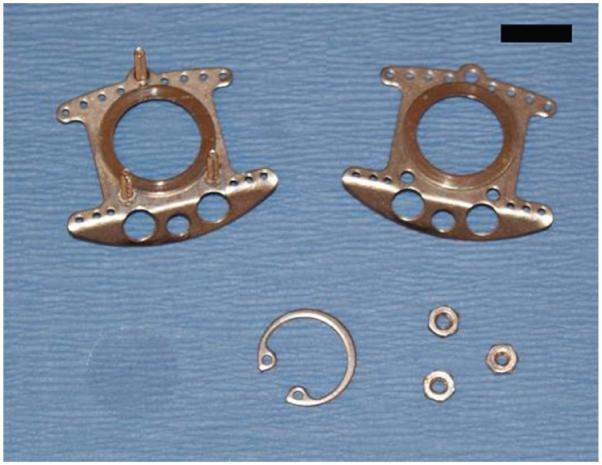
Window chamber. The window chamber, retaining nuts and window glass are shown. Scale bar, 1 cm. Reproduced with permission (G.M.P., A.N.F., S.S. and M.W.D., unpublished data).
Figure 2.

Equipment and surgical tools. Some of the equipment and surgical tools described in this protocol are shown here with descriptions. Scale bar, 10 cm.
Imaging
Fluorescence microscope with suitable light source and filter cubes (Axioskop II; Zeiss). A standard fluorescence microscope, either upright or inverted, will generally work. The important features are to ensure enough working space between the stage and objective (at least 3 cm), and ideally a long working distance lens to facilitate repositioning. It is important to design the imaging mount such that the window will remain fixed in place to avoid motion artifacts.
Imaging mount (custom made) (see Fig. 3 and EQUIPMENT SETUP). The imaging mount provides a firm platform to support the window chamber during imaging. It is important to design the imaging mount such that the window will remain fixed in place to avoid motion artifacts.
Liquid-crystal tunable filter (VariSpec; CRi). Other options include acousto-optic tunable filters or integrated tunable filter/camera combinations. When using a tunable filter, the emission filter can be removed from the filter cube in order to enable greater throughput and a wider range of emission wavelengths to be used ! CAUTION When doing so, the excitation light will not be filtered in the optical path leading to the eyepiece, which can result in dangerous UV exposure to the eyes; therefore, the eyepiece must not be used in this case. A better alternative is to use a wide bandwidth or a long-pass emission filter with high transmission efficiency.
TE-cooled CCD camera (1412M; DVC). Any scientific-grade CCD camera should be sufficient for most purposes.
Isoflurane vaporizer (VetEquip, cat. no. 911103)
Medical air or oxygen (house line or tank)
Anesthesia scavenging system (VetEquip, cat. no. 935101)
Cotton swabs (Fisher Scientific, cat. no. 23-400-118)
Figure 3.
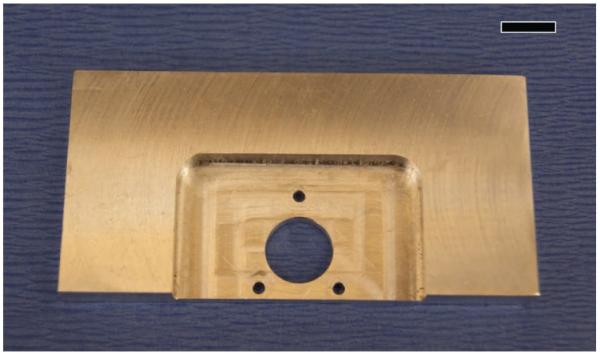
Imaging mount. Imaging mount used to fix the window chamber onto a microscope stage. Large central hole is at least 12 mm in diameter to permit imaging, and the three smaller holes are positioned to allow the bolts on the window chamber to pass through. The mount can be custom designed for a given microscope to permit secure attachment to the stage. Scale bar, 1 cm.
REAGENT SETUP
Ketamine/xylazine working solution
Dilute the stock reagents to 10 mg ml−1 ketamine and 1 mg ml−1 xylazine in sterile 0.9% (wt/vol) NaCl solution. A redosing solution should also be prepared with ketamine only (10 mg ml−1). ▲ CRITICAL Xylazine is not metabolized as rapidly as ketamine, so redosing is generally performed with ketamine only. This need not be prepared fresh, and can be stored for several weeks at room temperature.
Buprenophine solution
Dilute the stock buprenophine solution to 15 mg ml−1 in sterile 0.9% (wt/vol) NaCl solution. This need not be prepared fresh, and can be stored for several weeks at room temperature.
Tumor cell suspension
Suspend the cultured cells in appropriate phenol red–free culture medium at a concentration such that a 20-μl volume contains the desired number of cells for inoculation. The cell suspension should be used on the same day as the preparation.
EQUIPMENT SETUP
Surgical station
Window chamber surgeries must be performed using aseptic technique to minimize the risk of animal infection. A laminar flow HEPA-filtered hood or other flow-isolated environment with an accessible electrical outlet is an ideal location. Within the station, position the fiber optic lamp such that the lamp output is at the appropriate height and angle to illuminate the viewing stage. Place the hot plate and the glass-bead sterilizer in an accessible location. The viewing stage is an 24 × 19 × 3 cm Plexiglas box with an open bottom and back—the crucial design characteristics are that it is sufficiently large to hold the wax heating pad, and that it provides a sturdy platform for the surgery.
Sterilization wrap squares
Cut a piece of 40-inch × 40-inch sterilization wrap into ~6-inch squares. Fold the squares diagonally and make a 3–4 cm slit along the diagonal.
Surgical kit preparation
The following items must be sterilized before surgery: window chamber units, C-holder, glass microsyringe, mayo scissors, iris scissors, conjunctival scissors, jeweler-type forceps, mosquito forceps, needle driver, nut driver, cotton gauze, viewing stage, leather hole puncher, binder clips, ring pliers, nut driver, sterilization wrap squares and Petri dish. Place all items that can be safely steam-sterilized into the surgical tray and wrap it in sterilization wrap. Autoclave the kit for at least 90 min at 121 °C. Separately pack and gas-sterilize any items that can rust or melt.
Surgical station preparation
Immediately before surgery, thoroughly wipe down all surfaces within the working station with Sporicidin. Place the surgical kit in the middle of the working area and carefully unwrap it without touching the kit itself or the sterile inner surface of the sterilization wrap. The sterilization wrap should now provide a broad sterile surface on which to work. Reach in beneath the sterilization wrap and position the surgical kit to one side of the sterile working area. Using sterile technique, drop the rest of the gas-sterilized and sterile prepackaged equipment into the surgical tray. Heat the paraffin pad in a microwave for a few minutes on the highest power setting until the wax is partially melted. Place the paraffin pad in the middle of the sterile working area. Thoroughly wipe down the surgical platform with Sporicidin and place it on top of the paraffin pad. (Although the paraffin pad and the surgical platform are not sterile, these will be covered with the sterile field at a later point.) Place the sterile Petri dish on the hot pad without touching the inner surface, and fill it with ~10 ml of sterile saline. Heat the saline to ~37 °C.
Animal housing
Mice can be housed under standard conditions, ensuring that there is enough clearance for them to move freely in the cage after the window is implanted. A standard rat cage is often convenient for this purpose. Make sure to add sufficient bedding so that the mice can reach their food and water.
Imaging mount
The imaging mount can be custom machined to suit the imaging setup. The simplest configuration is a stiff metal or plastic sheet with four holes drilled in it, a central 12-mm-diameter hole for imaging, and three surrounding holes through which the window chamber bolts can pass (~2 mm diameter). An extra set of nuts can then be screwed into the bolt to securely affix the window chamber to the imaging bracket, and the bracket itself can be designed such that it can be securely attached to the microscope stage.
PROCEDURE
Dorsal window chamber surgery ● TIMING 30 min
1| Anesthetize the mouse by intraperitoneal injection of the ketamine/xylazine working solution, corresponding to doses ranging from 85–100 mg kg−1 ketamine and 8.5–10 mg kg−1 xylazine. Place the mouse on a thermostatic blanket in a sternally recumbent position to maintain a body temperature of ~37 °C.
▲ CRITICAL STEP The mouse should be monitored carefully throughout the surgery for response to any physical stimuli during the procedure and redosed appropriately using 25–33% of the initial dose of ketamine only.
? TROUBLESHOOTING
2| Apply artificial tear ointment to the mouse’s eyes.
▲ CRITICAL STEP Failure to keep the eyes adequately hydrated can lead to corneal desiccation and permanent eye injury.
3| For surgeries on hairless mice, proceed directly to Step 4. For surgeries on hirsute mice, shear the dorsal area from nape to tail along the back and to the midline of the limbs on either side using an electric shaver. Apply hair removal lotion to the shorn area and remove hair remnants according to the product instructions, usually after ~5 min.
▲ CRITICAL STEP Product instructions and veterinary guidance must be followed carefully; if the lotion is left on for too long, it can cause skin irritation or injury.
4| Apply chlorhexidine solution to the dorsal region of the mouse’s torso and the entire tail with cotton gauze. After thorough application, immediately remove the chlorhexidine with cotton gauze soaked in 70% (vol/vol) ethanol. Repeat this process two more times.
5| Don surgical gear.
▲ CRITICAL STEP From this point forward, sterile technique should be followed in order to minimize the risk of infection. Do not allow gloved hands or sterile equipment to come into contact with nonsterile objects, including any portion of the mouse not treated with chlorhexidine.
6| Within the surgical area, attach the Plexiglas viewing stage to the surgical platform with the metal binder clips. Cut a rectangular hole in the sterile field so that the viewing stage is exposed through the hole, but the sterile field completely covers the surgical platform (Fig. 4).
Figure 4.
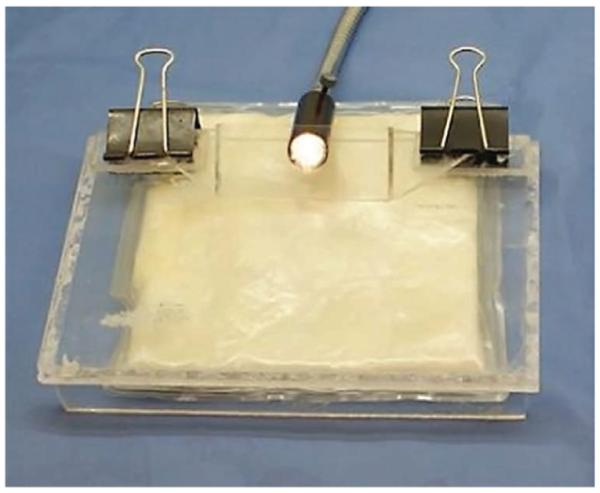
Surgical platform preparation. With the heated paraffin pad beneath the surgical stage and the viewing stage attached with binder clips, the sterile field is draped over the entire assembly. A rectangular section is cut from the sterile field so that the viewing stage is exposed. Reproduced with permission (G.M.P., A.N.F., S.S. and M.W.D., unpublished data).
7| Mark the mouse along the length of the spine with the surgical marker. At the peak of the back, apply two small dots on either side of the line, ~5 mm apart. This will establish a landmark for proper window chamber placement (Fig. 5).
Figure 5.

Preparing the mouse for surgery. The line drawn along the mouse’s spine will facilitate symmetrical placement of the window chamber. The dots will be used to ensure that the window chamber is sutured at the proper height and lateral position on the torso.
8| Drape one of the sterilization wrap squares over the mouse with the slit aligned with the line drawn along the length of the spine. Roll up and secure the loose corners of the square with a paper clip. Take care to handle only the outer side of the sterilization wrap.
9| Transfer the mouse to the sterile working area.
10| Gently pull the loose dorsal skin through the slit and secure it to the C-holder with four stitches made along the back-line such that the skin fans out with enough working area to accommodate the window chamber (Fig. 6). For portions of the surgery that require delicate manipulation, the C-holder can be hung from the viewing stage for better visibility.
Figure 6.
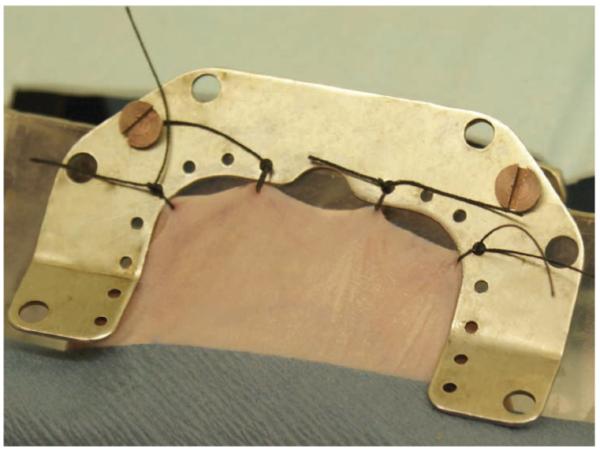
Securing the dorsal skin fold. Four sutures along the marked line attach the dorsal skin to the C-holder. This provides the working space for window chamber attachment.
? TROUBLESHOOTING
11| Hold the flat side of one of the window chamber pieces against the skin fold such that the dot that was drawn on the back is aligned with the top screw hold of the window chamber. Mark the positions of the other screw holes and trace the circumference of the window area with the surgical marker.
12| Punch a hole through both sides of the skin at each of the screw locations using either the hole puncher or a 16G needle.
13| Using the mosquito forceps to hold the skin and cutting along the circumference of the drawn circle with the iris scissors, remove the forward-facing portion of skin, leaving the opposing layer intact.
14| Periodically flush the exposed dermis with warm saline (prewarmed to 37 °C) throughout the remainder of the surgery to clear away blood and keep the dermis hydrated.
? TROUBLESHOOTING
15| Using the jeweler forceps and the conjunctival scissors, remove any remaining loose connective tissue, leaving intact the fine, translucent fascial plane that covers the dermis.
16| Insert the screws on the front window chamber frame through the three smaller holes, cutting away any obstructing connective tissue with the conjunctival scissors.
17| Use the nuts to fasten the rear frame to the front frame, manipulating the skin to keep the exposed dermis centered within the frame.
▲ CRITICAL STEP To avoid infection, the frame must be secured tightly enough to ensure that the wound is fully sealed by the window chamber frame. Avoid over-tightening the frame, however, as this may inhibit circulation and lead to necrosis.
18| Using the microsyringe, and holding the needle tip at a shallow angle with the bevel up, inject ~20 μl of the vortexed tumor-cell suspension between the exposed fascial plane and the dermis. A small bubble should be visible (Fig. 7).
Figure 7.
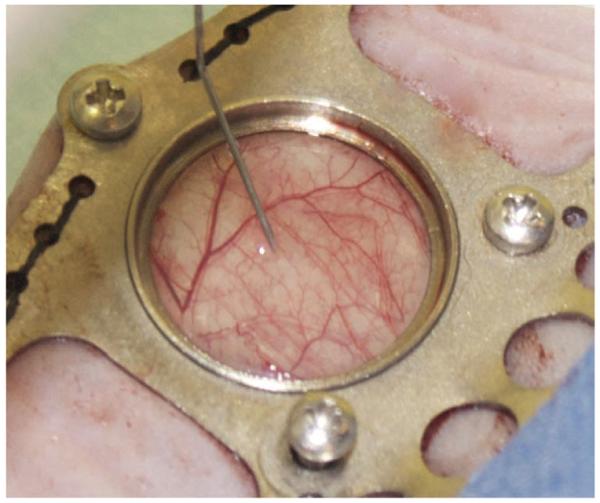
Tumor cell inoculation. Approximately 20 μl of the cell suspension is injected between the dermis and the superficial fascia. Proper positioning of the needle tip will cause the injected cell suspension to form a small bubble.
▲ CRITICAL STEP The cell suspension must be injected beneath the fascia to achieve tumor growth. Avoid injection into or damage to the dermal tissue, as this may cause wound lesions that visually obscure the tumor. If necessary, the fascia can be lightly lifted with the jeweler forceps to better facilitate proper injection.
? TROUBLESHOOTING
19| While holding it level, fill the window with warm saline until a meniscus forms.
20| Place the glass cover slip over the window with the jeweler forceps. Push the cover slip down into position, allowing the saline to leak out around the edges. Ensure that no air bubbles remain within the sealed window.
21| Secure the cover slip with a retaining ring.
22| With the skin taut, suture the window chamber to the skin using the small holes along the edge of the frame.
23| Use the surgical blade to remove the sutures attaching the skin to the C-holder.
24| Return the mouse to the thermostatic blanket for recovery, and remove the sterile wrapping. Apply antibiotic ointment to the suture wounds. As the mouse begins to regain mobility, subcutaneously inject 0.05–0.15 mg kg−1 of buprenorphine solution for pain management.
? TROUBLESHOOTING
25| If you are performing further surgeries, wipe down and resterilize the contaminated portions of the surgical tools with the glass-bead sterilizer, and ensure that the paraffin heating pad is still warm.
Recovery and tumor growth ● TIMING 5–10 d
26| Return the mouse to the animal housing facility after it has fully recovered from anesthesia. Tumor growth should be visually apparent within 5–10 d, although this may vary depending on the cell line and mouse strain. Postoperative monitoring should include checking for excessive weight loss, posture, activity level or facial expression. Humane endpoints should be approved by the appropriate regulatory body and generally should include excessive weight loss (>15%) and unresolved infection or pain.
▲ CRITICAL STEP Some tumor lines grow best in a warm environment. If tumor growth is not apparent after several surgeries, the animals may be housed in an environmental chamber with an elevated temperature and humidity (34 °C with 50% humidity). This ensures that the window chamber tissue remains warm and moist.
? TROUBLESHOOTING
27| Readminister buprenorphine 8–12 h after surgery, and then as needed for pain alleviation. Generally, the animals should recover fully from surgery and anesthesia and show no signs of distress by the next day.
▲ CRITICAL STEP Examine the mice daily for signs of distress, adhering to appropriate institutional and governmental guidelines for pain management and humane endpoints.
Imaging setup ● TIMING 30 min
28| Turn on fluorescence and white-light sources, camera, tunable filter and heating pad, and allow the instruments to warm up for the recommended time period (15–30 min).
29| Anesthetize the mouse by positioning a nose cone over the snout while physically restraining it, or by placing the mouse in an induction chamber with 2.5% (vol/vol) isoflurane.
▲ CRITICAL STEP All animal experiments related to imaging should comply with relevant institutional and national animal care guidelines.
30| When the animal is unconscious (after ~60 s of isoflurane inhalation), transfer it to the heated pad on the microscope stage and reduce the isoflurane dose to 1% (vol/vol).
▲ CRITICAL STEP Continuously monitor the mouse’s depth of anesthesia by noting the breathing rate, toe pinch reflex and twitching; adjust the isoflurane dose as needed between 1 and 2.5% (vol/vol). Anesthesia must be maintained at an appropriate depth and carefully monitored to avoid adversely affecting respiration while still minimizing motion artifacts.
31| Apply moisturizing ointment to the eyes.
▲ CRITICAL STEP The mouse will not blink while anesthetized; eye dehydration can cause permanent damage.
32| Clean the glass window with a cotton swab soaked in alcohol.
33| Affix the window frame to the imaging mount and position it on the imaging stage.
Imaging ● TIMING 5–10 min per mouse
34| Carry out bright-field imaging as described in option A or fluorescence imaging as described in option B. Fluorescence imaging can be performed independently, or in the same animal as bright-field imaging. It is also possible to sequentially switch between bright-field and fluorescence imaging.
(A) Bright-field imaging (absorption contrast, hemoglobin oxygen saturation)
Select the desired magnification, adjust the focus and identify the region(s) to be imaged.
-
Acquire images in 10-nm increments from 520–620 nm; the critical region of the spectrum includes 550–600 nm, where the major structures of the oxygenated and deoxygenated hemoglobin absorption spectra are present.
▲ CRITICAL STEP The exposure time should be adjusted such that there are no saturated pixels in any of the images for the region of interest, and that there is a sufficiently high signal-to-noise ratio. This often requires fine-tuning of the exposure times for each wavelength at the start of each session.
Acquire image sequences as frequently as required to characterize fluctuations in oxygenation (which typically occur with a dominant period of 10–20 min). A frequency of approximately once every 3 min is generally adequate.
-
Perform image calibration to correct for the effects of different exposure times and to eliminate signal contributions from the camera’s dark offset. The dark offset is measured by blocking the light source and acquiring an image.
▲ CRITICAL STEP Cameras will commonly have an offset parameter, and it is important to set this value such that there is a small positive offset in a dark image. Otherwise, it is impossible to correctly calibrate for dark offset. Other camera settings (gain, postacquisition correction factors and so on) should ideally be held constant for all images. To correct for system response, we have used an absolute calibration scheme, whereby the system throughput is characterized using neutral density (ND) filters that are placed in the light path of the microscope. This enables measurement of the system response function without saturating the detector. Absorptive ND filters with an optical density (OD) ranging from 0.5 to 3 are used for this purpose. An ND filter is selected such that the same imaging parameters used to measure tissue transmission can be used to measure the system throughput. The entire spectrum is acquired using settings identical to those used for tissue imaging, with the appropriate ND filter in place.
Process data as described in Box 1.
BOX 1. BRIGHT-FIELD DATA PROCESSING ● TIMING VARIABLE.
Image processing can be achieved using the algorithms referenced here and in Box 2. There are several commercial and open-source image-processing applications that are suitable for this work, including MATLAB (http://www.mathworks.com) and Python (http://python.org and http://www.scipy.org).
1. The calibrated image can be expressed as
where Ical is the calibrated image, Iraw is the raw measure data, Idark is the dark image and texposure is the exposure time.
2. This enables calculation of the absolute attenuation of light in the tissue by the following equation:
where A is the tissue attenuation, Ical_tissue is the calibrated tissue image, Ical_ND is the calibrated ND image and OD is the OD of the filter used.
3. Because these data are acquired at discrete wavelength bands, A can be expressed as a function of wavelength-dependent attenuation factors. Using a modified version of Beer’s law to account for the effects of scattering, this can be expressed as follows:
where b0 is a constant term accounting for overall changes in signal due to source intensity, spectral reflection and so on. μeff is the effective attenuation coefficient derived from diffusion theory25,
calculated for representative skin optical properties at each wavelength26; it accounts for attenuation due to nonhemoglobin absorption and scattering, with b1 being a free parameter modulating the magnitude of this term. εi(λ) gives the extinction coefficient of the ith absorber as a function of wavelength accounted for explicitly in the model. In this case, oxygenated and deoxygenated hemoglobin are generally used, but it is also possible to include other terms, such as methemoglobin, for example. A linear non-negative least squares fitting algorithm is used to extract the terms b0, b1 and Ci, on a pixel-by-pixel basis. In this case, Ci is a composite term that is effectively the product of the concentration and path length of light attenuated by each absorber. This enables quantification of the relative total hemoglobin (Hb) content × path length product as CdeoxyHb + CoxyHb, where these correspond to deoxygenated Hb and oxygenated Hb, respectively. The hemoglobin oxygen saturation is calculated as CoxyHb / (CdeoxyHb + CoxyHb) × 100%. In this case the path length term cancels out.
4. To exclude pixels for which the model does not adequately fit the data, an R2 threshold can be used, for example, by excluding all pixels with an R2 threshold <0.9. Generally, most pixels will have an R2 value greater than this, but this is also useful as a diagnostic check to ensure that all processing and calibration were done correctly.
5. We have used several methods to visualize the data; one method is to simply display each parameter individually on a pseudocolor scale. It is also possible to combine the data such that the hemoglobin oxygen saturation is plotted on a pseudocolor scale, the intensity of which is modulated by the total hemoglobin × path length parameter. This highlights regions of large vessels or high vessel density, such as in tumors, where there is a large hemoglobin signature (see ANTICIPATED RESULTS).
(B) Fluorescence imaging
Select the appropriate filter for the fluorophore being imaged.
Select the desired magnification, adjust the focus and identify the region to be imaged. The focus can be adjusted using the bright-field image if the fluorescence is dim or does not show clear structure.
Inject the fluorophore (if using an extrinsic probe). If you are injecting directly onto/into the window chamber tissue, this can be done either topically by removing the window, or by injecting through the skin behind the window.
Collect a sequence of images spanning the emission range of the fluorophore of interest. Adjust the camera settings at the start of each session to obtain ideal images while taking care not to saturate the signal.
Acquire the calibration images. A dark offset image should be acquired as described in Step 34A(iv). This is a crucial step in the accurate modeling of spectral components. A reference slide can also be used to calibrate overall system throughput, which is used to compare absolute intensity changes from day to day.
Process data as described in Box 2.
BOX 2. FLUORESCENCE IMAGE ANALYSIS ● TIMING VARIABLE.
Image processing can be achieved using the algorithms referenced here and in Box 1. There are several commercial and open-source image-processing applications that are suitable for this work, including MATLAB (http://www.mathworks.com) and Python (http://python.org and http://www.scipy.org).
1. The fluorescence images can be calibrated for exposure time and dark offset as described above (Box 1, Step 1).
? TROUBLESHOOTING
2. Emission spectra can be modeled as a linear combination of all sources of fluorescence within the sample. This will typically include autofluorescence, as well as the extrinsic sources of fluorescence, or genetically encoded fluorophores (e.g., GFP). We have thus used a PARAFAC algorithm to decompose tissue spectra into constituent spectra23. This algorithm would ideally be fed spectral data from all treatment groups used in an experiment. It will then attempt to optimize the component spectra and relative contributions pixel by pixel to minimize the sum-of-squares error between the measured and modeled spectra. The outputs are the constitutive spectra.
A linear combination of these derived spectra represents the raw measured spectrum. This method is most useful for the case in which there are multiple overlapping fluorophores (such as with many ratiometric probes) or in cases in which tissue autofluorescence is significant. We have previously used this approach with a ratiometric oxygen sensor24.
3. The variable parameters specified in this model include the non-negativity constraint, which is applied to all spectra and component weightings. The model also requires the user to specify the number of spectral components. This needs to be determined based on the goodness of fit and a priori knowledge of the constitutive fluorophores present.
4. Data visualization can be done by displaying the component weightings. Using the spectrum of each component and the relative distribution, it is possible to determine which fluorophore each component corresponds to. For the case in which only a single fluorophore is present and the background autofluorescence is minimal, the calibrated intensity (from Step 1 of this box) is often an adequate measure of fluorescence intensity.
? TROUBLESHOOTING
Troubleshooting advice can be found in Table 1.
TABLE 1.
Troubleshooting table.
| Step | Problem | Possible reason | Solution |
|---|---|---|---|
| 1 | Mouse is not fully anesthetized |
Ketamine/xylazine solution is too old |
These drugs can lose their potency over time; ensure that the stock solution has not expired. Prepare a fresh working solution |
| Dose is insufficient | Different strains of mice (and even individual mice of a common strain) may have disparate sensitivities to a particular anesthesia. The dose prescribed in the protocol generally provides a safe and appropriate response; however, this dose may not be sufficient in all situations. Consult institutional guidelines or a qualified veterinarian for information on appropriate dosing adjustments |
||
| 10 | Not enough skin to accommodate a window chamber |
Mouse is too young | Mice less than 6 weeks old are generally too small for surgeries; wait until mice are at least 6 weeks old |
| Mouse is underweight | Window chamber surgeries should not be performed on mice that weigh less than 20 g |
||
| 14 | Heavy bleeding | Major vessel has been severed |
Large vessels are observed when the skin fold is back-illuminated. The position of the window chamber can be adjusted slightly to avoid cutting through major vessels. If bleeding is still a problem, wait a few minutes for clotting to occur. Flush away pooled blood with sterile saline. In addition, if the fascia of the top skin layer is not removed completely, it can continue bleeding. Ensure that the fascia is completely removed |
| 18 | No bubble formation | Superficial fascial plane has been removed |
The fascial plane superficial to the dermis must be preserved to hold the cell suspension. Try injecting in another location where the fascia may be intact. If this fails, use a new animal |
| 24 | Mouse is slow to recover from anesthesia |
Mouse became hypothermic |
Anesthetized mice have an impaired ability to regulate core body temperature. External heat sources must be used to prevent fatal hypothermia. Ensure that the paraffin wax pad is in contact with the surgical stage for good thermal conductance. Keep the mouse’s body in contact with the stage at all possible times. If you are performing multiple surgeries, the wax pad may need reheating |
| Mouse was overdosed | Ensure that the anesthesia was formulated correctly. Prepare a new working solution. If overdose is a continuing problem, consult institutional guidelines or a qualified veterinarian for information on appropriate dosing adjustments |
||
| 26 | Tumor does not grow | Tumor cells are not viable |
Redo surgeries, ensuring cell suspension is properly formulated. Keep the cells on ice throughout the surgeries. If surgeries done earlier in the day had a higher success rate, this may indicate a cell storage problem |
| Insufficient cell concentration |
There is a large amount of variability in tumor viability among different cell lines and mouse strains. Some strains may be entirely resistant to particular cell lines. Consult the literature to ensure that the strain is appropriate for the cell line of interest. If so, redo surgeries with cells injected at a higher concentration |
||
| 26 | Window tissue is thin and grayish |
Window chamber is too tight |
There may be variability in skin thickness among mice, and some window chamber designs may restrict blood circulation due to insufficient space between the frames. This may be corrected by changing the size of the spacers separating the window chamber frames. This can be tested immediately after surgery by verifying that the skin is free to move slightly around the window |
| Box 2 | Poor separation of sources of fluorescence |
Adjustment of PARAFAC parameters is needed |
In order to effectively separate multiple sources of fluorescence, the correct number of components needs to be specified, and then data must be correctly calibrated. The number of components should be increased until additional components do not characterize additional sources of contrast (i.e., they will appear as noise). Alternatively, when a priori information about the fluorescence emission spectra is available or pure signal from only a single fluorophore can be obtained, directly use the known spectra of each fluorophore in the tissue |
● TIMING
Steps 1–25, Dorsal window chamber surgery: ~30 min (Surgeries may take considerably longer, however, depending upon the experimenter’s level of experience. 1–1.5 h should be anticipated for the first few surgeries.)
Steps 26 and 27, Recovery and tumor growth: 5–10 d (There is a wide range of variability in growth rates among various cell lines. Windows should be checked daily for indications of tumor growth. The first few days in which the tumor can be visually observed often provide ideal images.)
Steps 28–33, Imaging setup: ~30 min
Step 34A, Bright-field imaging: 5–10 min
Box 1, Bright-field data processing: variable (Data processing can be performed at any time after images are collected. Computational processing time depends upon the speed of the computer system and the total size of the data set.)
Step 34B, fluorescence imaging: 5–10 min
Box 2, Fluorescence image analysis: variable (see bright-field data processing)
ANTICIPATED RESULTS
Typical results are shown in Figure 8. This image was acquired from a window chamber implanted with a 4T1 mammary carcinoma cell line that expresses GFP driven by an hypoxia inducible factor (HIF)-1 promoter12. Thus, the GFP signal is reflective of HIF-1 activity. Both fluorescence and transmission images were acquired, enabling characterization of both hemoglobin absorption and GFP. This enables characterization of vascular oxygenation as well as HIF-1 activity simultaneously. Furthermore, transmitted images in the visible spectral band (where vessels are distinct because of hemoglobin’s high optical absorption coefficients) can be quantitatively analyzed for parameters of vascular structure (e.g., vascular length density, vessel diameter, tortuosity) using scientific image processing software.
Figure 8.

Functional imaging. Magnified (×2.5) raw and processed images of a 4T1 tumor expressing GFP concurrently with HIF-1α. (a) Bright-field transmission image of the central tumor and surrounding normal tissue. (b) Grayscale image of raw fluorescence intensity. (c) Mapping of relative variations in total hemoglobin. (d) Simultaneous visualization of inverse total hemoglobin absorption and hemoglobin saturation. Increased pixel brightness represents an increased hemoglobin component at that pixel location. Hemoglobin saturation is mapped on a blue-red color gradient, with the deoxygenated hemoglobin component represented in the blue color channel, and the oxygenated hemoglobin component represented in the red color channel. (e) Simultaneous visualization of total hemoglobin absorption (brightness of red-blue signal), hemoglobin saturation (red-blue color scale) and GFP expression (green channel). Scale bars, 1 mm.
Figure 9 shows results of using the Parallel factor analysis (PARAFAC)23 algorithm to decompose overlapping spectra. In this case, an oxygen-sensing boron nanoparticle having stable blue fluorescence emission and oxygen-quenched green fluorescence was imaged sequentially in 5-nm wavelength intervals from 425 to 575 nm using the hyperspectral imaging system previously described13. As the fluorescence is independent of oxygen concentration, it provides a stable control against which to normalize the phosphorescence signal. Thus, the ratio of the fluorescence and phosphorescence intensities is capable of directly reporting oxygen tension. In this case, a solution of 1 mg ml−1 boron nanoparticles was topically applied and imaged (as described above) under bright-field trans-illumination. The bright-field image (Fig. 9a) shows the highly vascularized tumor on the left-hand side of the image. The raw fluorescence averaged across all wavelengths is seen in Figure 9b, which represents the integrated intensity of the nanoparticles. The total emission spectrum extracted from an averaged pixel sample was decomposed using PARAFAC into constituent fluorescence and phosphorescence spectra (Fig. 9c), with the component scores shown (Fig. 9d,e). Only after normalizing the fluorescence/phosphorescence image can the oxygen distribution be seen (Fig. 9f), which can then be calibrated to provide absolute oxygen tension24.
Figure 9.

Spectral decomposition. Decomposition of overlapping spectra using PARAFAC. (a) Bright-field image in which the tumor can be seen in the left-hand side of the image. (b) Fluorescence intensity averaged across the entire wavelength range. (c) PARAFAC-derived spectral components corresponding to fluorescence and phosphorescence emission. (d–f) The factor scores are shown for the fluorescence (d) and phosphorescence (e) channels, as well as the ratio of fluorescence/phosphorescence (f) (scale bars are 1 mm). Portions of this figure are reprinted with permission from Palmer et al.24
ACKNOWLEDGMENTS
We thank the US Department of Defense Breast Cancer Research Program (Postdoctoral Fellowship W81XWH-07-1-0355 to G.M.P.; Predoctoral Traineeship Award W81XWH-08-BCRP-PREDOC to A.N.F.), the US National Institutes of Health (R01CA40355 to M.W.D.) and the University of Virginia Cancer Center (James and Rebecca Craig Foundation and the NCI Cancer Center Support Grant P30 CA44579 to C.L.F.) for support for this research.
We also thank the University of Virginia NanoSTAR Institute for supporting early efforts to develop and test boron nanoparticles as biomedical imaging agents.
Footnotes
AUTHOR CONTRIBUTIONS G.M.P and A.N.F. wrote the manuscript, collected the data presented and prepared the figures. S.S. and M.W.D. assisted in the design of the content of the manuscript and revisions. G.H. assisted in the production of figures and revision of the manuscript. C.L.F. and G.Z. assisted in the development of boron nanoparticle techniques and manuscript revision.
COMPETING FINANCIAL INTERESTS The authors declare competing financial interests: details accompany the full-text HTML version of the paper at http://www.natureprotocols.com/.
Reprints and permissions information is available online at http://www.nature.com/reprints/index.html.
References
- 1.Sandison J. Observations on growth of blood vessels as seen in transparent chamber introduced into rabbit’s ear. Am. J. Anat. 1928;41:475–496. [Google Scholar]
- 2.Ide A, Warren S. Vascularization of the Brown Pearce rabbit epithelioma transplant as seen in the transparent ear chamber. Am. J. Roentgenol. 1939;42:891–889. [Google Scholar]
- 3.Algire G. An adaptation of the transparent chamber technique to the mouse. J. Natl. Cancer Inst. 1943;4:1–11. [Google Scholar]
- 4.Huang Q, et al. Noninvasive visualization of tumors in rodent dorsal skin window chambers. Nat. Biotechnol. 1999;17:1033–1035. doi: 10.1038/13736. [DOI] [PubMed] [Google Scholar]
- 5.Jain RK, Munn LL, Fukumura D. Dissecting tumour pathophysiology using intravital microscopy. Nat. Rev. Cancer. 2002;2:266–276. doi: 10.1038/nrc778. [DOI] [PubMed] [Google Scholar]
- 6.Palmer GM, Vishwanath K. In: Handbook of Physics in Medicine and Biology. Splinter Robert., editor. CRC Press/Taylor & Francis Group; 2010. pp. 30-31–30-11. [Google Scholar]
- 7.Vázquez BY, Hightower CM, Sapuppo F, Tartakovsky DM, Intaglietta M. Functional optical imaging at the microscopic level. J. Biomed. Opt. 2010;15:011102. doi: 10.1117/1.3280270. doi:10.1117/1.3280270. [DOI] [PMC free article] [PubMed] [Google Scholar]
- 8.Cao Y, et al. Observation of incipient tumor angiogenesis that is independent of hypoxia and hypoxia inducible factor-1 activation. Cancer Res. 2005;65:5498–5505. doi: 10.1158/0008-5472.CAN-04-4553. [DOI] [PubMed] [Google Scholar]
- 9.Skala M, Fontanella A, Hendargo H, Dewhirst M, Izatt J. Combined hyperspectral and spectral domain optical coherence tomography microscope for noninvasive hemodynamic imaging. Opt. Lett. 2009;34:289–291. doi: 10.1364/ol.34.000289. [DOI] [PMC free article] [PubMed] [Google Scholar]
- 10.Vakoc BJ, et al. Three-dimensional microscopy of the tumor microenvironment in vivo using optical frequency domain imaging. Nat. Med. 2009;15:1219–1223. doi: 10.1038/nm.1971. [DOI] [PMC free article] [PubMed] [Google Scholar]
- 11.Dreher MR, et al. Tumor vascular permeability, accumulation, and penetration of macromolecular drug carriers. J. Natl. Cancer Inst. 2006;98:335–344. doi: 10.1093/jnci/djj070. [DOI] [PubMed] [Google Scholar]
- 12.Moeller BJ, Cao Y, Li CY, Dewhirst MW. Radiation activates HIF-1 to regulate vascular radiosensitivity in tumors: role of reoxygenation, free radicals, and stress granules. Cancer Cell. 2004;5:429–441. doi: 10.1016/s1535-6108(04)00115-1. [DOI] [PubMed] [Google Scholar]
- 13.Zhang G, Palmer G, Dewhirst M, Fraser C. A dual-emissive-materials design concept enables tumour hypoxia imaging. Nat. Mater. 2009;8:747–751. doi: 10.1038/nmat2509. [DOI] [PMC free article] [PubMed] [Google Scholar]
- 14.Sorg B, Moeller B, Donovan O, Cao Y, Dewhirst M. Hyperspectral imaging of hemoglobin saturation in tumor microvasculature and tumor hypoxia development. J. Biomed. Opt. 2005;10:44004. doi: 10.1117/1.2003369. doi:10.1117/1.2003369. [DOI] [PubMed] [Google Scholar]
- 15.Shan S, Sorg B, Dewhirst M. A novel rodent mammary window of orthotopic breast cancer for intravital microscopy. Microvasc. Res. 2003;65:109–117. doi: 10.1016/s0026-2862(02)00017-1. [DOI] [PubMed] [Google Scholar]
- 16.Niedre M, et al. Early photon tomography allows fluorescence detection of lung carcinomas and disease progression in mice in vivo. Proc. Natl. Acad. Sci. USA. 2008;105:19126–19131. doi: 10.1073/pnas.0804798105. [DOI] [PMC free article] [PubMed] [Google Scholar]
- 17.Sharpe J, et al. Optical projection tomography as a tool for 3D microscopy and gene expression studies. Science. 2002;296:541–545. doi: 10.1126/science.1068206. [DOI] [PubMed] [Google Scholar]
- 18.Yang G, Pan F, Parkhurst C, Grutzendler J, Gan W. Thinned-skull cranial window technique for long-term imaging of the cortex in live mice. Nat. Protoc. 2010;5:201–208. doi: 10.1038/nprot.2009.222. [DOI] [PMC free article] [PubMed] [Google Scholar]
- 19.Wang LV, Wu H.-i. Biomedical Optics: Principles and Imaging. Wiley-Interscience; 2007. [Google Scholar]
- 20.Balas C. Review of biomedical optical imaging—a powerful, non-invasive, non-ionizing technology for improving in vivo diagnosis. Meas. Sci. Technol. 2009;20 doi:10.1088/0957-0233/20/10/104020. [Google Scholar]
- 21.Zhang H, Maslov K, Stoica G, Wang L. Functional photoacoustic microscopy for high-resolution and noninvasive in vivo imaging. Nat. Biotechnol. 2006;24:848–851. doi: 10.1038/nbt1220. [DOI] [PubMed] [Google Scholar]
- 22.Weissleder R. Molecular Imaging: Principles and Practice. People’s Medical Pub. House; 2009. [Google Scholar]
- 23.Andersson C, Bro R. The N-way Toolbox for MATLAB. Chemom. Intell. Lab. Syst. 2000;52:1–4. [Google Scholar]
- 24.Palmer GM, et al. Optical imaging of tumor hypoxia dynamics. J. Biomed. Opt. 2010;15:066021. doi: 10.1117/1.3523363. doi:10.1117/1.3523363. [DOI] [PMC free article] [PubMed] [Google Scholar]
- 25.Splinter R, Hooper BA. An Introduction to Biomedical Optics. Taylor & Francis; 2007. [Google Scholar]
- 26.Jacques SL. Skin optics. Oregon Medical Laser Center News. 1998 http://omlc.ogi.edu/news/jan98/skinoptics.html.