Abstract
Objective
High-resolution CT angiography (CTA) is currently available using multidetector row CT (MDCT); however, its use for small artery visualisation has been limited. To evaluate its capability, we investigated CTA visualisation for difference in number of the lenticulostriate artery (LSA) branches between normotensive and hypertensive patients, because hypertension is a major cause of LSA damage.
Methods
This was a retrospective study evaluating cerebrovascular CTA at our hospital conducted from February 2008 to June 2009 under approval of the institutional review board. 117 patients (39 males and 78 females, 19–88 years old) were included. CTA was conducted using a 64 channel MDCT. Total numbers of LSA branches were examined for differences by age with regression analysis and the presence or absence of hypertension and/or aneurysm using two-sample t-tests. A p-value <0.016 was considered statistically significant after correction for multiple comparisons. A multiple variable analysis of three factors was also conducted.
Results
The average number of LSA branches was 3.6 [95% confidence interval (CI) 3.0–4.1] and 4.4 (95% CI 4.1–4.7), respectively, for a patient with and without history of hypertension, and the difference was statistically significant (p=0.013). The difference was approximately one branch in the multiple variable analysis. No significant correlation was observed for age and no significant difference was observed for the presence or absence of aneurysms.
Conclusions
Contrast-enhanced CTA can visualise significant differences in the number of LSA branches among patients with and without hypertension.
Advances in knowledge
Current high-resolution CTA can visualise LSA well, which enables finding a difference in the LSA between normotensive subjects and hypertensive patients.
The lenticulostriate artery (LSA) arises mainly from the horizontal part of the middle cerebral artery and feeds the putamen and the surrounding area [1]. It plays an important role in brain pathology [2], such as lacunar infarction [3,4], branch atheromatous disease [5] and brain haemorrhage [6]. Despite its importance, however, the LSA has not been much investigated with imaging modalities, because visualisation of small LSA branches is difficult. It has resulted in only a few image investigations of LSA branches for changes caused by such factors as ageing and hypertension. Small aneurysms were observed in LSA branches by using digital subtraction angiography (DSA) [6,7] in cases of deep brain haemorrhage. DSA allows detailed analysis, but it is invasive and occasional adverse events are inevitable.
There are widely available methods to visualise the cerebral artery in general; contrast-enhanced CT angiography (CTA) and non-contrast-enhanced MR angiography (MRA) with the time-of-flight (TOF) method are frequently used. LSA branches have been successfully visualised with a 7-T MRI scanner by using TOF [8,9], and the relationship between decreased LSA visualisation and hypertension has also been demonstrated [10]. However, availability of a 7-T MRI system is very limited, and it is currently used for research purposes only. There is a study of LSA visualisation in healthy subjects by using a 1.5-T MRI system with a new acquisition method called “flow-sensitive black blood” imaging [11], but its capability in patient groups is yet to be investigated. On the other hand, there are few CTA studies on evaluation of the LSA.
Therefore, in this study we examined visualisation of LSA branches in patient groups by using contrast-enhanced CTA, and investigated their changes in ageing and hypertension.
Methods and materials
This study was approved by the institutional ethical review board. Owing to the retrospective nature of this study, informed consent was waived.
Subjects
Consecutive cases with clinically acquired dynamic enhanced CTA of the brain at our hospital performed from February 2008 to June 2009 were considered. They were examined by CTA for cerebrovascular lesions such as an aneurysm and stenosis. All the cases were included if the original 0.5 mm thick slice data were available, resulting in 248 patients. When a patient was examined multiple times within the period, the first data acquired were adopted. Exclusion criteria were the presence or history of any of the following: brain infarction (n=28), vascular stenosis (n=16), tumour or vascular malformation (n=4), intracranial haemorrhage (n=4), diabetic mellitus (n=25), hyperlipidaemia (n=24) and improper CTA image quality with some overlaps (artefacts and suboptimal contrast enhancement, n=41; Figure 1 shows an accepted case after clipping of an aneurysm) (n=11). All cases were examined with CT images including 0.5 mm thick slices. MRI and MRA were also referred when they were available to check for infarction and vascular stenosis. 16 cases were excluded for infarction diagnosed by MRI and CT (10 cases) or CT only (6 cases). 11 cases were excluded for vascular stenosis diagnosed by CTA.
Figure 1.
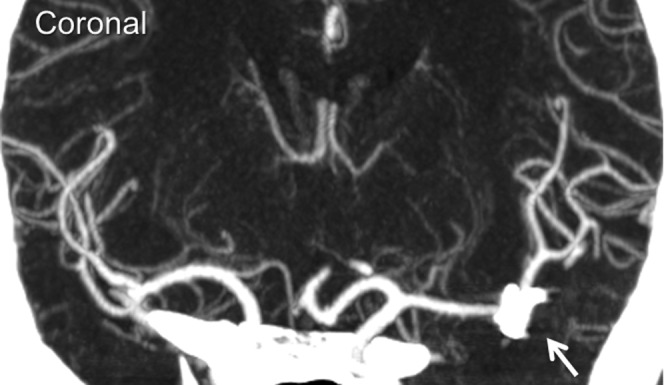
An accepted case with an aneurysm after clipping. Clipping does not deteriorate visualisation of MCA to branches of the lenticulostriate artery.
After application of exclusion criteria, 117 subjects (39 males and 78 females, mean age 61 years, range 19–88 years) were enrolled in this study. 35 patients were diagnosed as having hypertension. The other 82 patients were normotensive. In 117 patients, 79 had intracranial arterial aneurysms before or after treatments, but they had no image artefact at middle cerebral artery (MCA) to LSA nor arterial stenosis. The number of patients with SAH was six, and CT scan was conducted 1 day after clipping in one case, but the others were scanned more than 170 days after surgery. There was overlap of aneurysm and hypertension in 26 patients. Patient characteristics are summarised in Table 1.
Table 1. Patient characteristics.
| Subjects | Disorder | na | Age (years) |
|
| Average±SD | Range | |||
| Total | 117 | 61.2±13.6 | 19–88 | |
| Aneurysmb | (+) | 79 | 61.7±12.2 | 38–88 |
| (–) | 38 | 60.2±16.4 | 19–79 | |
| Hypertensionc | (+) | 35 | 67.2±9.7 | 38–85 |
| (–) | 82 | 58.7±14.3 | 19–88 | |
SD, standard deviation.
Signs of (+) and (–) indicate presence or absence of the disorders.
aThere were overlaps of aneurysm and hypertension in 26 patients.
Statistically significant age difference was observed in patients with and without chypertension (p=0.002), but not in those with and without aneurysmsb (p=0.57).
Image acquisition
CTA was acquired with a 64-channel multirow detector CT (MDCT) (Aquilion64, Toshiba Medical Systems Corporation, Otawara-shi, Japan) at an early phase of administration of iodinated contrast material [300 mgI ml−1, 50 ml (total amount of contrast material used for each patient)], which was injected into the cubital vein at infusion rates of 3–4 ml s−1. The scan parameters were as follows: X-ray tube potential, 120 keV; tube current, 300 mA; field of view, 256×256 mm; matrix, 512×512; and slice thickness, 0.5 mm. The scan was triggered by an increase in CT value by 80 HU at the region of interest placed within the internal carotid artery at the level of the first cervical spine.
Image analysis
CTA data were transferred to a commercially available workstation (AZE VirtualPlace Lexus, AZE Ltd, Tokyo, Japan). The three-dimensional (3D) axial image volumes were reconstructed into coronal and sagittal planes, and maximum intensity projection (MIP) images of four consecutive slices were also constructed. By using 3D MIP and original images, LSA branches were traced from the origin of the horizontal segments of the MCA, and their numbers were counted. When an artery branches within 5 mm from the origin of the MCA, each branch was counted separately [11], because more than 70% of branches were found to originate from common trunks [1]. When an artery branched at a more distal site, only the longest branch was counted. The evaluation was conducted in random order by two experienced radiologists (KG and NS) independently. When there was a difference, a third radiologist (TO) finalised the evaluations. Tracing of an LSA branch is illustrated in Figure 2. Vessels that increase their calibre as they rise cranially were recognised as veins and were not counted.
Figure 2.
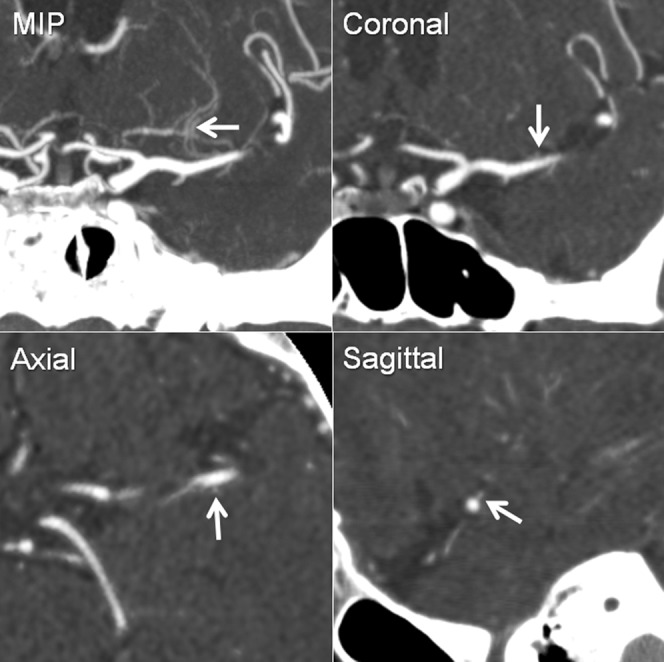
Tracing a lenticulostriate artery branch using multiplaner reformatted images. Each branch visualised in maximum intensity projection images was traced in three orthogonal directions (coronal, axial and sagittal) from the origin from the middle cerebral artery (arrows).
Statistical analysis
Agreement between two independent evaluators for the number of counted LSA branches was calculated as an intraclass correlation coefficient. Because numbers of visualised LSA branches had no laterality [11], branch numbers on the right and left sides were summed and analysed for age, presence or absence of hypertension and/or an aneurysm. A regression analysis was conducted for age, and two-sample t-tests were used for the other two factors. Bonferroni’s correction for multiple comparisons was applied for three comparisons and a p-value less than 0.016 was considered statistically significant. In order to evaluate the effects of the aforementioned variables as a whole, a multiple variable analysis was conducted too. All statistical analyses were conducted using MedCalc (MedCalc Software, Mariakerke, Belgium).
Results
The intraclass correlation coefficient of agreement between two evaluators in detecting LSA branches was 0.83 [95% confidence interval (CI) 0.75–0.88], which was almost perfect agreement. The average numbers of LSA branches visualised were 3.6 (95% CI 3.0–4.1) and 4.4 (95% CI 4.1–4.7), respectively, for patients with and without hypertension (Figure 3). Hypertensive patients had significantly fewer LSA branches than normotensive patients (p=0.013). No significant difference was observed between the presence or the absence of cerebrovascular aneurysm (p=0.68), and age had no significant correlations with the number of visualised branches (p=0.84, see Figure 4). There was a significant difference in mean ages between hypertensive and normotensive patients (p=0.002), which was not the case for the presence or absence of cerebrovascular aneurysms (p=0.57).
Figure 3.
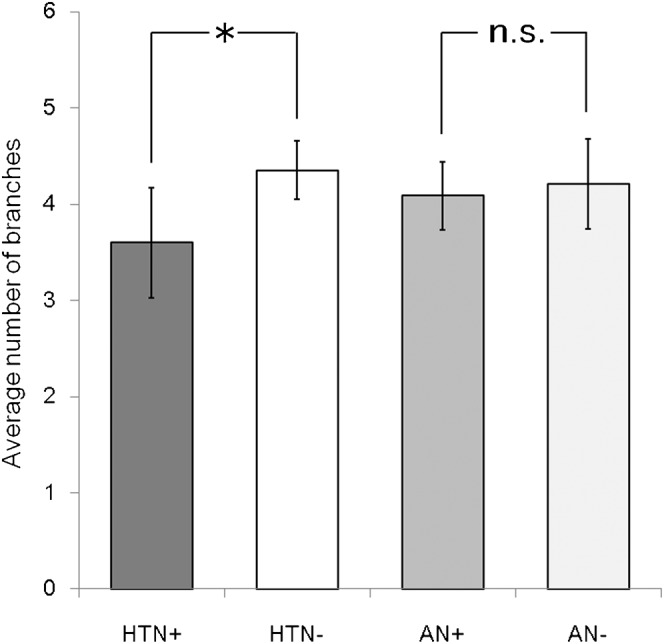
Average number of lenticulostriate artery branches in patients with and without hypertension or cerebrovascular aneurysms: HTN+, HTN–, AN+ and AN–. A statistically significant decrease was observed for patients with hypertension (*p=0.013) compared with normotensive patients. No significant difference was observed for those with a cerebrovascular aneurysm. Bars indicate 95% confidence intervals. HTN, hypertension; AN, aneurysm; n.s. not significant.
Figure 4.
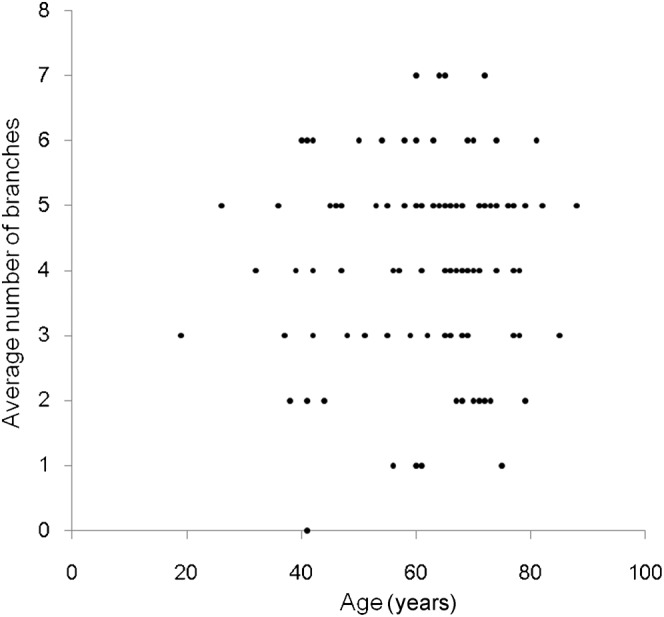
Average number of lenticulostriate artery branches plotted against age. No significant trend was observed.
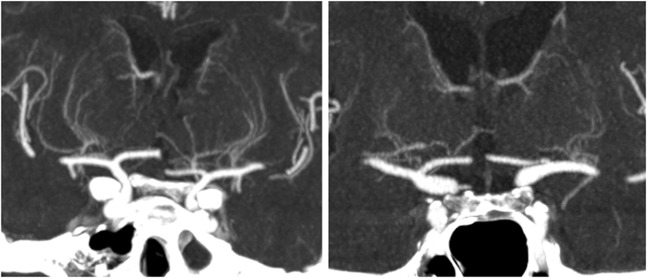
Because there was a significant difference in age between patients with and without hypertension, an additional analysis was conducted for multiple variables of age and the presence or absence of hypertension and/or a cerebrovascular aneurysm. The average number of LSA branches visualised was 3.43 (95% CI 2.84–4.02) and 4.42 (95% CI 4.07–4.76) for patients with and without hypertension, respectively, by multiple variable analysis. Hypertensive patients were found to have fewer LSA branches by 0.99 (95% CI 0.29–1.68, p=0.006; see Figure 5). Age and cerebrovascular aneurysm had no statistically significant effect.
Figure 5.
Illustration of differences in visualised lenticulostriate artery branches between (left) a normotensive patient (60 years old) and (right) a hypertensive patient (61 years old). Large differences were observed in these cases. These images were reconstructed from 0.5-mm original data into a 10-mm coronal slab by using maximum intensity projection.
Discussion
Visualisation of LSA branches using CTA or MRA has been limited to such cases as moyamoya disease, where dilatation of LSA branches is expected [12]. Image fusion of DSA and contrast-enhanced MRI was used to visualise the relation between perforating arteries and normal structures or lesions [13]. Analysis of LSA branches depicted with rotational angiography and 3D reconstructed CT/MR images has provided useful information in patients with cerebrovascular diseases, especially before surgical and endovascular treatment [14]. However, there are only a few CTA studies visualising LSA branches.
In this study, we investigated CTA visualisation of LSA branches and examined their changes caused by ageing and hypertension. We identified hypertension as a significantly correlated factor for reduced LSA branch visualisation by CTA. Reduction was approximately one LSA branch by the multiple variable analysis in hypertension patients compared with normotensive ones. Hypertension is the strongest risk factor in white matter lesions [15], and is known to induce microvascular rarefaction and small vessel damage. It leads to a high incidence of lacunar infarcts [16], because blood supplied to LSA areas comes from end arteries that have little or no collateral circulation. Moreover, hypertension is associated with more than 70% of all intracerebral haemorrhages. Therefore, imaging of the LSA in vivo would offer an important clue for understanding and possible future prevention of microvascular disorders associated with hypertension.
In an imaging study of the LSA by TOF-MRA using a 7 T MR image, there was a significant difference in LSA visualisation between subjects with and without hypertension at age 45 years or under [10]. The others found no such difference in subjects more than 45 years old. In our study, no age-correlated change in LSA branch numbers was detected. These different results might be related to differences in the methods of imaging studied. TOF-MRA visualises an artery at high signal intensity. It is dependent on blood inflow [17], but cerebral blood flow and volume decrease with age by approximately 0.50% per year [18,19] due to diminished neuronal firing and decreased dendritic synaptic density with age. Reduced inflow attenuates the signal of LSA branches observed by TOF-MRA, and may obscure the effect of hypertension in elderly subjects. In fact, the TOF-MRA study with a 7-T MRI scanner found fewer LSA branches in subjects over 45 years old than in those under 45 years [10]. CTA is less affected by arterial inflow and demonstrates the patency and size of the LSA. This difference may explain the lack of a significant correlation between age and number of LSA branches observed by CTA. Such characteristics of CTA may have some advantage for LSA evaluation over TOF-MRA at 7 T. Greater availability of MDCT would also be advantageous.
CTA visualisation of the LSA is limited by the resolution, i.e. isotropic 0.5 mm in this case. TOF-MRA using a 7-T MRI scanner can reach a resolution of 0.23 mm in about 10 min [8,10]. The CT scanners used in this study had 0.5-mm isotropic resolution, which may not be sufficient for small LSA branches, because diameters of LSA branches range from 80 to 1400 mm [20]. Therefore, numbers of LSA branches were evaluated in this study, but their length to distal areas was not investigated. Improvement of CT resolution might improve this limitation in the near future.
The patient population of this study may be another issue. Owing to radiation exposure and the use of contrast material that may cause adverse effects, available CTA data had some factors other than hypertension. By applying exclusion criteria, possible confounding factors such as diabetes mellitus, hyperlipidaemia and image artefacts were excluded. However, some potential factors remained that could have an effect. Age and the presence of a cerebral aneurysm may also have some influence on LSA visualisation, even after exclusion of cases with stenosis or artefacts at MCA and LSA regions. In addition to single variable analyses separately conducted for age and cerebrovascular aneurysms, multiple variable analysis was used to determine their influence, and no significant effect was found.
Conclusions
This study demonstrated that CTA can detect pathophysiological changes manifested as a decreased number of visualised LSA branches. A large cohort or a follow-up study of each patient for time-course changes by hypertension may contribute to early detection of patients who are at high risk of infarct and haemorrhage caused by hypertension.
References
- 1.Marinkovic SV, Gibo H. The surgical anatomy of the perforating branches of the basilar artery. Neurosurgery 1993;33:80–7 [DOI] [PubMed] [Google Scholar]
- 2.Greenberg SM. Small vessels, big problems. N Engl J Med 2006;354:1451–3 [DOI] [PubMed] [Google Scholar]
- 3.Wardlaw JM, Dennis MS, Warlow CP, Sandercock PA. Imaging appearance of the symptomatic perforating artery in patients with lacunar infarction: occlusion or other vascular pathology? Ann Neurol 2001;50:208–15 [DOI] [PubMed] [Google Scholar]
- 4.Feekes JA, Cassell MD. The vascular supply of the functional compartments of the human striatum. Brain 2006;129:2189–201 [DOI] [PubMed] [Google Scholar]
- 5.Caplan LR. Intracranial branch atheromatous disease: a neglected, understudied, and underused concept. Neurology 1989;39:1246–50 [DOI] [PubMed] [Google Scholar]
- 6.Ahn JY, Cho JH, Lee JW. Distal lenticulostriate artery aneurysm in deep intracerebral haemorrhage. J Neurol Neurosurg Psychiatr 2007;78:1401–3 [DOI] [PMC free article] [PubMed] [Google Scholar]
- 7.Gandhi CD, Gilad R, Patel AB, Haridas A, Bederson JB. Treatment of ruptured lenticulostriate artery aneurysms. J Neurosurg 2008;109:28–37 [DOI] [PubMed] [Google Scholar]
- 8.Kang CK, Park CW, Han JY, Kim SH, Park CA, Kim KN, et al. Imaging and analysis of lenticulostriate arteries using 7.0-Tesla magnetic resonance angiography. Magn Reson Med 2009;61:136–44 [DOI] [PubMed] [Google Scholar]
- 9.Cho ZH, Kang CK, Han JY, Kim SH, Kim KN, Hong SM, et al. Observation of the lenticulostriate arteries in the human brain in vivo using 7.0 T MR angiography. Stroke 2008;39:1604–6 [DOI] [PubMed] [Google Scholar]
- 10.Kang CK, Park CA, Lee H, Kim SH, Park CW, Kim YB, et al. Hypertension correlates with lenticulostriate arteries visualized by 7 T magnetic resonance angiography. Hypertension 2009;54:1050–6 [DOI] [PubMed] [Google Scholar]
- 11.Gotoh K, Okada T, Miki Y, Ikedo M, Ninomiya A, Kamae T, et al. Visualization of the lenticulostriate artery with flow-sensitive black-blood acquisition in comparison with time-of-flight MR angiography. J Magn Reson Imaging 2009;29:65–9 [DOI] [PubMed] [Google Scholar]
- 12.Fushimi Y, Miki Y, Kikuta K, Okada T, Kanagaki M, Yamamoto A, et al. Comparison of 3.0- and 1.5-T three-dimensional time-of-flight MR angiography in moyamoya disease: preliminary experience. Radiology 2006;239:232–7 [DOI] [PubMed] [Google Scholar]
- 13.Shimizu S, Suzuki H, Maki H, Maeda M, Miya F, Benali K, et al. A novel image fusion visualizes the angioarchitecture of the perforating arteries in the brain. AJNR Am J Neuroradiol 2003;24:2011–4 [PMC free article] [PubMed] [Google Scholar]
- 14.Kang HS, Han MH, Kwon BJ, Kwon OK, Kim SH, Chang KH. Evaluation of the lenticulostriate arteries with rotational angiography and 3D reconstruction. AJNR Am J Neuroradiol 2005;26:306–12 [PMC free article] [PubMed] [Google Scholar]
- 15.Shinohara Y, Tohgi H, Hirai S, Terashi A, Fukuuchi Y, Yamaguchi T, et al. Effect of the Ca antagonist nilvadipine on stroke occurrence or recurrence and extension of asymptomatic cerebral infarction in hypertensive patients with or without history of stroke (PICA Study). 1. Design and results at enrollment. Cerebrovasc Dis 2007;24:202–9 [DOI] [PubMed] [Google Scholar]
- 16.Gouw AA, van derFlier WM, Fazekas F, van Straaten EC, Pantoni L, Poggesi A, et al. Progression of white matter hyperintensities and incidence of new lacunes over a 3-year period: the Leukoaraiosis and Disability Study. Stroke 2008;39:1414–20 [DOI] [PubMed] [Google Scholar]
- 17.Nishimura DG. Time-of-flight MR angiography. Magn Reson Med 1990;14:194–201 [DOI] [PubMed] [Google Scholar]
- 18.Leenders KL, Perani D, Lammertsma AA, Heather JD, Buckingham P, Healy MJ, et al. Cerebral blood flow, blood volume and oxygen utilization. Normal values and effect of age. Brain 1990;113:27–47 [DOI] [PubMed] [Google Scholar]
- 19.Buijs PC, Krabbe-Hartkamp MJ, Bakker CJ, de Lange EE, Ramos LM, Breteler MM, et al. Effect of age on cerebral blood flow: measurement with ungated two-dimensional phase-contrast MR angiography in 250 adults. Radiology 1998;209:667–74 [DOI] [PubMed] [Google Scholar]
- 20.Marinkovic S, Gibo H, Milisavljevic M, Cetkovic M. Anatomic and clinical correlations of the lenticulostriate arteries. Clin Anat 2001;14:190–5 [DOI] [PubMed] [Google Scholar]


