Abstract
Objective
We investigated the use of micro-CT with contrast agent for the non-invasive characterisation of fixed mouse brain tissue specimens as a means to differentiate between grey and white matter.
Methods
Nine mice were divided into two groups for micro-CT (n=6) and myelin staining (n=3) experiments. Six mice underwent in vivo micro-CT and were then prepared for brain specimens by transcardiac perfusion with paraformaldehyde. The six mouse brains were soaked in two different concentrations of non-ionic iodinated contrast agents (60 and 150 mg ml−1). Immersion times used for each concentration of iodine were for 3, 7 and 14 days. Three-dimensional ex vivo micro-CT images were acquired with a resolution of 39 μm3 to create isotropic images. The other three mice were stained for evaluation of the myelin structure.
Results
Soaking the brains in non-ionic iodinated contrast agent resulted in clear differences in signal between the grey matter, the white matter and the ventricular spaces. The 150 mg ml−1 contrast agent solution yielded images with better contrast-to-noise ratio (CNR) than 60 mg ml−1 iodine contrast agent solution. 14 days of soaking yielded images with better CNR than 3 and 7 days. The CT contrast of grey and white matter derived from the iodine-soaked fixed brains was strongly related to tissue myelin.
Conclusion
The present study demonstrated that micro-CT can be used to detect the mouse brain myelin structure at 3, 7 and 14 days after fixation using a CT contrast agent.
Histological experiments can provide high-resolution images of a wide range of specific stains in the brain tissue such as haematoxylin and eosin, neural cell adhesion molecule [1], glial fibrillary acidic protein [2] and luxal fast blue [3]. However, these methods are destructive and provide only two-dimensional (2D) images, and three-dimensional (3D) information is difficult to obtain. Moreover, the thin sectioning and staining processes result in tissue shrinkage and geometric distortion, and the staining process is usually time-consuming. High-resolution MRI for non-destructive microscopic analysis of tissue specimens has been proposed [4-6]. Although the in-plane resolution of MRI is far inferior to that of light microscopy using histological sections, it has excellent soft tissue contrast (such as T1 and T2), is non-destructive and can provide true 3D image data [7], making it a valuable tool for the study of fixed tissue specimens. However, geometric distortion has long been regarded as an inferior aspect of MRI.
CT images are usually regarded as geometrically correct, while MRI images are known to suffer from geometric distortion. For this reason, registration of CT and MR images are performed to define the different target regions used in radiotherapy treatment planning [8]. Moreover, high-field and small-bore MRI remain relatively expensive and difficult to site. Conversely, X-ray micro-CT systems are cheaper than animal MRI systems, and much cheaper to maintain. We have investigated the use of 3D micro-CT for the non-invasive characterisation of fixed brain tissue specimens as a means to differentiate between grey and white matter within a few minutes.
Although micro-CT imaging has generally been performed ex vivo, recent advances allow for similar imaging protocols to be performed in vivo [9]. While micro-CT has proven to be a very effective tool for imaging of bone, soft tissue imaging usually requires the use of X-ray absorbing contrast agents because there is very little difference in density and X-ray absorption among different tissue types, especially in the brain. In fixed tissue samples, injected X-ray contrast agents have been used to enhance joint spaces in knee specimens [10], in rodent lungs [11] and in rabbit brains [12]. Previous high-resolution MRI diffusion tensor studies of perfusion-fixed mice, rat, macaque and rabbit brains that were stained by soaking with gadolinium–diethylene triamine pentaacetic acid (Gd-DTPA) showed excellent contrast between grey and white matter [13]. However, MRI scanning is difficult and requires many more steps to acquire images than micro-CT.
The purpose of the present work was to determine whether a similar approach involving immersion of brain tissue in a CT non-ionic iodinated contrast agent prior to micro-CT imaging can yield images with useful anatomical contrast, comparable with that obtained by myelin staining.
Methods and materials
Animal preparation
The Animal Welfare Committee of Osaka University approved this study. C57BL/6 mice (n=9, weight=23.2±1.6 g; Japan SLC, Hamamatsu, Japan) were allowed to rest for 1 week before the experiment. The animals had free access to food and water, and were kept under standard laboratory conditions with a room temperature of 22–23 °C, approximately 50% humidity and a 12-h light/dark cycle. Nine mice were divided into two groups for micro-CT (n=6) and myelin staining (n=3) experiments. First, we performed in vivo micro-CT for assessment of the brain contrast without iodine contrast agent soaking. Next, the micro-CT tissue immersion and imaging protocol were evaluated in six normal fixed adult male C57BL/6 mice (perfusion fixed with 7.5% paraformaldehyde). The six mouse brains were soaked in two different concentrations—60 mg ml−1 (n=3) and 150 mg ml−1 (n=3)—of non-ionic iodinated contrast agent (Iopamiron®; Bayer Schering Pharma, Tokyo, Japan) diluted with paraformaldehyde. These mouse brains were soaked in their respective solutions at 4 °C for 3, 7 and 14 days. The other three mice were used for myelin staining examination.
Micro-CT
CT images were acquired using 3D micro-CT (RmCT; Rigaku Co., Tokyo, Japan) with a resolution of 39×39×39 μm, tube potential peaks of 70 kVp and 90 kVp, and tube current of 200 μA, with exposure times of 17 s, 2 min and 8 min (limit of this micro-CT). Tomographic images were obtained using 3D imaging software (i-VIEW; Morita Co., Tokyo, Japan). 3D reconstruction was performed using 512 of these images processed by the volume rendering method.
Histological experiments
Three mice were used for histology in order to clarify the source of Hounsfield unit alterations in the mouse white and grey matter. Three mice were euthanised by an overdose of pentobarbital (Dainippon Sumitomo Pharma Co., Osaka, Japan) and were prepared for histology by transcardiac perfusion with saline containing heparin followed by 7.5% paraformaldehyde. The extracted brains (with skulls) were embedded in paraffin and coronal slices of 5 μm thickness were taken, corresponding to the coronal diagram and orientations on the CT images. Slides were processed for LFB (luxal fast blue). LFB staining was performed to assess the myelin formation in brain tissue [3].
Data processing and statistical analysis
Regions of interest were measured on mouse brain CT images of white and grey matter in locations matching those used for calculation of the contrast-to-noise ratio (CNR). The noise level was defined as the standard deviation of voxels in a homogeneous region of cortical grey matter. CNR calculations were done on the CT image Hounsfield unit. The 3D CT data volumes and myelin staining were compared visually to identify four anatomical structures: the corpus callosum, cingulum, external capsule and anterior commissure.
All statistical data are presented as mean ± standard deviation. All statistical analyses were performed using Prism5 v. 5 (Prism Software, Irvine, CA) and were focused on the differences of CNR between 3, 7 and 14 days immersion, 70 and 90 kVp tube potential peaks, 17 s, 2 and 8 min scans, 60 and 150 mg ml−1 non-ionic iodinated contrast agent concentration. The unpaired t-test and one-way analysis of variance were applied in order to compare CNR changes across groups of animals. Statistical significance was defined as p<0.05.
Results
Observation of ex vivo mouse brains using micro-CT
Figure 1 shows (a, b) 2D axial and (c, d) horizontal sections through the 3D CT data volume of the normal mouse brains for each section at approximately the same anatomical level for the different contrast agent concentrations. Non-ionic iodinated contrast agent concentrations were (a, c) 60 and (b, d) 150 mg ml−1. Soaking the brains in contrast agent resulted in clear differences in signal between the grey matter, the white matter and the ventricular spaces in the mouse brains. The 150 mg ml−1 iodine contrast agent solution (CNR: 3.8±0.6) yielded images with better CNR than the 60 mg ml−1 solution (CNR: 2.4±1.3) at 3 days′ immersion. The CNR was significantly increased by approximately 58% in 150 mg ml−1 as compared with 60 mg ml−1 (Figure 1) (p<0.0001).
Figure 1.
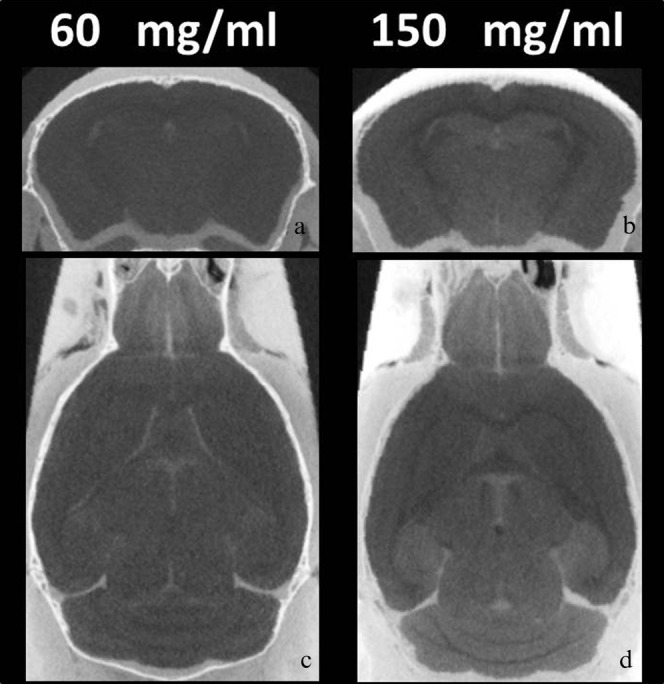
Micro-CT images with different non-ionic iodinated contrast agent concentrations. (a) Typical axial image of micro-CT with 60 mg ml−1 non-ionic iodinated contrast agent. (b) Typical axial image of micro-CT with 150 mg ml−1 contrast agent. (c) Typical horizontal image of micro-CT with 60 mg ml−1 contrast agent. (d) Typical horizontal image of micro-CT with 60 mg ml−1 contrast agent 150 mg ml−1. Soaking the brains in contrast agent resulted in clear differences in signal between the grey matter, the white matter and the ventricular spaces in the mouse brains. The CNR was significantly increased in 150 mg ml−1 as compared with 60 mg ml−1 (p<0.0001).
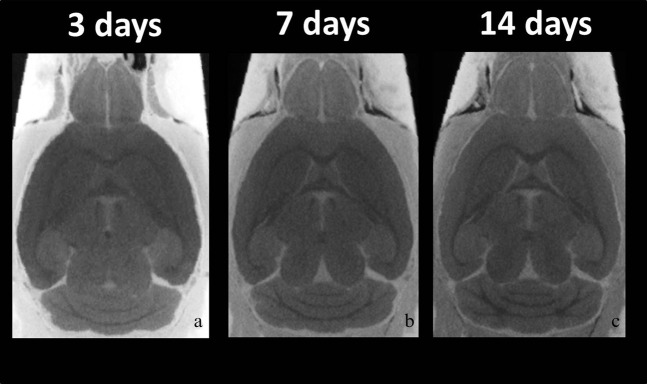
Figure 2 shows 2D horizontal sections through the 3D CT data volume (each section at approximately the same anatomical level) at (a) 3 days, (b) 7 days and (c) 14 days after immersion. 14 days (CNR: 8.1±0.8) of soaking the brains in contrast agent resulted in the clearer signal differences between the grey matter, the white matter and the ventricular spaces than 3 (CNR: 3.8±0.6) and 7 days (CNR: 6.8±0.8) of immersion. The CNR was significantly increased by approximately 110% for 14 days as compared with 3 days (Figure 2; p<0.0001).
Figure 2.
Micro-CT images with different immersion times. Typical micro-CT images at (a) 3 days, (b) 7 days and (c) 14 days after immersion. 14 days of soaking the brains in contrast agent resulted in clearer signal differences between the grey matter, the white matter and the ventricular spaces than 3 and 7 days of immersion. The contrast-to-noise ratio values were significantly increased at 7 and 14 days as compared with 3 days (p<0.0001).
Figure 3 shows 2D horizontal sections through the 3D CT data volume at different X-ray tube potential peaks of (a) 70 kVp and (b) 90 kVp after 7 days of immersion. 90 kVp (CNR: 6.8±0.8) after soaking the brains in contrast agent, resulted in clearer signal differences between grey matter, white matter and ventricular spaces than 70 kVp (CNR: 5.8±0.4). The CNR was significantly increased by approximately 17% with 90 kVp compared with 70 kVp (Figure 3; p<0.001).
Figure 3.
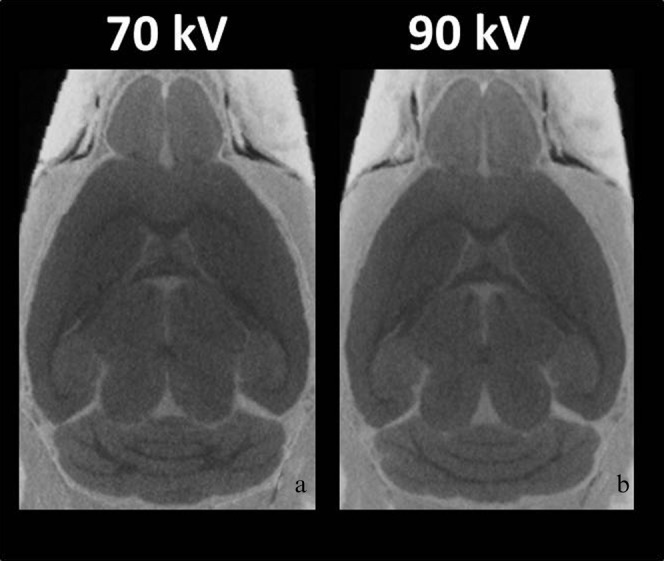
Micro-CT images with different X-ray peak potentials. Typical micro-CT images at (a) 70 kVp and (b) 90 kVp. The contrast-to-noise ratios were significantly increased at 90 kVp compared with 70 kVp (p<0.001).
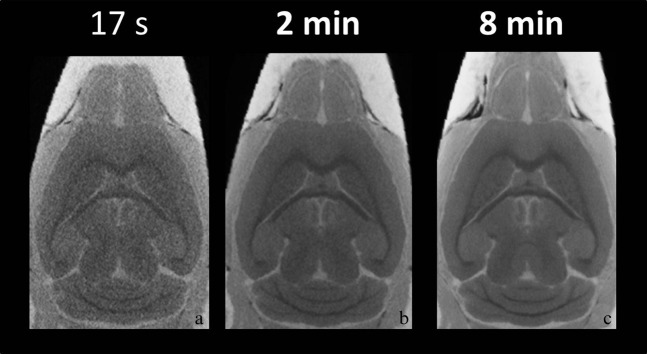
Figure 4 shows 2D horizontal sections through the 3D CT data volume at different scan times of (a) 17 s, (b) 2 min and (c) 8 min after 14 days of immersion. 8 min (CNR: 8.3±0.4) and 2 min (CNR: 7.2±0.5) scan times, after soaking the brains in contrast agent, resulted in clearer signal differences between grey matter and white matter than did 17 s (CNR: 2.4±0.8). The CNR was significantly increased by approximately 345% with the 8-min scan compared with the 17-s scan (Figure 4c; p<0.001). Also, the CNR was significantly increased by approximately 300% with the 2-min scan compared with the 17-s scan (Figure 4b; p<0.001).
Figure 4.
Micro-CT images with different scanning time. Typical micro-CT images at (a) 17 s, (b) 2 min and (c) 8 min. The contrast-to-noise ratios were significantly increased at 2 and 8 min compared with 17 s (p<0.001).
Comparison of in vivo and ex vivo mouse brains using micro-CT
Figure 5 shows 2D (a, b) axial, (c, d) horizontal and (e, f) sagittal sections through the 3D CT data volume of the normal mouse brains (a, c, e) in vivo and (b, d, f) ex vivo for each section at approximately the same anatomical level. Ex vivo soaking of the brains in non-ionic iodinated contrast agent resulted in clearer signal differences between the grey matter, the white matter and the ventricular spaces than in vivo micro-CT images. The olfactory bulb, hippocampus, caudate putamen and cerebellum were readily distinguishable. However, the brain structures were not visible on in vivo micro-CT images (Figure 5a, c, e).
Figure 5.
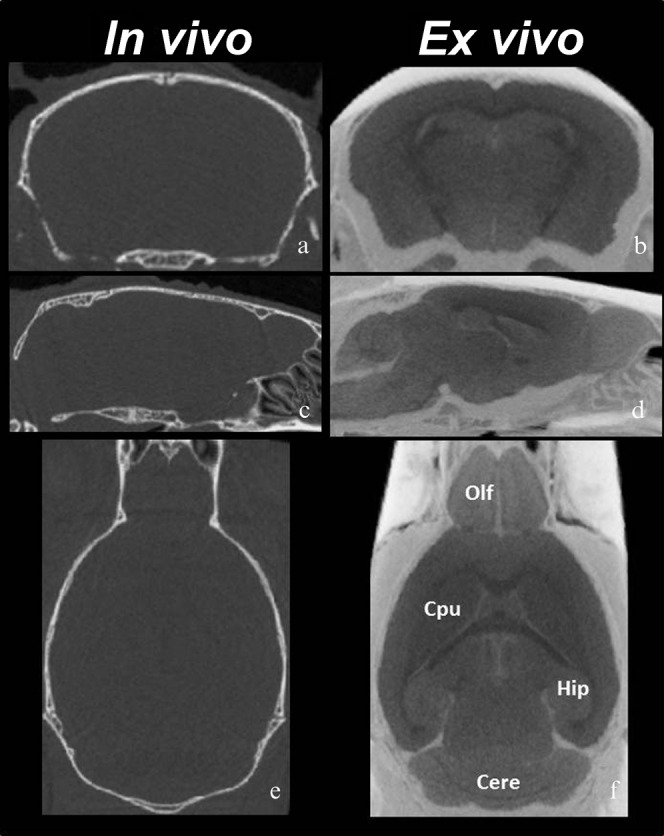
In vivo and ex vivo Micro-CT images. Three-plane images of (a, c, e) in vivo and (b, d, f) ex vivo micro-CT studies. The ex vivo images show clearer signal differences between the grey matter, the white matter and the ventricular spaces than the in vivo images. (a, b) axial, (c, d) horizontal and (e, f) sagittal sections. Brain structures including olfactory bulb (Olf), hippocampus (Hip), caudate putamen (Cpu) and cerebellum (Cere) are readily distinguishable.
Comparison of ex vivo and myelin staining mouse brains using micro-CT
A comparison between matching axial sections extracted from the inverted 3D CT and myelin histology of fixed mouse brains is shown in Figure 6. The 3D CT data volumes and myelin staining could identify the four anatomical structures of corpus callosum (Figure 6a), cingulum (Figure 6b), external capsule (Figure 6c) and anterior commissure (Figure 6d). These typical structures annotated on the myelin-stained sections from the mouse brain atlas [14] were clearly apparent on the CT images (Figure 6).
Figure 6.
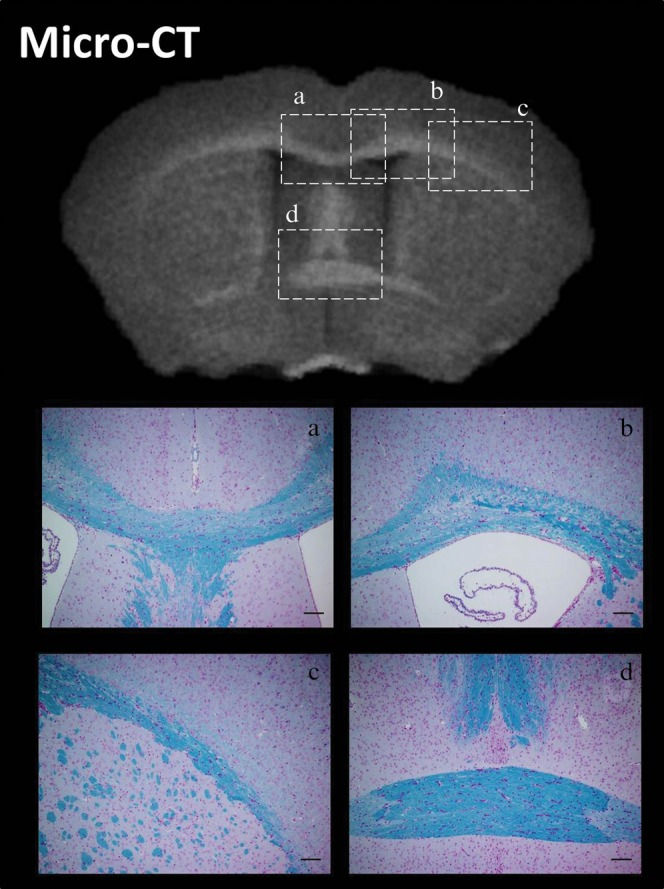
Inverted micro-CT images and myelin staining. Axial CT inverted images at 7 days after 150 mg ml−1 non-ionic iodinated contrast agent immersion (top image) and myelin staining were compared visually to identify four known anatomical structures: (a) corpus callosum, (b) cingulum, (c) external capsule and (d) anterior commissure.
Discussion
The present study demonstrated that micro-CT can be used for the detection of mouse brain myelin structures at 3, 7 and 14 days after soaking in CT contrast agent. We also investigated whether a similar approach involving immersion of brain tissue in a CT contrast agent prior to micro-CT imaging can yield images with useful anatomical contrast, comparable with that obtained by myelin staining.
There is little soft tissue contrast in CT images of normal mouse brain grey and white matter at around 30–40 HU (Figure 4a). In our method, the ex vivo micro-CT contrast is due to differential uptake of the non-ionic iodinated contrast agent into the tissue as a result of passive diffusion. Our data indicate that, after soaking the tissue in contrast agent, the resultant contrast enhancement is greatest in grey matter, intermediate in peripheral white matter and smallest in densely myelinated white matter tracts such as the corpus callosum (Figure 5a), cingulum (Figure 5b), external capsule (Figure 5c) and anterior commissure (Figure 5d). The CNRs were significantly increased by approximately 58% in 150 mg ml−1 as compared with 60 mg ml−1 (Figure 1). Thus, variations in tissue X-ray attenuation will be proportional to the concentration of non-ionic iodine anion in the mobile water in each brain tissue. In addition, the CNR values were significantly increased at 7 and 14 days compared with 3 days (Figure 2), suggesting that all of the mobile water within the sample has reached an equilibrium contrast agent concentration equal to that of bulk water in the sample container by around 7 days. Since water content varies with cell type and is lower in axons, particularly highly myelinated axons [15], the contrast in our contrast-enhanced micro-CT images of a normal brain reflects the local axonal, and particularly myelin, density.
The micro-CT contrast we see in non-ionic iodinated contrast-agent-soaked fixed brain is inverted and amplified compared with that seen in in vivo non-contrast CT (Figure 3). The denser tissue such as white matter that attenuates slightly more than grey matter in vivo is less attenuated after soaking ex vivo precisely because of its lower water content. Therefore, our ex vivo images show inverted images to clarify the white and grey matter structures in the upper image of Figure 6. In general we would expect to see greater contrast in fixed tissue using our ex vivo approach than is visible in non-contrast CT in vivo. Previous reports have shown a high correlation between brain tissue and glioma using in vivo and ex vivo measurements, indicating that tumour volume measurements are not significantly affected by changes in brain tissue ex vivo dimensions by superimposition of histological slices and corresponding micro-CT slices [12]. Therefore, our technique permits soft tissue characterisation in mouse brain specimens with contrast and spatial resolution comparable with that of myelin staining (Figure 6). MRI diffusion tensor studies of perfusion-fixed rodent brains stained by soaking with Gd-DTPA showed excellent contrast between grey and white matter [13]. The image resolution of micro-CT with non-ionic iodinated contrast agent in our study (8-min scanning, 39×39×39 μm3) was higher than that of MRI with Gd-DTPA (5-h scanning, 110×110×110 μm3) [13]. Usually, CT images are regarded as geometrically correct, while MR images are known to suffer from geometric distortion. Aggarwal et al [16] developed in vivo MRI adult mouse brain stereotaxic atlas, and a distortion-corrected DTI atlas was generated by non-linearly warping ex vivo CT data. Therefore, our method has potential to increase the accuracy of structural co-ordinates for tissue distortion caused by MRI scanning and fixation, and to use non-distortion 3D rodent atlas as in the previous report [16]. Another advantage of this approach is that micro-CT scanners are much cheaper than high-field MRI equipment and systems, and are much cheaper to site and maintain. Our technique therefore has the potential for more widespread application than animal MRI.
There are significant limitations to our proposed technique and clearly it is not intended to replace conventional histological experiment. Conventional histopathology on 5- to 10-μm tissue sections provides more detailed information on cellular morphology that is not accessible at the resolution of our data (39 μm3). In many cases, however, gross measurements on thicker tissue sections are adequate for determining, for example, the lesion load in each organ. Our method may prove to be time saving as it requires only a few minutes in a non-destructive alternative method. A previous report indicated that ex vivo micro-CT imaging of fixed glioma bearing mouse brains results in tumour volumes close to histology with 5 h of CT scanning [12]. Their approach provides more detailed images than our method. However, we can detect the myelin structure within a few minutes of scanning in the mouse brain. The CNR was significantly increased at 90 kVp as compared with 70 kVp since ring artefacts were increased (Figure 3). The CNR was significantly increased at the 8-min scan as compared with the 17 s scan (Figure 4). Future studies could attempt to improve the CNR between white and grey matter using more appropriate imaging parameter and scanning times.
In conclusion, the present study demonstrated that micro-CT can be used for the detection of mouse brain myelin structure after 3, 7 and 14 days of fixation using a CT contrast agent. Micro-CT provides more relevant information on the myelin structure.
References
- 1.Sakata-Haga H, Sawada K, Ohta K, Cui C, Hisano S, Fukui Y. Adverse effects of maternal ethanol consumption on development of dorsal hippocampus in rat offspring. Acta Neuropathol 2003;105:30–6 [DOI] [PubMed] [Google Scholar]
- 2.Krasnova IN, Ladenheim B, Cadet JL. Amphetamine induces apoptosis of medium spiny striatal projection neurons via the mitochondria-dependent pathway. FASEB J 2005;19:851–3 [DOI] [PubMed] [Google Scholar]
- 3.Sjobeck M, Haglund M, Englund E. Decreasing myelin density reflected increasing white matter pathology in Alzheimer's disease–a neuropathological study. Int J Geriatr Psychiatry 2005;20:919–26 [DOI] [PubMed] [Google Scholar]
- 4.Augustinack JC, van derKouwe AJ, Blackwell ML, Salat DH, Wiggins CJ, Frosch MP, et al. Detection of entorhinal layer II using 7 Tesla [corrected] magnetic resonance imaging. Ann Neurol 2005;57:489–94 [DOI] [PMC free article] [PubMed] [Google Scholar]
- 5.Boyko OB, Alston SR, Fuller GN, Hulette CM, Johnson GA, Burger PC. Utility of postmortem magnetic resonance imaging in clinical neuropathology. Arch Pathol Lab Med 1994;118:219–25 [PubMed] [Google Scholar]
- 6.Johnson GA, Cofer GP, Gewalt SL, Hedlund LW. Morphologic phenotyping with MR microscopy: the visible mouse. Radiology 2002;222:789–93 [DOI] [PubMed] [Google Scholar]
- 7.Johnson GA, Benveniste H, Black RD, Hedlund LW, Maronpot RR, Smith BR. Histology by magnetic resonance microscopy. Magn Reson Q 1993;9:1–30 [PubMed] [Google Scholar]
- 8.Fransson A, Andreo P, Potter R. Aspects of MR image distortions in radiotherapy treatment planning. Strahlenther Onkol 2001;177:59–73 [DOI] [PubMed] [Google Scholar]
- 9.Barck KH, Lee WP, Diehl LJ, Ross J, Gribling P, Zhang Y, et al. Quantification of cortical bone loss and repair for therapeutic evaluation in collagen-induced arthritis, by micro-computed tomography and automated image analysis. Arthritis Rheum 2004;50:3377–86 [DOI] [PubMed] [Google Scholar]
- 10.Schnier M, Eckstein F, Priebsch J, Haubner M, Sittek H, Becker C, et al. Three-dimensional thickness and volume measurements of the knee joint cartilage using MRI: validation in an anatomical specimen by CT arthrography. [In German.] Rofo 1997;167:521–6 [DOI] [PubMed] [Google Scholar]
- 11.Langheinrich AC, Leithauser B, Greschus S, Von Gerlach S, Breithecker A, Matthias FR, et al. Acute rat lung injury: feasibility of assessment with micro-CT. Radiology 2004;233:165–71 [DOI] [PubMed] [Google Scholar]
- 12.de Crespigny A, Bou-Reslan H, Nishimura MC, Phillips H, Carano RA, D'Arceuil HE. 3D micro-CT imaging of the postmortem brain. J Neurosci Methods 2008;171:207–13 [DOI] [PMC free article] [PubMed] [Google Scholar]
- 13.D'Arceuil H, de Crespigny A. The effects of brain tissue decomposition on diffusion tensor imaging and tractography. Neuroimage 2007;36:64–8 [DOI] [PMC free article] [PubMed] [Google Scholar]
- 14.Paxinos G, Franklin KBJ. Mouse brain in stereotaxic coordinates. Waltham, MA: Academic Press; 2008 [Google Scholar]
- 15.Weng JC, Chen JH, Kuo LW, Wedeen VJ, Tseng WY. Maturation-dependent microstructure length scale in the corpus callosum of fixed rat brains by magnetic resonance diffusion-diffraction. Magn Reson Imaging 2007;25:78–86 [DOI] [PubMed] [Google Scholar]
- 16.Aggarwal M, Zhang J, Miller MI, Sidman RL, Mori S. Magnetic resonance imaging and micro-computed tomography combined atlas of developing and adult mouse brains for stereotaxic surgery. Neuroscience 2009;162:1339–50 [DOI] [PMC free article] [PubMed] [Google Scholar]


