

Abstract
Objectives
This study was designed to evaluate the extent of the radiofrequency ablation zone in relation to the time interval between transcatheter arterial embolisation (TAE) and radiofrequency ablation (RFA) and, ultimately, to determine the optimal strategy of combining these two therapies for hepatocellular carcinoma.
Methods
15 rabbits were evenly divided into three groups: Group A was treated with RFA alone; Group B was treated with TAE immediately followed by RFA; and Group C was treated with TAE followed by RFA 5 days later. All animals underwent perfusion CT (PCT) scans immediately after RFA. Serum liver transaminases were measured to evaluate acute liver damage. Animals were euthanised for pathological analysis of ablated tissues 10 days after RFA. Non-parametric analyses were conducted to compare PCT indices, the RFA zone and liver transaminase levels among the three experimental groups.
Results
Group B showed a significantly larger ablation zone than the other two groups. Arterial liver perfusion and hepatic perfusion index represented well the perfusion decrease after TAE on PCT. Although Group B showed the most elevated liver transaminase levels at 1 day post RFA, the enzymes decreased to levels that were not different from the other groups at 10 days post-RFA.
Conclusions
When combined TAE and RFA therapy is considered, TAE should be followed by RFA as quickly as possible, as it can be performed safely without serious hepatic deterioration, despite the short interval between the two procedures.
Surgical resection is still considered standard curative therapy for hepatocellular carcinomas (HCCs), but only a small proportion of patients can undergo curative resection at initial presentation owing to the advanced stage of HCCs or liver dysfunction caused by an underlying liver disease [1,2]. Therefore, local ablation therapy, such as radiofrequency ablation (RFA), has been widely utilised as an alternative treatment. RFA shows promising results for managing HCCs less than 3 cm in diameter [3,4]. However, managing medium-sized and large HCCs with RFA seems to be less robust owing to the limited ablation zone. One of the main reasons is that intratumoral energy by RFA is insufficient to produce complete coagulation necrosis of liver tumours probably because of the heat dispersion by blood flow. To overcome these problems, transcatheter arterial embolisation (TAE) can reduce the heat sink effect for subsequent RFA when TAE is followed by RFA, which can lead to a larger ablation zone to treat larger HCCs [5-7]. Therefore, the combined therapy is beneficial compared with TAE or RFA alone due to a synergistic effect of those two therapies, particularly when treating larger HCCs (i.e. >3 cm diameter) that do not respond adequately to either procedure alone [6,8-13].
No consensus exists on the time interval between combined TAE and RFA. Kang et al [13] reported on a single-session combined therapy in which RFA was performed immediately following chemoemobolisation. Takaki et al [12] reported on a dual-session combined therapy in which RFA was performed 1–2 weeks after TAE. The extent of the ablation zone and the safety of combined therapy in relation to the time interval between the two treatments have not been investigated. During the single-session combined therapy, the ablation zone is assumed to be larger than the dual-session combined therapy owing to the maximised perfusion reduction by TAE just prior to RFA. However, acute liver damage may be more severe with the single-session combined therapy than with the dual-session combined therapy.
The aim of this study was to evaluate the differences in liver perfusion, the extent of the ablation zone and the degree of acute liver damage according to the time interval between TAE and RFA, and to determine the optimal strategy for combining these two therapies for treating HCCs.
Methods and materials
Animal preparation and care
This study was approved by the Institutional Animal Care and Use Committee at our hospital. 15 adult New Zealand white rabbits weighing 2.5–3.0 kg were used. The animals were maintained in a room with a constant temperature (23±2 °C) and a 12-h light/dark cycle, and were given access to a standard diet and water. During all procedures, the animals were anaesthetised with an intramuscular injection of 5 mg kg−1 body weight tiletamine-zolazepam (Zoletil 50; Virbac, Carros, France) and 2 mg kg−1 body weight 2% xylazine hydrochloride (Rompun; Bayer, Seoul, South Korea). Animals were randomly divided into three groups of five each: Group A was treated with RFA alone, Group B was treated with the single-session of combined therapy (TAE immediately followed by RFA on the same day) and Group C was treated with the dual-session combined therapy (TAE followed by RFA 5 days later; Figure 1). All animals were euthanised with an intravenous injection of a lethal amount (7–10 ml) of xylazine hydrochloride 10 days after RFA, and their livers were excised for pathological examination.
Figure 1.

Overview of the experimental design. RFA, radiofrequency ablation; TAE, transcatheter arterial embolisation.
Transcatheter arterial embolisation procedure
An 18-gauge intravenous catheter was inserted into the right auricular artery for arterial access, and a microcatheter (Progreat; Terumo, Tokyo, Japan) was advanced to the descending aorta [14]. When the hepatic artery was identified on a coeliac arteriogram, the catheter tip was advanced to an adequate position in the proper hepatic artery through which absorbable gelatin sponge particles (1–2 mm in diameter; Gelfoam; Upjohn, Kalamazoo, MI) were carefully infused to avoid retrograde reflux until stasis was achieved (Figure 2).
Figure 2.
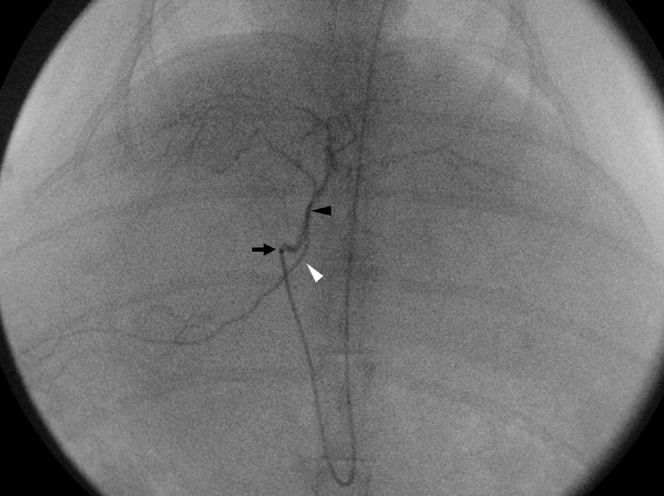
Transcatheter arterial embolisation (TAE) procedure. Hepatic arteriography during TAE shows the left (black arrowhead) and right (white arrowhead) hepatic arteries. The gelatin sponge particles were infused carefully once the tip of the microcatheter (arrow) was located at the proper hepatic artery via the auricular artery, aorta and coeliac trunk.
Radiofrequency ablation procedure
A 17-gauge internally cooled electrode with a 1-cm active tip (Taewoong Medical, Seoul, South Korea) was placed percutaneously in the left hepatic lobe under ultrasonography guidance. Because it is difficult to measure the ablation zone extent exactly if it were not surrounded by the normal liver parenchyma, we performed the preliminary experiment to decide a suitable protocol to avoid full-thickness of the ablation. Ablation was performed for 2 min after checking the position of the electrode tip with ultrasound. A maximum output of 20 W was applied with a monopolar radiofrequency generator (Cool-tip RF System; Radionics Inc, Burlington, MA). We determined if the RFA procedure was suitably performed through monitoring of the generator output, tissue impedance and electrode tip temperature measurements, but these were not recorded.
Radiological study
Perfusion CT (PCT) scans were performed using a multidetector CT scanner (Somatom Definition; Siemens Medical Solutions, Forchheim, Germany) immediately after RFA to obtain liver perfusion indices and to measure the ablated areas. Animals were fixed on a board in the supine position and an abdominal bandage was tightly applied to reduce any movement artefacts. To determine the location of the liver, an unenhanced CT scan was performed from the diaphragmatic domes to the pelvis (detector configuration, 64×0.6 mm; gantry rotation time, 0.5 s; pitch, 0.9; tube current 200 mAs; tube voltage 120 kVp; slice thickness/reconstruction interval, 1.5 mm/1.5 mm; image matrix 512×512). A fixed slice (thickness 114 mm) was selected to include the whole liver based on unenhanced CT images. PCT scan was performed using a cine-mode acquisition technique. The following parameters were used: 24×1.2 mm detector configuration, a rotation time of 0.33 s, a cycle time of 1.5 s, coverage of 114 mm, 80 kVp and 100 mAs. 4 ml of non-ionic contrast material (iopromide; Ultravist 370; Bayer Schering Pharma, Berlin, Germany) was injected with a power injector (Medrad, Pittsburgh, PA) at a rate of 1 ml s−1 through a 22-gauge intravenous catheter inserted into the auricular vein [15,16]. Scanning was initiated 5 s after beginning the injection and continued for 96 s. Therefore, 64 contiguous sections were obtained at 1.5 s intervals. The axial images were reconstructed with a 512×512 image matrix and 1.5 mm slice thickness, with no gap. We obtained 76 images in each of the 64 contiguous sections for a total of 4864 images.
PCT images were transferred to an imaging workstation (Syngo MultiModality Workplace VE36A; Siemens Medical Solutions) to obtain liver perfusion parameters using commercially available software (Syngo Volume Perfusion CT-Body; Siemens Medical Solutions), based on the Patlak analysis [17,18]. Motion correction for in-plane movement was applied to the CT images, and pixels within the range of −50 to 150 HU values were chosen to exclude the bone, air and contrast media densities. Arterial input was measured by placing a circular region of interest (ROI) within the aorta near the coeliac artery. After selecting the portal vein as the input vein and the spleen, colour coding perfusion index maps were generated as hepatic blood flow (HBF; ml 100 ml−1 min−1), hepatic blood volume (HBV; ml 100 ml−1), arterial liver perfusion (ALP; ml 100 ml−1 min−1), portal vein perfusion (PVP; ml 100 ml−1) and hepatic perfusion index (HPI; %). To quantify the indices, we drew two elliptical ROIs on the left lobe parenchyma with the intention of excluding large vessels. The mean values of the two ROIs in each index were considered representative values of PCT indices in the left lobe.
Analysis of the ablation zone on CT images and pathological specimens
One section among the 64 contiguous sections of the PCT scan showing the fully enhanced liver parenchyma and well-visualised portal veins and hepatic veins was selected to evaluate the extent of the RFA zone on CT images. To measure the volume of the perfusion defect, we drew ROIs by outlining the entire low attenuated lesion on the left lobe of every CT scan slice (Figure 3a). The ROI area was calculated automatically, and the volume was measured by multiplying the sum of all ROI areas and the CT image slice thickness (1.5 mm).
Figure 3.

Measurement of the extent of the ablation zone on CT and harvested tissues. (a) Enhanced CT image shows a low attenuated perfusion defect (*) in the left lobe. The region of interest was drawn on every CT image slice by outlining the entire low attenuated lesion to measure the volume of the perfusion defect. (b) Cross-section of the specimen shows the ablation zone (arrows), which is clearly distinguished from the surrounding liver parenchyma.
The livers that were excised 10 days after RFA were sectioned cross-sectionally at 3–5 mm intervals perpendicular to the line of the RFA electrode tract [19]. The ablation zones were lesions that were tan to charcoal grey in color (Figure 3b) [7]. After obtaining a digital image of a section that showed the maximum cross-sectional ablation zone, the long diameter, short diameter and the area of the section were estimated using image analysis software (Image-Pro Plus v. 4.5.0.29; Media Cybernetics, Silver Spring, MD). Infarctions, which were concurrent with RFA around the ablation zone, were also evaluated on histopathological examination [7,20]. Periablation zonal infarction associated with RFA was defined as wedge-shaped reddish or greyish lesion that could be distinguished from the ablation zone (Figure 4).
Figure 4.

A Group B case. (a) Gross examination of the left lobe reveals the wedge-shaped reddish and greyish lesion representing the accompanying infarction (arrowheads) around the ablation zone (arrows). (b) However, enhanced CT images show only a single large low attenuated perfusion defect (arrow) in the left lobe, and do not distinguish the infarct from the ablated area.
Biochemical analysis for liver injury
To evaluate the acute liver damage related to the procedures, serum aspartate aminotransferase (AST) and alanine aminotransferase (ALT) were measured four times: before treatment, 1 day after RFA, 5 days after RFA and 10 days after RFA. Whole blood (2 ml) was taken via the auricular artery or external jugular vein into a serum separator tube, and allowed to clot at room temperature for a minimum of 30 min before centrifugation. Serum was separated after centrifuging for approximately 15 min at 2500 rpm, and transaminase activities were measured using a biochemical autoanalyser (Hitachi Koki, Tokyo, Japan).
Statistical analysis
Statistical analysis was performed using SPSS v. 12.0 (SPSS, Chicago, IL). The non-parametric analysis was conducted using the Kruskal–Wallis test to compare PCT indices, the RFA zone and liver transaminase levels among the three experimental groups. When positive results were encountered, the Mann–Whitney U-test was used for every one-to-one group comparison. A multiple regression analysis was performed to evaluate the correlation between the RFA zone on pathological specimens and PCT indices in all animals regardless of study group. HPI was excluded from this evaluation to avoid multicollinearity. A p-value of <0.05 was considered statistically significant.
Results
Analysis of ablation zone according to treatment strategy
Table 1 shows the results of the extent of the ablation zone in all groups. All parameters representing the extent of the RFA zone (volume on CT images, and the area, long diameter and short diameter on maximum cross-section of specimens) showed values from highest to lowest in the order of Groups B, C and A. All comparisons of the parameters between groups showed significant differences, except for the comparison of the volume on CT between Groups B and C (p=0.076; Table 1). In the tissue examination, accompanying infarctions associated with RFA were observed in one animal in Group A, four in Group B and four in Group C.
Table 1. Extent of the ablated zone in all groups.
| Variable | Mean ± SD | Kruskal–Wallis testa | Mann–Whitney U-testa | ||
| Volume on CT (cm3) | Group A | 1.32±0.38 | 0.008 | A vs B | 0.009 |
| Group B | 4.72±2.61 | A vs C | 0.028 | ||
| Group C | 2.43±1.05 | B vs C | 0.076 | ||
| Cross-sectional area (cm2) | Group A | 2.54±0.27 | 0.005 | A vs B | 0.009 |
| Group B | 4.91±0.38 | A vs C | 0.047 | ||
| Group C | 3.53±0.81 | B vs C | 0.016 | ||
| Long diameter (cm) | Group A | 2.20±0.20 | 0.004 | A vs B | 0.009 |
| Group B | 2.96±0.36 | A vs C | 0.017 | ||
| Group C | 2.46±0.09 | B vs C | 0.020 | ||
| Short diameter (cm) | Group A | 1.68±0.15 | 0.004 | A vs B | 0.008 |
| Group B | 2.20±0.07 | A vs C | 0.049 | ||
| Group C | 1.90±0.14 | B vs C | 0.010 | ||
SD, standard deviation.
Group A: radiofrequency ablation (RFA) alone.
Group B: RFA immediately after transcatheter arterial embolization (TAE).
Group C: RFA 5 days after TAE.
Figures in bold signify p<0.050.
aData are p-values.
Analysis of the perfusion CT indices according to treatment strategy
Table 2 summarises the results of PCT indices in all groups. ALP and HPI were listed from lower to higher values in the order of Groups B, C and A (Figure 5). ALP values in Groups B and C were significantly lower than in Group A (p=0.009 and p=0.28, respectively), but showed no difference between themselves (p=0.117). The HPI of Group B was significantly lower than both Group A (p=0.009) and Group C (p=0.047). HBF, HBV and PVP were not different among the groups.
Table 2. Computed tomography perfusion indices in all groups.
| Variable | Mean ± SD | Kruskal–Wallis testa | Mann–Whitney U-testa | ||
| Hepatic blood flow (ml 100ml−1 min−1) | Group A | 55.95±27.35 | 0.970 | – | |
| Group B | 46.93±9.32 | ||||
| Group C | 47.71±12.60 | ||||
| Hepatic blood volume (ml 100ml−1) | Group A | 36.78±3.54 | 0.482 | – | |
| Group B | 29.90±16.79 | ||||
| Group C | 28.59±13.09 | ||||
| Arterial liver perfusion (ml 100 ml−1 min−1) | Group A | 24.56±11.79 | 0.009 | A vs B | 0.009 |
| Group B | 3.97±2.37 | A vs C | 0.028 | ||
| Group C | 8.74±7.16 | B vs C | 0.117 | ||
| Portal venous perfusion (ml 100 ml−1 min−1) | Group A | 65.71±60.98 | 0.763 | – | |
| Group B | 69.67±32.88 | ||||
| Group C | 67.60±21.32 | ||||
| Hepatic perfusion index (%) | Group A | 38.63±27.16 | 0.006 | A vs B | 0.009 |
| Group B | 5.15±1.88 | A vs C | 0.028 | ||
| Group C | 10.65±6.82 | B vs C | 0.047 | ||
SD, standard deviation.
Group A: Radiofrequency ablation (RFA) alone.
Group B: RFA immediately after transcatheter arterial embolization (TAE).
Group C: RFA 5 days after TAE.
Figures in bold signify p<0.050.
aData are p-values.
Figure 5.

Perfusion computed tomography (PCT) index maps of Groups A and B. (a) The arterial liver perfusion (ALP; left) and portal vein perfusion (PVP; right) maps in Group A. (b) The Group B ALP map (left) is decreased compared with Group A. However, the PVP map (right) was similar to Group A. The elliptical region of interest was drawn on the left lobe to exclude large vessels and quantify the indices.
When we correlated PCT indices with the RFA zone on pathological specimens in all animals regardless of study group, the p-values of the HBF, HBV, ALP and PVP were 0.769, 0.320, 0.007 and 0.527, respectively. A significant inverse correlation was observed between ALP and the cross-sectional area of the ablation zone on pathological specimens (Figure 6).
Figure 6.

Scatter diagram of the correlation between arterial liver perfusion (ALP) and the maximum cross-sectional area on pathological specimens (area).
Biochemical analysis for liver injury according to treatment strategy
The AST of Group B was significantly higher than Group A at 1 day after RFA (p=0.009), but decreased to a level revealing no difference between the groups at 5 days after RFA (Table 3). AST level was not different between Groups B and C throughout the follow-up period. Groups B and C showed higher ALT levels than those of Group A at 1 and 5 days after RFA, but decreased to a level revealing no difference between the groups at 10 days after RFA.
Table 3. Liver function test results in all groups.
| Variable | AST |
ALT |
||||||||
| Mean ± SD | Kruskal–Wallis testa | Mann–Whitney U-testa | Mean ± SD | Kruskal–Wallis testa | Mann–Whitney U-testa | |||||
| Before treatment | Group A | 25.00±14.23 | 0.961 | – | Group A | 48.60±31.20 | 0.645 | – | ||
| Group B | 22.60±7.64 | Group B | 61.40±25.66 | |||||||
| Group C | 22.40±4.83 | Group C | 57.60±21.02 | |||||||
| 1 day after RFA | Group A | 277.60±110.59 | 0.044 | A vs B | 0.009 | Group A | 271.20±98.75 | 0.005 | A vs B | 0.009 |
| Group B | 748.80±280.41 | A vs C | 0.175 | Group B | 1127.60±317.52 | A vs C | 0.009 | |||
| Group C | 653.80±481.70 | B vs C | 0.465 | Group C | 806.80±297.86 | B vs C | 0.117 | |||
| 5 days after RFA | Group A | 32.00±15.25 | 0.089 | – | Group A | 86.00±29.68 | 0.012 | A vs B | 0.021 | |
| Group B | 227.75±176.92 | Group B | 596.00±294.48 | A vs C | 0.014 | |||||
| Group C | 132.80±99.71 | Group C | 289.20±153.11 | B vs C | 0.142 | |||||
| 10 days after RFA | Group A | 20.00±7.26 | 0.597 | – | Group A | 44.25±17.19 | 0.066 | – | ||
| Group B | 111.67±130.78 | Group B | 376.33±351.45 | |||||||
| Group C | 65.00±57.76 | Group C | 131.60±120.19 | |||||||
ALT, alanine aminotransferase; AST, aspartate aminotransferase; RFA, radiofrequency ablation; SD, standard deviation.
Group A: RFA alone.
aData are p-values.
Figures in bold signify p<0.050.
Discussion
Our study demonstrated that a combination therapy with RFA and TAE induced a larger ablation zone than RFA alone, which could support the concept of combined TAE and RFA. Several studies have reported that combination therapy is superior to RFA alone, particularly for large HCCs [9,12]. TAE followed by RFA may create a large ablation zone for treating HCC by decreasing hepatic blood flow, which could lead to a complete local treatment, lower local recurrence and increased patient survival. In our study, the decrease in arterial liver perfusion caused by TAE preceding RFA was significantly correlated with the maximum cross-sectional area of the ablation zone on pathological specimens, and ALP showed the best correlation (p=0.007).
Group B (the single-session combined therapy) showed a larger ablation zone compared with Group C (the dual-session combined therapy), which was supported by all the pathological variables (long diameter, short diameter and the area of the maximum cross-section images) studied. The decrease in arterial liver perfusion caused by TAE was maximised just after TAE when the ablation zone could be enlarged most. Therefore, we believe that a larger ablation zone can be achieved following the single-session combined therapy compared with that following the dual-session combined therapy. The gelatin sponge is a temporary embolising agent, which is widely used to embolise the feeding artery during TAE [21-26]. RFA should be performed immediately after TAE for HCC to produce as large an ablation zone as possible. PCT indices affected by hepatic arterial flow, such as ALP, HBF and HPI, could increase over time after TAE, as their arterial embolic effect is reduced over time after TAE. In our study, HBF revealed a weak statistical correlation, probably due to the effect being obscured by portal venous flow.
Group B showed the highest AST, indicating increased acute liver damage compared with the other groups. However, as time passed, the enzymes rapidly recovered to levels that revealed no significant differences among the three groups within 10 days after RFA. Kang et al [13] reported that a single-session combined therapy was tolerated and feasible in all patients without significant immediate complications. RFA performed immediately after TAE may lead to more severe liver damage during the early post-treatment period, but liver injury is expected to recover with no serious complications when patients are appropriately selected for combined therapy.
Groups B and C showed a weak statistical difference (p=0.076) for CT perfusion defect volume reflecting the ablation zone, despite the fact that the Group B RFA zone was significantly larger than that of Group C on the tissue examination. Several animals had an accompanying infarction around the ablation zone after combined therapy (Figure 4). Therefore, decreased arterial perfusion by the preceding TAE may have a tendency to lead to a periablation zonal infarction after the RFA procedure unlike with RFA alone. Concurrent infarction also appeared as a low attenuated perfusion defect on enhanced CT images, which looks identical to the ablation zone [20]. Therefore, an infarction may not be distinguished from the ablation zone on CT images if the two lesions are closely related. However, we could easily distinguish them on a direct examination of tissues by colour and shape.
Our study had several limitations. First, PCT cannot be applied directly to clinical practice because of the potential radiation hazard. However, we demonstrated decreased perfusion after TAE in a rabbit model using this method. Perfusion magnetic resonance is an alternative method to obtaining perfusion parameters in clinical practice. Second, the results of the present study were obtained in normal hepatic parenchyma of rabbits, so a further investigation in a tumour model, which may have different hepatic haemodynamics, is needed. Third, we were able to control only the maximum generator output and the ablation time, but we were unable to obtain graphs or automatically recorded values regarding the changes in the generator output, tissue impedance and temperature of the tip during the RFA procedure. Therefore, the actual amounts of energy to a given tissue may have been different among the groups. Last, chemoembolisation using lipiodol (rather than embolisation using only gelfoam particles) was performed during combined therapy. However, we were unable to apply chemoembolisation to the rabbit model, as PCT indices could not be calculated by the workstation owing to a high attenuation of the whole hepatic parenchyma related to the lipiodol uptake on pre-contrast images. An increase in mortality was observed after a non-selective chemoembolisation at the proper hepatic artery in our pilot study. If chemoembolisation was applied to combined therapy instead of TAE, the liver function may have been aggravated by chemotherapeutic agents compared with our results.
In conclusion, when combined TAE and RFA therapy produces a larger ablation zone, TAE should be followed by RFA as quickly as possible, which can be performed safely without serious hepatic deterioration, despite the short interval between the two procedures. Several PCT indices indicating arterial perfusion were inversely correlated with the ablation zone.
Footnotes
This study was supported by a Bayer-Schering Radiological Research Fund of the Korean Society of Radiology for 2011.
References
- 1.Bosch FX, Ribes J, Borras J. Epidemiology of primary liver cancer. Semin Liver Dis 1999;19:271–85 [DOI] [PubMed] [Google Scholar]
- 2.Bruix J. Treatment of hepatocellular carcinoma. Hepatology 1997;25:259–62 [DOI] [PubMed] [Google Scholar]
- 3.Morimoto M, Sugimori K, Shirato K, Kokawa A, Tomita N, Saito T, et al. Treatment of hepatocellular carcinoma with radiofrequency ablation: radiologic–histologic correlation during follow-up periods. Hepatology 2002;35:1467–75 [DOI] [PubMed] [Google Scholar]
- 4.Lencioni R, Cioni D, Crocetti L, Franchini C, Pina CD, Lera J, et al. Early-stage hepatocellular carcinoma in patients with cirrhosis: long-term results of percutaneous image-guided radiofrequency ablation. Radiology 2005;234:961–7 [DOI] [PubMed] [Google Scholar]
- 5.Rossi S, Garbagnati F, Lencioni R, Allgaier HP, Marchiano A, Fornari F, et al. Percutaneous radio-frequency thermal ablation of nonresectable hepatocellular carcinoma after occlusion of tumor blood supply. Radiology 2000;217:119–26 [DOI] [PubMed] [Google Scholar]
- 6.Veltri A, Moretto P, Doriguzzi A, Pagano E, Carrara G, Gandini G. Radiofrequency thermal ablation (RFA) after transarterial chemoembolization (TACE) as a combined therapy for unresectable non-early hepatocellular carcinoma (HCC). Eur Radiol 2006;16:661–9 [DOI] [PubMed] [Google Scholar]
- 7.Morimoto M, Numata K, Nozawa A, Kondo M, Nozaki A, Nakano M, et al. Radiofrequency ablation of the liver: extended effect of transcatheter arterial embolization with iodized oil and gelatin sponge on histopathologic changes during follow-up in a pig model. J Vasc Interv Radiol 2010;21:1716–24 [DOI] [PubMed] [Google Scholar]
- 8.Gadaleta C, Catino A, Ranieri G, Fazio V, Gadaleta-Caldarola G, Cramarossa A, et al. Single-step therapy—feasibility and safety of simultaneous transarterial chemoembolization and radiofrequency ablation for hepatic malignancies. In Vivo 2009;23:813–20 [PubMed] [Google Scholar]
- 9.Yang W, Chen MH, Wang MQ, Cui M, Gao W, Wu W, et al. Combination therapy of radiofrequency ablation and transarterial chemoembolization in recurrent hepatocellular carcinoma after hepatectomy compared with single treatment. Hepatol Res 2009;39:231–40 [DOI] [PubMed] [Google Scholar]
- 10.Kirikoshi H, Saito S, Yoneda M, Fujita K, Mawatari H, Uchiyama T, et al. Outcome of transarterial chemoembolization monotherapy, and in combination with percutaneous ethanol injection, or radiofrequency ablation therapy for hepatocellular carcinoma. Hepatol Res 2009;39:553–62 [DOI] [PubMed] [Google Scholar]
- 11.Cheng BQ, Jia CQ, Liu CT, Fan W, Wang QL, Zhang ZL, et al. Chemoembolization combined with radiofrequency ablation for patients with hepatocellular carcinoma larger than 3 cm: a randomized controlled trial. JAMA 2008;299:1669–77 [DOI] [PubMed] [Google Scholar]
- 12.Takaki H, Yamakado K, Uraki J, Nakatsuka A, Fuke H, Yamamoto N, et al. Radiofrequency ablation combined with chemoembolization for the treatment of hepatocellular carcinomas larger than 5 cm. J Vasc Interv Radiol 2009;20:217–24 [DOI] [PubMed] [Google Scholar]
- 13.Kang SG, Yoon CJ, Jeong SH, Kim JW, Lee SH, Lee KH, et al. Single-session combined therapy with chemoembolization and radiofrequency ablation in hepatocellular carcinoma less than or equal to 5 cm: a preliminary study. J Vasc Interv Radiol 2009;20:1570–7 [DOI] [PubMed] [Google Scholar]
- 14.Chang IS, Lee MW, Kim YI, Choi SH, Kim HC, Choi YW, et al. Comparison between transauricular and transfemoral arterial access for hepatic artery angiography in a rabbit model. J Vasc Interv Radiol 2011;22:1181–7 [DOI] [PubMed] [Google Scholar]
- 15.Choi SH, Chung JW, Kim HC, Baek JH, Park CM, Jun S, et al. The role of perfusion CT as a follow-up modality after transcatheter arterial chemoembolization: an experimental study in a rabbit model. Invest Radiol 2010;45:427–36 [DOI] [PubMed] [Google Scholar]
- 16.Kim KW, Lee JM, Kim JH, Klotz E, Kim HC, Han JK, et al. CT color mapping of the arterial enhancement fraction of VX2 carcinoma implanted in rabbit liver: comparison with perfusion CT. AJR Am J Roentgenol 2011;196:102–8 [DOI] [PubMed] [Google Scholar]
- 17.Park MS, Klotz E, Kim MJ, Song SY, Park SW, Cha SW, et al. Perfusion CT: noninvasive surrogate marker for stratification of pancreatic cancer response to concurrent chemo- and radiation therapy. Radiology 2009;250:110–17 [DOI] [PubMed] [Google Scholar]
- 18.Patlak CS, Blasberg RG, Fenstermacher JD. Graphical evaluation of blood-to-brain transfer constants from multiple-time uptake data. J Cereb Blood Flow Metab 1983;3:1–7 [DOI] [PubMed] [Google Scholar]
- 19.Mostafa EM, Ganguli S, Faintuch S, Mertyna P, Goldberg SN. Optimal strategies for combining transcatheter arterial chemoembolization and radiofrequency ablation in rabbit VX2 hepatic tumors. J Vasc Interv Radiol 2008;19:1740–8 [DOI] [PubMed] [Google Scholar]
- 20.Kim SK, Gu MS, Hong HP, Choi D, Chae SW. CT findings after radiofrequency ablation in rabbit livers: comparison of internally cooled electrodes, perfusion electrodes, and internally cooled perfusion electrodes. J Vasc Interv Radiol 2007;18:1417–27 [DOI] [PubMed] [Google Scholar]
- 21.Takayasu K, Shima Y, Muramatsu Y, Moriyama N, Yamada T, Makuuchi M, et al. Hepatocellular carcinoma: treatment with intraarterial iodized oil with and without chemotherapeutic agents. Radiology 1987;163:345–51 [DOI] [PubMed] [Google Scholar]
- 22.Uchida H, Matsuo N, Sakaguchi H, Nagano N, Nishimine K, Ohishi H. Segmental embolotherapy for hepatic cancer: keys to success. Cardiovasc Intervent Radiol 1993;16:67–71 [DOI] [PubMed] [Google Scholar]
- 23.Caturelli E, Siena DA, Fusilli S, Villani MR, Schiavone G, Nardella M, et al. Transcatheter arterial chemoembolization for hepatocellular carcinoma in patients with cirrhosis: evaluation of damage to nontumorous liver tissue-long-term prospective study. Radiology 2000;215:123–8 [DOI] [PubMed] [Google Scholar]
- 24.Lee IJ, Chung JW, Kim HC, Yin YH, So YH, Jeon UB, et al. Extrahepatic collateral artery supply to the tumor thrombi of hepatocellular carcinoma invading inferior vena cava: the prevalence and determinant factors. J Vasc Interv Radiol 2009;20:22–9 [DOI] [PubMed] [Google Scholar]
- 25.Matsui O, Miyayama S, Sanada J, Kobayashi S, Khoda W, Minami T, et al. Interventional oncology: new options for interstitial treatments and intravascular approaches: superselective TACE using iodized oil for HCC: rationale, technique and outcome. J Hepatobiliary Pancreat Sci 2010;17:407–9 [DOI] [PubMed] [Google Scholar]
- 26.Takayasu K, Arii S, Ikai I, Kudo M, Matsuyama Y, Kojiro M, et al. Overall survival after transarterial lipiodol infusion chemotherapy with or without embolization for unresectable hepatocellular carcinoma: propensity score analysis. AJR Am J Roentgenol 2010;194:830–7 [DOI] [PubMed] [Google Scholar]