

Abstract
Central hypoventilation syndrome (CHS) is a rare condition characterized by hypoventilation during sleep, reduced ventilatory responsiveness to CO2 and O2, impaired perception of air hunger, and autonomic abnormalities. Neural impairments accompany the condition, including structural injury, impaired cerebral autoregulation, and dysfunctional autonomic control. The hypoventilation may induce cortical hypoxic injury, additional to consequences of maldevelopment from PHOX2B mutations present in most CHS subjects. We assessed cortical injury in clinically diagnosed CHS using high-resolution magnetic resonance imaging scans, collected from 14 CHS (mean age ± standard deviation [SD] 17.7 ± 5.0 years; 6 female) and 29 control (mean age ± SD, 17.9 ± 4.3 years; 12 female) subjects. We measured group differences in mean cortical thickness and age–thickness correlations using FreeSurfer software, accounting for age and sex (0.1 false discovery rate). Reduced thickness in CHS appeared in the dorsomedial frontal cortex and anterior cingulate; medial prefrontal, parietal, and posterior cingulate cortices; the insular cortex; anterior and lateral temporal lobes; and mid- and accessory motor strips. Normal age-related cortical thinning in multiple regions did not appear in CHS. The cortical thinning may contribute to CHS cardiovascular and memory deficits and may impair affect and perception of breathlessness. Extensive axonal injury in CHS is paralleled by reduced cortical tissue and absence of normal developmental patterns.
Keywords: apnea, chemosensitivity, gray matter, pediatric, PHOX2B
Introduction
Central hypoventilation syndrome (CHS) is a disorder characterized by an inadequate drive to breathe during sleep and reduced or absent ventilatory responsiveness to CO2 and O2 (American Thoracic Society 1999). The condition is accompanied by multiple symptoms that suggest central nervous system disruption beyond respiratory control, including autonomic dysregulation, motor disturbances, and cognitive and emotional impairments (Woo et al. 1992; Weese-Mayer et al. 2001; Kim et al. 2002; Macey, Valderama, et al. 2004; Vanderlaan et al. 2004; Ruof et al. 2008; Zelko et al. 2010). Numerous structural and functional brain irregularities appear in CHS patients, including axonal loss (Kumar et al. 2008, 2010); diminished subcortical structural volumes (Kumar, Ahdout, et al. 2009; Kumar, Lee, et al. 2009; Macey et al. 2009); and indications of impaired water diffusion; as well as cerebral autoregulation deficits (Macey et al. 2003; Kumar, Nguyen, et al. 2009; Macey et al. 2010); and altered responses to autonomic, CO2, and O2 challenges (Macey KE, Macey PM, et al. 2004; Harper et al. 2005; Macey PM, Macey KE, et al. 2005; Macey, Woo, et al. 2005; Woo et al. 2005). The hypoventilation during sleep (and in severe forms of the condition, during waking) has the potential to elicit cortical and subcortical hypoxic injury in addition to any maldevelopment of structure induced by mutations of PHOX2B, which are believed to underlie the condition (Amiel et al. 2003; Weese-Mayer et al. 2010). The limited data from cortical structures suggest local injury, but those data are lacking in detail. Regionally impaired corpus callosum fibers suggest that damaged cortical regions may contribute to several functional deficits in the syndrome (Kumar et al. 2011).
We tested the hypothesis here that cortical integrity is compromised in CHS, reflected in thinning of the cortex as assessed with cortical morphometry based on high-resolution T1-weighted images. We also aimed to assess group differences in age-related changes in cortical thickness as many cortical areas normally show thinning during adolescence (Sowell et al. 2001; Shaw et al. 2006).
Materials and Methods
Subjects
Fourteen CHS and 29 control subjects were studied (Table 1). At the time of recruitment, the CHS subjects were diagnosed with congenital central hypoventilation syndrome (CCHS) according to the 1999 American Thoracic Society criteria, which are based primarily on clinical symptoms (American Thoracic Society 1999). Symptoms included lack of CO2 sensitivity, minimal O2 sensitivity, hypoventilation during sleep, diminished perception of dyspnea (breathlessness), and no evidence of clinical abnormalities that could explain the symptoms (e.g., brain stem lesions). A recent revision of diagnostic criteria for CCHS includes a genetic mutation on the PHOX2B gene (Weese-Mayer et al. 2010). While this criterion was not in effect at the time of recruitment, we obtained genetic information on 5 CHS subjects, showing that 2 were negative and 3 were positive for PHOX2B mutations (expansions 20/25, 20/25, and 20/27). All CHS subjects developed symptoms very early in life. After the initial data collection, we contacted 12 of the 14 patients to clarify their clinical characteristics. We excluded any subject with other potentially confounding issues, including Hirschsprung’s disease, and cardiovascular or neurological disorders. CHS patients were recruited through the CCHS Family Network (http://www.cchsnetwork.org/), and control subjects were recruited via fliers on the university campus. The study procedures were approved by the University of California at Los Angeles Institutional Review Board. All subjects, and if appropriate their parents, gave written informed consent/assent prior to the study.
Table 1.
Clinical characteristics of CHS patients, with no answer (n/a) obtained for 2 subjects, and with no testing for PHOX2B mutations performed in six of the other subjects
| PHOX2B | Age diagnosed | Age on ventilator | Early life symptoms | |
| 1 | 20/27 | 6–8 weeks | Birth | Premature (32 weeks); Apgar 4; severe respiratory problems at birth |
| 2 | Negative | 3 weeks | 4 ½ months | Severe respiratory problems after birth, acute respiratory failure at 3 week |
| 3 | 20/25 | <5 days of birth | Birth | Severe respiratory problems at birth |
| 4 | 2 weeks | 2 weeks | Severe respiratory problems at birth | |
| 5 | Negative | 8 ½ years | 9 years | Considered “late onset”; severe problems with respiration and autonomic control (especially extreme sweating) at a few weeks old |
| 6 | n/a | 7 months | 7 months | Respiratory arrest at 7 months |
| 7 | 20/25 | 17 months | 18 months | Considered “late onset”; infection-triggered respiratory failure leading to intensive care at 14 months |
| 8 | n/a | 5 months | 6–7 months | Severe respiratory problems at birth; went blue within an hour of being born, continual intensive care until diagnosis |
| 9 | n/a | 3 months | Birth | Premature (32 weeks); severe respiratory problems at birth |
| 10 | n/a | 3 months | Birth | Premature (32 weeks); severe respiratory problems at birth |
| 11 | n/a | 3 months | Birth | Severe respiratory problems at 3 months |
| 12 | n/a | 1 year | 3 months | Severe respiratory problems at 3 months |
| 13, 14 | n/a | n/a | n/a | n/a |
Note: Genetic test results were available for 5 subjects.
Magnetic Resonance Imaging
Anatomical brain scans were collected from all subjects with a 3.0T magnetic resonance imaging scanner using an 8-channel head coil (Siemens Trio, Erlangen, Germany). Two high-resolution T1-weighted image volumes were acquired with the magnetization-prepared rapid-acquisition gradient-echo pulse sequence (repetition time [TR] = 2200 ms; echo time [TE] = 2.34 ms; inversion time = 900 ms; flip angle [FA] = 9°; matrix size = 320 × 320; field of view [FOV] = 230 × 230 mm; slice thickness = 0.9 mm; slices = 192). Both scans were visually checked to ensure the absence of motion artifact, and if motion was noted, the scan was repeated. Additionally, proton-density and T2-weighted anatomical scans covering the entire brain were collected, using a dual-echo turbo spin-echo pulse sequence (TR = 10,000 ms; TE1 = 12 ms; TE2 = 119 ms; FA = 130°; matrix size = 256 × 256; FOV = 230 × 230 mm; slice thickness = 3.5 mm; turbo factor = 5), to verify the absence of clinical brain pathology.
Analysis
We used FreeSurfer and MATLAB-based SPM5 software for data processing and analysis. SPM5 was used to process the T1-weighted scans, including coregistration and averaging the 2 scans from each subject, and removal of signal intensity variations due to field inhomogeneities (Ashburner and Friston 2005). The processed images were imported into FreeSurfer to assess cortical thickness (Dale et al. 1999). The initial skull stripping and boundary identification were performed, and skull strips of all subjects were manually checked to ensure no brain area was excluded. Similarly, the pial and gray–white matter boundaries were visually checked and, if needed, edits made to correct misidentified regions. Minor edits were required to the automatically detected pial boundaries in most subjects, but the skull strip and white matter boundaries did not require adjustment.
The FreeSurfer processing stream was followed to generate cortical thickness across the brain, except for cerebellar areas. Surface statistics were implemented to assess cortical thinning in CHS over control subjects, using a general linear model with group and sex as classification variables and age as a continuous covariate (10 mm smoothing). Since corrections for multiple comparisons are typically conservative, and we had relatively small subject numbers (CHS is a very rare disorder), we set the threshold to 0.1 false discovery rate (FDR; equivalent to uncorrected P = 0.001). We overlaid the areas of significant difference onto the inflated cortical surface (sulcal and gyral areas displayed as smooth adjacent regions without depth). We also illustrated effect sizes over regions showing an effect greater than a low statistical threshold (P = 0.05).
Covariates included age and sex. Total intracranial volume (TIV) is related to head size and is often considered a covariate in analyses. However, we analyzed TIV separately to minimize the number of covariates. For each subject, TIV was calculated as the combined volume of gray matter, white matter, and cerebrospinal fluid regions, as determined by SPM5 segmentation software (Ashburner and Friston 2005). We assessed group differences using an independent samples t-test.
Age–thickness correlations were assessed using a FreeSurfer linear model, accounting for sex. We applied the same threshold as used for the main analysis. Thickness values were extracted from each surface area of group difference in age–thickness correlation and plotted against age. Regression analysis (in MATLAB software) was used to derive the slope of the age–thickness trend, and a simple correlation test was used to establish whether the relationship was significant (P < 0.05).
Findings were reported visually and by “cluster,” that is, regions of adjoining voxels showing significant differences. The FreeSurfer annotations were provided in descriptions for consistency with the atlas provided in that software, although the terms do not always follow anatomical labeling conventions. Brodmann areas (BAs) were also noted.
Results
At recruitment, all patients or patients’ parents reported that symptoms were present during infancy. A follow-up questionnaire was completed by 12 of the 14 patients, which verified that all subjects showed early symptoms of varying severity but that the clinical diagnosis of CHS was not always immediately made (Table 1). There were no significant differences between the CHS and control groups in age, sex distribution, or body mass index (Table 2). Overall mean cortical thickness and total gray matter volumes of left and right hemispheres were also statistically similar between groups (Table 2).
Table 2.
Subject characteristics; age, BMI, and sex were not significantly different between groups (at threshold P = 0.05; chi-square for sex and independent t-tests for continuous variables)
| CHS (N = 14) | Control (N = 37) | Group difference P | |||
| Mean ± SD | Range | Mean ± SD | Range | ||
| Age (years) | 17.7 ± 5.0 | 7–23 | 17.9 ± 4.7 | 7–24 | 0.91 |
| BMI | 22.4 ± 6.1 | 11.8–35.8 | 22.2 ± 4.6 | 13.0–36.4 | 0.91 |
| Sex | 6♀, 8♂ | 12♀, 17♂ | 0.72 | ||
| Gray matter volume (cm3) | |||||
| Left | 275 ± 34 | 229–333 | 269 ± 29 | 229–331 | 0.50 |
| Right | 277 ± 33 | 230–330 | 269 ± 29 | 223–330 | 0.42 |
| Thickness (mm) | |||||
| Left | 2.64 ± 0.12 | 2.49–2.84 | 2.68 ± 0.13 | 2.42–2.95 | 0.39 |
| Right | 2.65 ± 0.12 | 2.48–2.86 | 2.68 ± 0.14 | .37–2.97 | 0.52 |
Note: Left and right hemisphere gray matter volume and average cortical thickness did not significantly differ between groups. BMI, body mass index; SD, standard deviation
Multiple regions showed reduced cortical thickness in CHS over control subjects (Fig. 1 and Table 3), adjusting for age and sex. Frontal cortical areas of thinning appeared in superior frontal sites, with the left side showing thinning in more anterior regions and greater tissue loss than the right side. A bilateral area of thinning appeared in the superior midfrontal cortex (BA 8, 32, 34) in CHS, and small areas in the precentral region showed changes (BA 9, 47). Small areas of thinning appeared in the superior parietal cortex on both sides (BA 7, 40). Similarly, a bilateral region in the midtemporal cortex differed in CHS from controls (BA 21). The left mid-to-anterior insular cortex and regions of the cingulate showed thinning, with the posterior cingulate showing changes in the left side. The left medial prefrontal cortex showed thinning adjacent to the anterior cingulate (BA 32). The precuneus showed bilateral changes. The effect sizes of the difference in cortical thickness, accounting for age and sex, were toward thinning in CHS in most, although not all, areas (Fig. 2).
Figure 1.
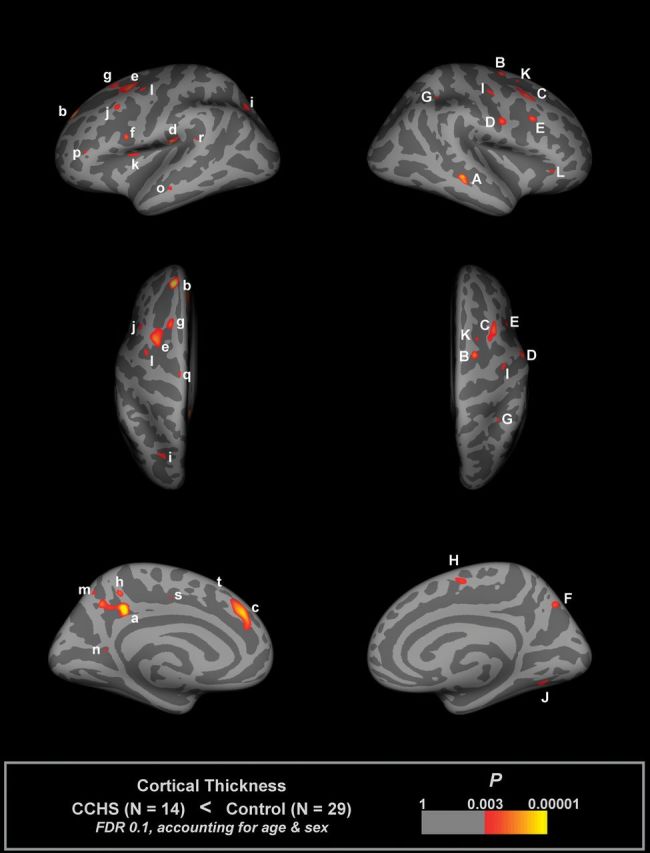
Regions of significantly reduced cortical thickness in CHS relative to control subjects, accounting for age and sex (FDR 0.1), overlaid onto inflated pial surface (light gray gyral, dark gray sulcal). Areas labels are detailed in Table 3.
Table 3.
Surface areas of significantly reduced cortical thickness in CHS (illustrated in Fig. 1)
| Max t statistic | X, mm | Y, mm | Z, mm | Size, mm2 | Structures in area, FreeSurfer annotation and BAs | Thickness (mm), mean ± SD | ||
| CHS | Control | |||||||
| Left hemisphere | ||||||||
| a | 5.58 | −12.2 | −37.8 | 34.6 | 336 | Precuneus, BA 48 | 2.54 ± 0.25 | 2.65 ± 0.23 |
| b | 5.02 | −16.7 | 46.2 | 31.7 | 202 | Superiorfrontal, BA 9 | 2.81 ± 0.30 | 3.02 ± 0.31 |
| c | 4.56 | −8.2 | 36.6 | 29.7 | 375 | Superiorfrontal, BA 32 | 3.27 ± 0.35 | 3.39 ± 0.27 |
| d | 4.25 | −43.3 | −20.5 | 19.8 | 114 | Supramarginal, BA 48 | 2.93 ± 0.35 | 3.01 ± 0.36 |
| e | 3.97 | −28.1 | 5.6 | 47 | 283 | Caudal (inferior) middlefrontal, BA 6 | 2.82 ± 0.24 | 2.90 ± 0.22 |
| f | 3.67 | −43.8 | 5.8 | 15.8 | 37 | Parsopercularis, BA 48 | 2.61 ± 0.30 | 2.71 ± 0.26 |
| g | 3.56 | −21.4 | 18.9 | 48.2 | 125 | Superiorfrontal, BA 8 | 2.99 ± 0.27 | 2.95 ± 0.21 |
| h | 3.53 | −7.5 | −41.9 | 44.7 | 46 | Precuneus | 2.59 ± 0.34 | 2.99 ± 0.29 |
| i | 3.40 | −21.5 | −59.6 | 33.2 | 89 | Superiorparietal, BA 7 | 2.22 ± 0.14 | 2.32 ± 0.18 |
| j | 3.20 | −41.5 | 16.9 | 35.8 | 74 | Caudal (inferior) middlefrontal, BA 44 | 3.04 ± 0.37 | 3.14 ± 0.30 |
| k | 3.10 | −33.8 | 3.7 | 12.9 | 54 | Insula, BA 48 | 2.60 ± 0.25 | 2.67 ± 0.30 |
| l | 3.02 | −35.2 | −2.4 | 39.4 | 65 | Precentral, BA 6 | 2.28 ± 0.29 | 2.55 ± 0.27 |
| m | 2.96 | −8.1 | −59.2 | 47.2 | 27 | Precuneus | 2.33 ± 0.46 | 2.58 ± 0.50 |
| n | 2.95 | −14.4 | −52.4 | 10.7 | 18 | Isthmuscingulate, BA 30 | 3.47 ± 0.38 | 3.55 ± 0.46 |
| o | 2.93 | −57.3 | −19.2 | −12.5 | 38 | Middletemporal, BA 21 | 3.18 ± 0.54 | 3.25 ± 0.40 |
| p | 2.93 | −39.5 | 33.7 | 5.2 | 25 | Parstriangularis, BA 45 | 2.21 ± 0.30 | 2.21 ± 0.40 |
| q | 2.88 | −11.8 | −13.6 | 64.3 | 27 | Precentral, BA 6 | 2.77 ± 0.55 | 2.87 ± 0.47 |
| r | 2.85 | −49.2 | −40.2 | 18.3 | 26 | Superiortemporal, BA 41 | 2.69 ± 0.35 | 2.77 ± 0.36 |
| s | 2.75 | −12.6 | −9.7 | 38 | 19 | Posteriorcingulate, BA 23 | 2.70 ± 0.25 | 2.67 ± 0.33 |
| t | 2.71 | −6.5 | 21.9 | 53.4 | 17 | Superiorfrontal, BA 8 | 3.60 ± 0.36 | 3.67 ± 0.42 |
| Right hemisphere | ||||||||
| A | 4.23 | 49.8 | −30.4 | −6.7 | 114 | Middletemporal, BA 21 | 3.07 ± 0.35 | 3.06 ± 0.37 |
| B | 3.80 | 20.6 | −1.9 | 54 | 68 | Superiorfrontal, BA 34 | 2.78 ± 0.43 | 2.81 ± 0.29 |
| C | 3.73 | 37.2 | 14.5 | 48.4 | 266 | Caudal (inferior) middlefrontal, BA 9 | 3.16 ± 0.18 | 3.27 ± 0.22 |
| D | 3.58 | 54.4 | −0.7 | 24 | 114 | Precentral, BA 6 | 2.97 ± 0.26 | 3.00 ± 0.26 |
| E | 3.54 | 32.8 | 14.8 | 26.9 | 50 | Caudal (inferior) middlefrontal, BA 48 | 2.33 ± 0.27 | 2.55 ± 0.31 |
| F | 3.44 | 12.2 | −65.9 | 40.2 | 89 | Precuneus, BA 7 | 2.19 ± 0.29 | 2.36 ± 0.28 |
| G | 3.20 | 32 | −41.9 | 37.8 | 30 | Superiorparietal, BA 40 | 2.31 ± 0.17 | 2.49 ± 0.30 |
| H | 3.18 | 6.9 | −4.2 | 51.9 | 81 | Superiorfrontal, BA 6 | 3.11 ± 0.53 | 3.05 ± 0.39 |
| I | 3.14 | 37.5 | −8.7 | 43.4 | 71 | Precentral, BA 6 | 2.59 ± 0.34 | 2.55 ± 0.23 |
| J | 3.07 | 29.5 | −62.9 | −1.6 | 99 | Fusiform, BA 19 | 2.33 ± 0.21 | 2.51 ± 0.29 |
| K | 3.00 | 20.9 | 8 | 47.9 | 19 | Superiorfrontal, BA 8 | 2.36 ± 0.24 | 2.55 ± 0.40 |
| L | 2.98 | 41.9 | 29.7 | −6.5 | 37 | Parstriangularis, BA 47 | 2.87 ± 0.58 | 3.09 ± 0.47 |
Note: Each area consists of adjacent voxels showing a significant effect; some brain structures have more than one area of change. The magnitude of the peak (t statistic) in each area and its Tailarach coordinates (a standardized common brain space) are listed, together with the size (in normalized space) and the mean and SD thicknesses for CHS and control groups. The FreeSurfer annotation (i.e., label of region most representative of the area) is also included. Note that areas of significant thinning are based on group differences accounting for age and sex, not just mean thickness. SD, standard deviation.
Figure 2.
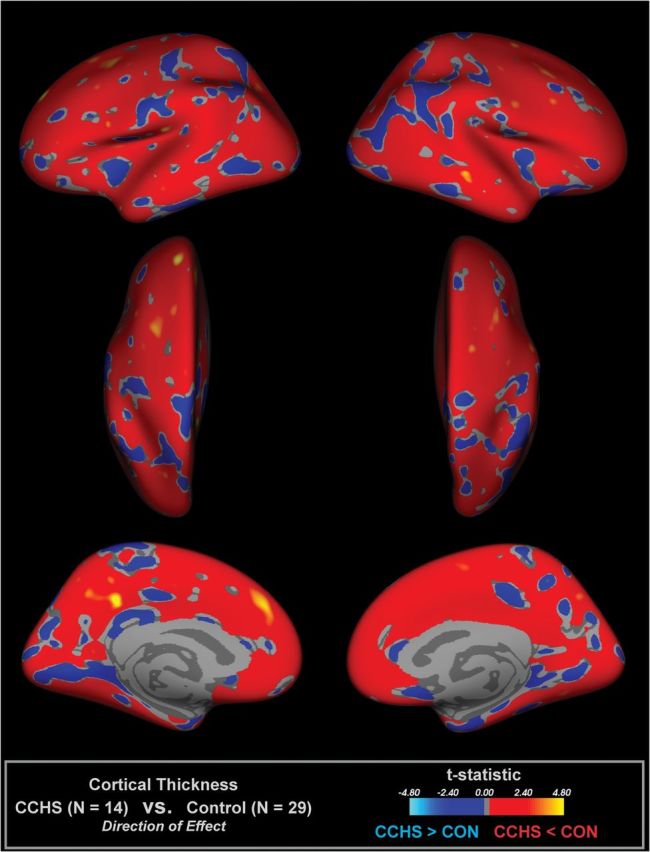
Illustration of effect sizes of CHS and control differences in cortical thickness, accounting for age and sex, for areas showing P < 0.5. Red–yellow scale indicates thinner cortex and blue, thicker.
TIV did not significantly differ between groups (CHS = 1.69 ± 0.22; control = 1.59 ± 0.15), and no regions showed differences in the correlation between cortical thickness and TIV between groups (FDR = 0.1).
Multiple regions showed a pattern of decreasing cortical thickness with age in control but not in CHS subjects (Table 4 and Fig. 3). Regions were scattered across mainly frontal and parietal areas. Only one region (V, right precuneus) showed a pattern of lower age–thickness correlation in CHS versus control.
Table 4.
Surface areas of significantly different age–thickness correlations in CHS versus controls (illustrated in Fig. 3)
| Area | Max t statistic | X, mm | Y, mm | Z, mm | Size, mm2 | Structures in area, FreeSurfer annotation and BAs | Slope (thickness in mm vs. age in years) | |
| CHS | Control | |||||||
| Left hemisphere | ||||||||
| i | −5.22 | −9.9 | −36.6 | 32.3 | 131 | Isthmuscingulate, BA 23 | −0.007 | −0.038 |
| ii | −4.26 | −17.2 | 45.5 | 31 | 107 | Superiorfrontal, BA 9 | 0.022 | −0.043 |
| iii | −4.08 | −8 | 37 | 29 | 233 | Superiorfrontal, BA 32 | 0.017 | −0.043 |
| iv | −3.86 | −43.3 | −20.5 | 19.8 | 63 | Supramarginal, BA 48 | 0.012 | −0.049 |
| v | −3.64 | −28.5 | 5.3 | 47 | 116 | Caudal (inferior) middlefrontal, BA 6 | 0.020 | −0.030 |
| vi | −3.47 | −21.4 | 18.9 | 48.2 | 65 | Superiorfrontal, BA 8 | 0.013 | −0.026 |
| vii | −3.29 | −43.8 | 5.8 | 15.8 | 14 | Parsopercularis, BA 48 | 0.011 | −0.027 |
| viii | −3.15 | −21.1 | −59.8 | 34.1 | 21 | Superiorparietal, BA 7 | −0.003 | −0.029 |
| ix | −3.05 | −7.5 | −54.2 | 37.6 | 18 | Precuneus | −0.016 | −0.046 |
| x | −2.95 | −41.5 | 16.9 | 35.8 | 14 | Caudal (inferior) middlefrontal, BA 44 | 0.019 | −0.029 |
| xi | −2.94 | −39.5 | 33.7 | 5.2 | 6 | Parstriangularis, BA 45 | 0.002 | −0.032 |
| Right hemisphere | ||||||||
| I | −4.35 | 49.8 | −30.4 | −6.7 | 106 | Middletemporal, BA 21 | 0.002 | −0.052 |
| II | −3.73 | 20.5 | −2.1 | 53.4 | 47 | Superiorfrontal | 0.019 | −0.033 |
| III | −3.41 | 54.4 | −0.9 | 23.4 | 64 | Precentral, BA 48 | 0.016 | −0.031 |
| IV | 3.34 | 38.2 | −8.3 | 43.3 | 57 | Precentral, BA 6 | 0.044 | −0.006 |
| V | −3.18 | 8.6 | −46.2 | 47.3 | 11 | Precuneus | −0.057 | −0.004 |
| VI | −3.15 | 6.9 | −4.2 | 51.9 | 37 | Superiorfrontal | 0.010 | −0.040 |
| VII | −3.14 | 46.9 | −54.3 | 10.8 | 15 | Inferiorparietal, BA 21 | −0.007 | −0.042 |
| VIII | −3.00 | 40.3 | −29.8 | −5.2 | 13 | Parstriangularis, BA 47 | 0.001 | −0.040 |
| IX | −2.92 | 36.3 | −13.8 | 49 | 24 | Caudal (inferior) middlefrontal, BA 9 | 0.007 | −0.036 |
| X | −2.84 | 30.6 | −8 | 48.5 | 8 | Caudal (inferior) middlefrontal, BA 6 | 0.009 | −0.020 |
Note: Each area consists of adjacent voxels showing a significant effect; some brain structures have more than one area of change. The magnitude of the peak (t statistic) in each area and its coordinates in standardized space (Tailarach) are listed, together with the size (in Tailarach space) and slope for CHS and control groups (based on linear regression). The FreeSurfer annotation (i.e., label of region most representative of the area) is also included.
Figure 3.
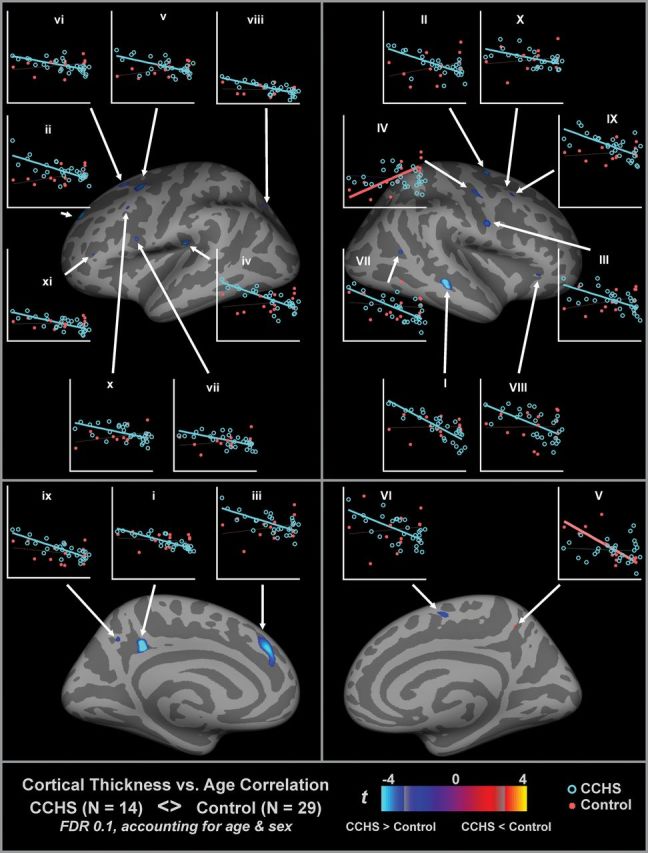
Regions of significant CHS and control differences in age–thickness correlation, accounting for sex (same threshold as Fig. 1). Areas are listed in Table 4. Plots show thickness-by-age for CHS (red) and control (blue), based on the thickness values at the peak of the area, with linear trend lines; thick lines indicate a significant correlation (P < 0.05). The majority of regions show decreasing cortical thickness with age in control but not CHS (blue regions). x-axis scale is 6–24 years, and y-axis is 1.8–4.6 mm (left) and 2–4 mm (right).
Discussion
Patients with CHS showed multiple regions of cortical thinning, as well as age-related differences that suggest differing developmental patterns of the cortex in the syndrome. There are 3 principal earlier findings that likely contribute to the cortical thinning and provide an integrative view of damage in the syndrome. First is the posterior corpus callosum fiber loss, described by Kumar et al. (2011), which likely results in the precuneus thinning and, of functional interest, almost certainly contributes to the spatio-visual and focusing deficits in CCHS; these deficits initially were believed to result only from parasympathetic deficits, part of the autonomic injury so well described in CCHS (Woo et al. 1992; Weese-Mayer et al. 2001). However, the corpus callosum and precuneus injury findings indicate that the visuospatial problems may result from injury to the axonal and cortical integration sites as well. The second integrative pattern emerges from the earlier-described hippocampal–fornix–mammillary body injury, as described in several of our studies (Kumar, Lee, et al. 2009; Macey et al. 2009; Kumar et al. 2010). Hippocampal projections to the temporal cortex are substantial and likely contribute to the temporal cortical thinning, with resulting deficits in planning and memory. A third cortical thinning pattern in the anterior cingulate presumably develops from previously demonstrated axonal loss in the cingulum bundle (Kumar et al. 2005, 2006, 2010) and likely contributes to the loss of the perception of dyspnea in the condition (Liotti et al. 2001; Peiffer et al. 2001)and to additional affective characteristics of the syndrome, including an impaired sense of self-care (Vanderlaan et al. 2004). The medial frontal cortex thinning likely derives from the anterior corpus callosum axonal injury (Kumar et al. 2011). The subcortical gray matter injury and axonal loss thus have consequences for cortical neuronal survival.
Pathophysiology of Cortical Thinning
A reduction in cortical thickness represents atrophy of tissue composed of multiple neuronal and support cell types and could arise from several processes. A number of physiological deficits inherent in the condition impose processes detrimental to axonal and cell body survival, including impaired regulation of perfusion, significant exposure to hypoxia and hypercapnia, poor control of blood pressure, and the possibility of developmental injury imposed by PHOX2B processes independent of the autonomic and breathing consequences of that mutation (Rajkowska et al. 1999; Amiel et al. 2003; Dauger et al. 2003; Narr et al. 2005; Makris et al. 2007; Shaw et al. 2009; Woodward et al. 2009; Calabrese et al. 2010; Lehmann et al. 2010; Lyoo et al. 2010).
CHS patients regularly experience low blood-oxygen levels during sleep and can become hypoxic and hypercapnic during the day as well (Marcus et al. 1991; Lee et al. 2009). Hypoxia leads to widespread injury, but damage is greater in some areas, including the hippocampus, certain cortical areas, and white matter (Takahashi et al. 1993; Lovblad et al. 2004; Huang and Castillo 2008; Qiao et al. 2009). In CHS, the hippocampus shows specific volume reductions (Macey et al. 2009), as do the caudate nuclei (Kumar, Ahdout, et al. 2009), which are also especially susceptible to hypoxia (Kabakus et al. 2006). Volume changes could also reflect injury to nonneuronal support cells; glial cells in both white and gray matter are affected by repeated hypoxic periods (Aviles-Reyes et al. 2010) and by high levels of CO2 (Bakay and Lee 1968). The chronic repeated exposure to hypoxia and hypercapnia in CHS almost certainly underlies some of the cortical thinning, as well as white matter loss shown in other studies (Kumar, Lee, et al. 2009; Kumar et al. 2010).
Disrupted sympathetic and parasympathetic regulation is a hallmark of CHS, and the sympathetic control issues contribute to significant vascular regulation deficits. The impact of these deficits is reflected structurally as extreme dilation in the posterior vascular system (Kumar, Nguyen, et al. 2009), and physiologically as impaired cerebral blood flow at rest and in response to CO2 and O2 challenges (Macey et al. 2003, 2010). Such vascular dysregulation can lead to cortical and axonal injury, with fiber loss also contributing to neural loss in the cortex. A combination of hypoxia and hypoperfusion may be operating; in animal models, the combination is severely damaging (Miyamoto and Auer 2000).
Expression of PHOX2B, mutations of which are found in a high proportion of CHS patients, appears in glia of the mouse forebrain, as well as in major origins of rostrally projecting neurotransmitters, such as the locus coeruleus, source of noradrenergic neurons (Gong et al. 2003); raphé regions, which are sources of serotonergic fibers, also show significant injury in CHS (Kumar et al. 2006). PHOX2B mutations may lead to failed development in major neurotransmitter and axonal glial support processes that would impact cortical brain regions in CHS patients.
Cardiovascular Regulation
A portion of the structural injury may both emerge from and contribute to the cardiovascular and autonomic control abnormalities that appear in CHS (Woo et al. 1992; Weese-Mayer et al. 2001). Both sympathetic and parasympathetic regulation are affected in CHS, with patients showing very low baseline respiratory-related heart rate variability and impaired heart rate responses to respiratory and pressor challenges with vagal components (Woo et al. 1992; Kim et al. 2002; Macey, Valderama, et al. 2004). Bradycardia does not occur during extreme elevation in blood pressure, and sympathetic regulation is impaired, likely a consequence of right insular and cingulate injury (Yasui et al. 1991; Oppenheimer et al. 1992, 1996; Zhang and Oppenheimer 1997; Critchley et al. 2000). The combined damage likely contributes to the loss of nocturnal dipping in blood pressure (Trang et al. 2003) and the impaired global responses of the cranial vascular system, as determined by the blood oxygen level–dependent signal (Macey et al. 2003). Thinning appeared in the medial prefrontal cortex, a region involved in modulating cardiovascular responses (Hardy and Holmes 1988; Resstel et al. 2004; Resstel and Correa 2005; Kimmerly et al. 2007). The posterior cingulate, another area showing thinning in CHS, normally shows greater activity during periods of increased sympathetic reactivity (Gianaros et al. 2007). The posterior cingulate thinning in CHS could lead to less effective modulation of blood pressure. Overall, the number of affected areas involved in autonomic control suggests a link between the disrupted function and cortical losses.
Cognitive and Emotional Regulation
Many CHS patients show some level of cognitive difficulties or mood disruptions (Ruof et al. 2008; Zelko et al. 2010). Cognitive and memory issues are likely related to injury in limbic and memory areas, such as the hippocampus, mammillary bodies, and circuitry including the fornix (Kumar, Lee, et al. 2009; Macey et al. 2009). The findings of midtemporal cortical thinning may reflect changes in the underlying hippocampus, although the hippocampal volume reduction is a separate measure from the temporal cortex thickness (Macey et al. 2009). We might predict that reduced cortical thickness would correlate with increasing psychological symptoms, but we did not collect such measurements.
Changes in Cortical Thickness with Age
Adolescents normally show progressive declines in thickness of the cortex in multiple regions (Sowell et al. 2001; Shaw et al. 2006), a pattern we found in our control but not CHS subjects across multiple regions (Table 4 and Fig. 3). These findings suggest the absence of this normal developmental process in CHS. Since the overall findings are of regional thinner cortex in CHS, the implication is that the patients have experienced some process earlier in life leading to a thinner cortex.
Limitations
The CHS subjects were diagnosed with CCHS according to 1999 American Thoracic Society criteria that did not include genetic testing for PHOX2B mutations in the current 2010 diagnostic criteria (American Thoracic Society 1999; Weese-Mayer et al. 2010). Under the 2010 criteria, patients who show the clinical symptoms of CCHS but without PHOX2B mutations are not classified as having the syndrome. Two of the 5 subjects tested in the present study were not CCHS as per 2010 guidelines. In accordance with clinical diagnostic criteria, these subjects showed no evidence of other explanations of their symptoms, such as primary lung disease, ventilatory muscle weakness, cardiac disease, metabolism problems, or brain stem lesions (Weese-Mayer et al. 2010). There was some variation in the age of diagnosis, and in some subjects the most severe manifestations came after birth, often in response to an infection or other stress (Table 1); however, all patients were unable to sustain ventilation during sleep, showed loss of ventilatory sensitivity to CO2, and had severe autonomic symptoms.
Statistical and analytic limitations should be considered when interpreting the findings. The modest number of patients restricts the number of covariates that can be considered in the model; ideally, TIV would be included as a covariate, but in addition to further limiting statistical power if included, TIV is a relatively unreliable measure due to poor cerebrospinal fluid segmentation and the difficulty in precisely defining the inferior limit of “intracranial.” The modest number of subjects is problematic when controlling for multiple comparisons across many regions in the brain. Approaches to multiple comparisons in neuroimaging data assume varying degrees of independence between measures, but these assumptions are often incorrect as the structure in one brain area is not independent of structures in adjacent regions (Hayasaka and Nichols 2003; Logan et al. 2008). Additionally, the “correct” statistical threshold would likely differ across brain regions, but current methodology for cortical thickness analyses only allows a single whole-brain threshold. While these limitations are not unique to the present study, the consequence here is that the results should be viewed with understanding of how the threshold was set, allowing for the possibility of both false positive and false negative findings.
Conclusions
Extensive axonal and subcortical injury in CHS is paralleled by loss of cortical tissue. Numerous regions showed reduced cortical thickness, including the dorsomedial frontal cortex and medial anterior cingulate, medial prefrontal cortex, parietal and posterior cingulate cortices, the insular cortex, rostral and lateral temporal lobes, and mid- and accessory motor strips. Thinning of the medial prefrontal, insular, and temporal cortices may contribute to CHS cardiovascular and memory deficits, and cingulate and insular cortex injuries may impair affect and perception of breathlessness. The sources of the damage likely include repeated exposure to periods of hypoxia associated with both sleeping and waking hypoventilation. However, other mechanisms may also contribute to neural injury, including impaired cerebral perfusion, glial injury via hypoxia and hypercapnia (Bakay and Lee 1968; Kabakus et al. 2006), and impaired transmitter action resulting from PHOX2B developmental processes. The absence of normal cortical thinning with age in some brain areas in CHS, superimposed on already-thinner areas of cortex, implies that a normal developmental process does not occur in CHS. The consequence of the structural changes is that some of the autonomic, cognitive, and emotional impairments experienced by CHS patients may relate to reduced function in cortical regions.
Funding
National Institutes of Health (NICHD HD-22695).
Acknowledgments
We thank Ms Rebecca Harper for help with data collection and Drs Jennifer Ogren and Heidi Richardson for editorial assistance. Conflict of Interest : None declared.
References
- American Thoracic Society. Idiopathic congenital central hypoventilation syndrome: diagnosis and management. Am J Respir Crit Care Med. 1999;160:368–373. doi: 10.1164/ajrccm.160.1.16010. [DOI] [PubMed] [Google Scholar]
- Amiel J, Laudier B, Attie-Bitach T, Trang H, de Pontual L, Gener B, Trochet D, Etchevers H, Ray P, Simonneau M, et al. Polyalanine expansion and frameshift mutations of the paired-like homeobox gene PHOX2B in congenital central hypoventilation syndrome. Nat Genet. 2003;33:459–461. doi: 10.1038/ng1130. [DOI] [PubMed] [Google Scholar]
- Ashburner J, Friston KJ. Unified segmentation. Neuroimage. 2005;26:839–851. doi: 10.1016/j.neuroimage.2005.02.018. [DOI] [PubMed] [Google Scholar]
- Aviles-Reyes RX, Angelo MF, Villarreal A, Rios H, Lazarowski A, Ramos AJ. Intermittent hypoxia during sleep induces reactive gliosis and limited neuronal death in rats: implications for sleep apnea. J Neurochem. 2010;112:854–869. doi: 10.1111/j.1471-4159.2009.06535.x. [DOI] [PubMed] [Google Scholar]
- Bakay L, Lee JC. The effect of acute hypoxia and hypercapnia on the ultrastructure of the central nervous system. Brain. 1968;91:697–706. doi: 10.1093/brain/91.4.697. [DOI] [PubMed] [Google Scholar]
- Calabrese M, Rinaldi F, Mattisi I, Grossi P, Favaretto A, Atzori M, Bernardi V, Barachino L, Romualdi C, Rinaldi L, et al. Widespread cortical thinning characterizes patients with MS with mild cognitive impairment. Neurology. 2010;74:321–328. doi: 10.1212/WNL.0b013e3181cbcd03. [DOI] [PubMed] [Google Scholar]
- Critchley HD, Corfield DR, Chandler MP, Mathias CJ, Dolan RJ. Cerebral correlates of autonomic cardiovascular arousal: a functional neuroimaging investigation in humans. J Physiol. 2000;523(Pt 1):259–270. doi: 10.1111/j.1469-7793.2000.t01-1-00259.x. [DOI] [PMC free article] [PubMed] [Google Scholar]
- Dale AM, Fischl B, Sereno MI. Cortical surface-based analysis. I. Segmentation and surface reconstruction. Neuroimage. 1999;9:179–194. doi: 10.1006/nimg.1998.0395. [DOI] [PubMed] [Google Scholar]
- Dauger S, Pattyn A, Lofaso F, Gaultier C, Goridis C, Gallego J, Brunet JF. Phox2b controls the development of peripheral chemoreceptors and afferent visceral pathways. Development. 2003;130:6635–6642. doi: 10.1242/dev.00866. [DOI] [PubMed] [Google Scholar]
- Gianaros PJ, Jennings JR, Sheu LK, Derbyshire SW, Matthews KA. Heightened functional neural activation to psychological stress covaries with exaggerated blood pressure reactivity. Hypertension. 2007;49:134–140. doi: 10.1161/01.HYP.0000250984.14992.64. [DOI] [PMC free article] [PubMed] [Google Scholar]
- Gong S, Zheng C, Doughty ML, Losos K, Didkovsky N, Schambra UB, Nowak NJ, Joyner A, Leblanc G, Hatten ME, et al. A gene expression atlas of the central nervous system based on bacterial artificial chromosomes. Nature. 2003;425:917–925. doi: 10.1038/nature02033. [DOI] [PubMed] [Google Scholar]
- Hardy SG, Holmes DE. Prefrontal stimulus-produced hypotension in rat. Exp Brain Res. 1988;73:249–255. doi: 10.1007/BF00248217. [DOI] [PubMed] [Google Scholar]
- Harper RM, Macey PM, Woo MA, Macey KE, Keens TG, Gozal D, Alger JR. Hypercapnic exposure in congenital central hypoventilation syndrome reveals CNS respiratory control mechanisms. J Neurophysiol. 2005;93:1647–1658. doi: 10.1152/jn.00863.2004. [DOI] [PubMed] [Google Scholar]
- Hayasaka S, Nichols TE. Validating cluster size inference: random field and permutation methods. Neuroimage. 2003;20:2343–2356. doi: 10.1016/j.neuroimage.2003.08.003. [DOI] [PubMed] [Google Scholar]
- Huang BY, Castillo M. Hypoxic-ischemic brain injury: imaging findings from birth to adulthood. Radiographics. 2008;28:417–439. doi: 10.1148/rg.282075066. ; quiz 617. [DOI] [PubMed] [Google Scholar]
- Kabakus N, Ozcan A, Aysun S, Yilmaz B. Evaluation of neuronal damage following hypoxic-ischaemic brain injury in acute and early chronic periods in neonatal rats. Cell Biochem Funct. 2006;24:257–260. doi: 10.1002/cbf.1214. [DOI] [PubMed] [Google Scholar]
- Kim AH, Macey PM, Woo MA, Yu PL, Keens TG, Gozal D, Harper RM. Cardiac responses to pressor challenges in congenital central hypoventilation syndrome. Somnologie. 2002;6:109–115. [Google Scholar]
- Kimmerly DS, Wong SW, Salzer D, Menon R, Shoemaker JK. Forebrain regions associated with postexercise differences in autonomic and cardiovascular function during baroreceptor unloading. Am J Physiol Heart Circ Physiol. 2007;293:H299–H306. doi: 10.1152/ajpheart.00044.2007. [DOI] [PubMed] [Google Scholar]
- Kumar R, Ahdout R, Macey PM, Woo MA, Avedissian C, Thompson PM, Harper RM. Reduced caudate nuclei volumes in patients with congenital central hypoventilation syndrome. Neuroscience. 2009;163:1373–1379. doi: 10.1016/j.neuroscience.2009.07.038. [DOI] [PMC free article] [PubMed] [Google Scholar]
- Kumar R, Lee K, Macey PM, Woo MA, Harper RM. Mammillary body and fornix injury in congenital central hypoventilation syndrome. Pediatr Res. 2009;66:429–434. doi: 10.1203/PDR.0b013e3181b3b363. [DOI] [PMC free article] [PubMed] [Google Scholar]
- Kumar R, Macey PM, Woo MA, Alger JR, Harper RM. Elevated mean diffusivity in widespread brain regions in congenital central hypoventilation syndrome. J Magn Reson Imaging. 2006;24:1252–1258. doi: 10.1002/jmri.20759. [DOI] [PubMed] [Google Scholar]
- Kumar R, Macey PM, Woo MA, Alger JR, Harper RM. Diffusion tensor imaging demonstrates brainstem and cerebellar abnormalities in congenital central hypoventilation syndrome. Pediatr Res. 2008;64:275–280. doi: 10.1203/PDR.0b013e31817da10a. [DOI] [PMC free article] [PubMed] [Google Scholar]
- Kumar R, Macey PM, Woo MA, Alger JR, Keens TG, Harper RM. Neuroanatomic deficits in congenital central hypoventilation syndrome. J Comp Neurol. 2005;487:361–371. doi: 10.1002/cne.20565. [DOI] [PubMed] [Google Scholar]
- Kumar R, Macey PM, Woo MA, Harper RM. Rostral brain axonal injury in congenital central hypoventilation syndrome. J Neurosci Res. 2010;88:2146–2154. doi: 10.1002/jnr.22385. [DOI] [PubMed] [Google Scholar]
- Kumar R, Macey PM, Woo MA, Harper RM. Selectively diminished corpus callosum fibers in congenital central hypoventilation syndrome. Neuroscience. 2011;178:261–269. doi: 10.1016/j.neuroscience.2011.01.021. [DOI] [PMC free article] [PubMed] [Google Scholar]
- Kumar R, Nguyen HD, Macey PM, Woo MA, Harper RM. Dilated basilar arteries in patients with congenital central hypoventilation syndrome. Neurosci Lett. 2009;467:139–143. doi: 10.1016/j.neulet.2009.10.024. [DOI] [PMC free article] [PubMed] [Google Scholar]
- Lee P, Su YN, Yu CJ, Yang PC, Wu HD. PHOX2B mutation-confirmed congenital central hypoventilation syndrome in a Chinese family: presentation from newborn to adulthood. Chest. 2009;135:537–544. doi: 10.1378/chest.08-1664. [DOI] [PubMed] [Google Scholar]
- Lehmann M, Rohrer JD, Clarkson MJ, Ridgway GR, Scahill RI, Modat M, Warren JD, Ourselin S, Barnes J, Rossor MN, et al. Reduced cortical thickness in the posterior cingulate gyrus is characteristic of both typical and atypical Alzheimer's disease. J Alzheimers Dis. 2010;20:587–598. doi: 10.3233/JAD-2010-1401. [DOI] [PubMed] [Google Scholar]
- Liotti M, Brannan S, Egan G, Shade R, Madden L, Abplanalp B, Robillard R, Lancaster J, Zamarripa FE, Fox PT, et al. Brain responses associated with consciousness of breathlessness (air hunger) Proc Natl Acad Sci U S A. 2001;98:2035–2040. doi: 10.1073/pnas.98.4.2035. [DOI] [PMC free article] [PubMed] [Google Scholar]
- Logan BR, Geliazkova MP, Rowe DB. An evaluation of spatial thresholding techniques in fMRI analysis. Hum Brain Mapp. 2008;29:1379–1389. doi: 10.1002/hbm.20471. [DOI] [PMC free article] [PubMed] [Google Scholar]
- Lovblad KO, Wetzel SG, Somon T, Wilhelm K, Mehdizade A, Kelekis A, El-Koussy M, El-Tatawy S, Bishof M, Schroth G, et al. Diffusion-weighted MRI in cortical ischaemia. Neuroradiology. 2004;46:175–182. doi: 10.1007/s00234-003-1133-7. [DOI] [PubMed] [Google Scholar]
- Lyoo CH, Ryu YH, Lee MS. Topographical distribution of cerebral cortical thinning in patients with mild Parkinson's disease without dementia. Mov Disord. 2010;25:496–499. doi: 10.1002/mds.22975. [DOI] [PubMed] [Google Scholar]
- Macey PM, Alger JR, Kumar R, Macey KE, Woo MA, Harper RM. Global BOLD MRI changes to ventilatory challenges in congenital central hypoventilation syndrome. Respir Physiol Neurobiol. 2003;139:41–50. doi: 10.1016/j.resp.2003.09.006. [DOI] [PubMed] [Google Scholar]
- Macey PM, Kumar R, Ogren JA, Woo MA, Harper RM. Altered cerebral blood flow in a patient with congenital central hypoventilation syndrome. Sleep Med. 2010;11:589–590. doi: 10.1016/j.sleep.2010.03.008. [DOI] [PMC free article] [PubMed] [Google Scholar]
- Macey KE, Macey PM, Woo MA, Harper RK, Alger JR, Keens TG, Harper RM. fMRI signal changes in response to forced expiratory loading in congenital central hypoventilation syndrome. J Appl Physiol. 2004;97:1897–1907. doi: 10.1152/japplphysiol.00359.2004. [DOI] [PubMed] [Google Scholar]
- Macey PM, Macey KE, Woo MA, Keens TG, Harper RM. Aberrant neural responses to cold pressor challenges in congenital central hypoventilation syndrome. Pediatr Res. 2005;57:500–509. doi: 10.1203/01.PDR.0000155757.98389.53. [DOI] [PubMed] [Google Scholar]
- Macey PM, Richard CA, Kumar R, Woo MA, Ogren JA, Avedissian C, Thompson PM, Harper RM. Hippocampal volume reduction in congenital central hypoventilation syndrome. PLoS One. 2009;4:e6436. doi: 10.1371/journal.pone.0006436. [DOI] [PMC free article] [PubMed] [Google Scholar]
- Macey PM, Valderama C, Kim AH, Woo MA, Gozal D, Keens TG, Harper RK, Harper RM. Temporal trends of cardiac and respiratory responses to ventilatory challenges in congenital central hypoventilation syndrome. Pediatr Res. 2004;55:953–959. doi: 10.1203/01.PDR.0000125262.82405.3C. [DOI] [PubMed] [Google Scholar]
- Macey PM, Woo MA, Macey KE, Keens TG, Saeed MM, Alger JR, Harper RM. Hypoxia reveals posterior thalamic, cerebellar, midbrain, and limbic deficits in congenital central hypoventilation syndrome. J Appl Physiol. 2005;98:958–969. doi: 10.1152/japplphysiol.00969.2004. [DOI] [PubMed] [Google Scholar]
- Makris N, Biederman J, Valera EM, Bush G, Kaiser J, Kennedy DN, Caviness VS, Faraone SV, Seidman LJ. Cortical thinning of the attention and executive function networks in adults with attention-deficit/hyperactivity disorder. Cereb Cortex. 2007;17:1364–1375. doi: 10.1093/cercor/bhl047. [DOI] [PubMed] [Google Scholar]
- Marcus CL, Bautista DB, Amihyia A, Ward SL, Keens TG. Hypercapneic arousal responses in children with congenital central hypoventilation syndrome. Pediatrics. 1991;88:993–998. [PubMed] [Google Scholar]
- Miyamoto O, Auer RN. Hypoxia, hyperoxia, ischemia, and brain necrosis. Neurology. 2000;54:362–371. doi: 10.1212/wnl.54.2.362. [DOI] [PubMed] [Google Scholar]
- Narr KL, Bilder RM, Toga AW, Woods RP, Rex DE, Szeszko PR, Robinson D, Sevy S, Gunduz-Bruce H, Wang YP, et al. Mapping cortical thickness and gray matter concentration in first episode schizophrenia. Cereb Cortex. 2005;15:708–719. doi: 10.1093/cercor/bhh172. [DOI] [PubMed] [Google Scholar]
- Oppenheimer SM, Gelb A, Girvin JP, Hachinski VC. Cardiovascular effects of human insular cortex stimulation. Neurology. 1992;42:1727–1732. doi: 10.1212/wnl.42.9.1727. [DOI] [PubMed] [Google Scholar]
- Oppenheimer SM, Kedem G, Martin WM. Left-insular cortex lesions perturb cardiac autonomic tone in humans. Clin Auton Res. 1996;6:131–140. doi: 10.1007/BF02281899. [DOI] [PubMed] [Google Scholar]
- Peiffer C, Poline JB, Thivard L, Aubier M, Samson Y. Neural substrates for the perception of acutely induced dyspnea. Am J Respir Crit Care Med. 2001;163:951–957. doi: 10.1164/ajrccm.163.4.2005057. [DOI] [PubMed] [Google Scholar]
- Qiao M, Meng S, Foniok T, Tuor UI. Mild cerebral hypoxia-ischemia produces a sub-acute transient inflammatory response that is less selective and prolonged after a substantial insult. Int J Dev Neurosci. 2009;27:691–700. doi: 10.1016/j.ijdevneu.2009.07.004. [DOI] [PubMed] [Google Scholar]
- Rajkowska G, Miguel-Hidalgo JJ, Wei J, Dilley G, Pittman SD, Meltzer HY, Overholser JC, Roth BL, Stockmeier CA. Morphometric evidence for neuronal and glial prefrontal cell pathology in major depression. Biol Psychiatry. 1999;45:1085–1098. doi: 10.1016/s0006-3223(99)00041-4. [DOI] [PubMed] [Google Scholar]
- Resstel LB, Correa FM. Pressor and tachycardic responses evoked by microinjections of L-glutamate into the medial prefrontal cortex of unanaesthetized rats. Eur J Neurosci. 2005;21:2513–2520. doi: 10.1111/j.1460-9568.2005.04078.x. [DOI] [PubMed] [Google Scholar]
- Resstel LB, Fernandes KB, Correa FM. Medial prefrontal cortex modulation of the baroreflex parasympathetic component in the rat. Brain Res. 2004;1015:136–144. doi: 10.1016/j.brainres.2004.04.065. [DOI] [PubMed] [Google Scholar]
- Ruof H, Hammer J, Tillmann B, Ghelfi D, Weber P. Neuropsychological, behavioral, and adaptive functioning of Swiss children with congenital central hypoventilation syndrome. J Child Neurol. 2008;23:1254–1259. doi: 10.1177/0883073808318048. [DOI] [PubMed] [Google Scholar]
- Shaw P, Greenstein D, Lerch J, Clasen L, Lenroot R, Gogtay N, Evans A, Rapoport J, Giedd J. Intellectual ability and cortical development in children and adolescents. Nature. 2006;440:676–679. doi: 10.1038/nature04513. [DOI] [PubMed] [Google Scholar]
- Shaw P, Lalonde F, Lepage C, Rabin C, Eckstrand K, Sharp W, Greenstein D, Evans A, Giedd JN, Rapoport J. Development of cortical asymmetry in typically developing children and its disruption in attention-deficit/hyperactivity disorder. Arch Gen Psychiatry. 2009;66:888–896. doi: 10.1001/archgenpsychiatry.2009.103. [DOI] [PMC free article] [PubMed] [Google Scholar]
- Sowell ER, Thompson PM, Tessner KD, Toga AW. Mapping continued brain growth and gray matter density reduction in dorsal frontal cortex: inverse relationships during postadolescent brain maturation. J Neurosci. 2001;21:8819–8829. doi: 10.1523/JNEUROSCI.21-22-08819.2001. [DOI] [PMC free article] [PubMed] [Google Scholar]
- Takahashi S, Higano S, Ishii K, Matsumoto K, Sakamoto K, Iwasaki Y, Suzuki M. Hypoxic brain damage: cortical laminar necrosis and delayed changes in white matter at sequential MR imaging. Radiology. 1993;189:449–456. doi: 10.1148/radiology.189.2.8210374. [DOI] [PubMed] [Google Scholar]
- Trang H, Boureghda S, Denjoy I, Alia M, Kabaker M. 24-hour BP in children with congenital central hypoventilation syndrome. Chest. 2003;124:1393–1399. doi: 10.1378/chest.124.4.1393. [DOI] [PubMed] [Google Scholar]
- Vanderlaan M, Holbrook CR, Wang M, Tuell A, Gozal D. Epidemiologic survey of 196 patients with congenital central hypoventilation syndrome. Pediatr Pulmonol. 2004;37:217–229. doi: 10.1002/ppul.10438. [DOI] [PubMed] [Google Scholar]
- Weese-Mayer DE, Berry-Kravis EM, Ceccherini I, Keens TG, Loghmanee DA, Trang H American Thoracic Society Central Congenital Hypoventilation Syndrome Subcommittee. An official ATS clinical policy statement: congenital central hypoventilation syndrome: genetic basis, diagnosis, and management. Am J Respir Crit Care Med. 2010;181:626–644. doi: 10.1164/rccm.200807-1069ST. [DOI] [PubMed] [Google Scholar]
- Weese-Mayer DE, Silvestri JM, Huffman AD, Smok-Pearsall SM, Kowal MH, Maher BS, Cooper ME, Marazita ML. Case/control family study of autonomic nervous system dysfunction in idiopathic congenital central hypoventilation syndrome. Am J Med Genet. 2001;100:237–245. doi: 10.1002/ajmg.1249. [DOI] [PubMed] [Google Scholar]
- Woo MA, Macey PM, Macey KE, Keens TG, Woo MS, Harper RK, Harper RM. FMRI responses to hyperoxia in congenital central hypoventilation syndrome. Pediatr Res. 2005;57:510–518. doi: 10.1203/01.PDR.0000155763.93819.46. [DOI] [PubMed] [Google Scholar]
- Woo MS, Woo MA, Gozal D, Jansen MT, Keens TG, Harper RM. Heart rate variability in congenital central hypoventilation syndrome. Pediatr Res. 1992;31:291–296. doi: 10.1203/00006450-199203000-00020. [DOI] [PubMed] [Google Scholar]
- Woodward SH, Schaer M, Kaloupek DG, Cediel L, Eliez S. Smaller global and regional cortical volume in combat-related posttraumatic stress disorder. Arch Gen Psychiatry. 2009;66:1373–1382. doi: 10.1001/archgenpsychiatry.2009.160. [DOI] [PubMed] [Google Scholar]
- Yasui Y, Breder CD, Saper CB, Cechetto DF. Autonomic responses and efferent pathways from the insular cortex in the rat. J Comp Neurol. 1991;303:355–374. doi: 10.1002/cne.903030303. [DOI] [PubMed] [Google Scholar]
- Zelko FA, Nelson MN, Leurgans SE, Berry-Kravis EM, Weese-Mayer DE. Congenital central hypoventilation syndrome: neurocognitive functioning in school age children. Pediatr Pulmonol. 2010;45:92–98. doi: 10.1002/ppul.21170. [DOI] [PubMed] [Google Scholar]
- Zhang Z, Oppenheimer SM. Characterization, distribution and lateralization of baroreceptor-related neurons in the rat insular cortex. Brain Res. 1997;760:243–250. doi: 10.1016/s0006-8993(97)00284-9. [DOI] [PubMed] [Google Scholar]