

Abstract
Purpose: To examine the effects of chemotherapy on circulating cell‐free DNA (cfDNA) composition in relation to investigational whole‐body measurement of tumor activity by fluorine‐18 fluorocholine (FCH) positron emission tomography/computed tomography (PET/CT) in hormone‐refractory prostate cancer (HRPC).
Methods: Serial FCH PET/CT scans were performed in eight patients with HRPC receiving docetaxel‐based chemotherapy. Corresponding serial cfDNA samples were characterized by microfluidic electrophoresis, quantified by real‐time PCR, and compared with PET/CT results. Promoter methylation of two prostate cancer‐associated genes, GSTP1 and RARB2, was assessed by methylation‐specific PCR of bisulfite‐converted cfDNA.
Results: Plasma cfDNA concentrations increased significantly from 13.3 ng/mL at baseline to 46.8 ng/mL and 50.9 ng/mL after one and three treatment cycles, respectively (p= 0.001). GSTP1 and/or RARB2 promoter methylation was identified in all pretreatment samples. The appearance of large (200 bp–10.4 kb) cfDNA fragments was noted in posttreatment samples along with loss of methylation at GSTP1 and/or RARB2. Tumor activity on PET/CT correlated with cfDNA concentration (r=−0.50, p= 0.01). Patients meeting criteria for PET tumor response had significantly lower pretreatment cfDNA levels than those who did not (8.0 vs. 16.4 ng/mL, p= 0.03).
Conclusions: Chemotherapy is associated with significant changes in plasma cfDNA content and FCH PET/CT‐detected tumor activity. These interrelated measures are potential candidate markers of therapeutic response in HRPC. Clin Trans Sci 2012; Volume #: 1–6
Keywords: prostate cancer, nucleic acids, epigenetics, positron emission tomography
Introduction
Molecularly individualized cancer treatment is possible with the advent of highly sensitive and minimally invasive techniques for characterizing tumor biology in vivo. For example, tumor‐derived cell‐free DNA (cfDNA) can be isolated from peripheral blood to potentially allow the assessment of tumor genes conveniently and without biopsy, thus providing information that may be used for real‐time customization of molecular therapy. 1 , 2 A detailed understanding of the effects of anticancer treatment on cfDNA composition would be useful in order to develop such a tumor profiling strategy.
Prostate cancer that recurs after surgery or radiation therapy often responds initially to hormonal therapy. However, hormonal therapy is only temporizing and invariably leads to the development of hormone‐refractory prostate cancer (HRPC), the most lethal form of prostate cancer. Docetaxel‐based chemotherapy is a recent advance in the treatment of HRPC, but confers just a modest survival benefit. 3 , 4 Since not all patients with HRPC will respond to chemotherapy, methods that can enable treatment responses to be measured in real‐time could potentially make the use of chemotherapy more judicious, while providing clinical trials with more timely endpoints that may further accelerate the development of new therapeutic agents.
Fluorine‐18 fluorocholine (FCH) positron emission tomography/computed tomography (PET/CT) is a recently developed whole‐body imaging technique that has been shown to enable the detection of hormone‐sensitive and insensitive prostate cancers. 5 , 6 FCH is a radiopharmaceutical analog of choline, and interest in this investigational oncologic imaging probe is based on the observation of up‐regulated phosphocholine metabolism in a variety of cancers. 7 , 8 An on‐going clinical trial evaluating FCH PET/CT as a potential acute measure of therapeutic response in HRPC made it feasible for us to conduct a parallel pilot study evaluating the effects of chemotherapy on cfDNA composition, while exploring the possibility of diagnostic synergy between molecular PET imaging and molecular analysis of cfDNA in advanced metastatic prostate cancer.
Methods
Patient selection
Eight patients designated to receive docetaxel‐based chemotherapy were enrolled to this study. Treatment regimens were based on published clinical trial protocols. 3 , 4 Eligibility for the study required clinical confirmation of HRPC on the basis of two consecutive rises in PSA levels measured at greater than 1 week apart during treatment with an antiandrogen (e.g., bicalutamide) plus luteinizing hormone‐releasing hormone (LHRH) agonist for at least 3 months duration. Biochemical castrate status was confirmed on the basis of a testosterone level of <50 ng/mL at the time of PSA measurement. Chemotherapy was initiated within 30 days of enrollment. The study was approved by the institutional review boards of the University and the Medical Center. Written informed consent was obtained from all patients.
Cell‐Free DNA Analysis
Specimen collection
Blood samples were collected before chemotherapy, and after the first and third treatment cycle. To avoid genomic DNA contamination from skin cells during venipuncture, 5–10 mL of blood was first collected in a separate vial and used for prostate specific antigen (PSA) level determination. A collection vial specifically designed for cfDNA isolation (Cell‐Free BCT, Streck, Inc., Omaha, NE, USA) was then used to collect 10 mL of blood for the study. Plasma was separated by centrifugation at 1,600 g for 10 minutes at room temperature. DNA was extracted from plasma using the QIAamp Circulating Nucleic Acid Kit (QIAGEN Inc., Valencia, CA, USA).
Quantitative real‐time PCR
A 115bp amplicon was used for real‐time quantitative PCR (qPCR) of repeated genomic ALU sequences to detect and quantify cfDNA. The sequences of the forward and reverse primers were 59‐CCTGAGGTCAGGAGTTCGAG‐39 and 59‐CCCGAGTAGCTGGGATTACA‐39, respectively. ALU repeats are abundant in the human genome, allowing high sensitivity PCR‐based DNA quantification. 9 A relatively short amplicon was selected to allow detection of truncated DNA (of typical size range 180–200 bp) from apoptotic cells. 9 , 10 Real‐time amplification was performed with precycling heat activation of DNA polymerase at 95°C for 10 minutes, followed by 45 cycles of denaturation at 95°C for 30 seconds, annealing at 64°C for 30 seconds, and extension at 72°C for 30 seconds using the ABI 7900HT system (Applied Biosystems, Foster City, CA, USA). PCR efficiency of the ALU assay was 94% by dilution curve analysis. Absolute equivalent amounts of DNA in each sample were determined by a standard curve with serial dilutions (1 ng to 0.01 pg) of purified DNA from the peripheral blood cells of a healthy volunteer. All reactions were performed in triplicate. Results in this study are expressed as nanograms of DNA per milliliter of plasma.
DNA fragment length analysis
Microfluidic electrophoresis using the Agilent 2100 Bioanalyzer and High Sensitivity DNA Chips (Agilent technologies Inc., Palo Alto, CA, USA) was performed to assess DNA fragment length for a size range between 35 and 10,380 base pairs (bp) based on manufacturer's recommended protocol.
Methylation specific PCR
Methylation‐specific and unmethylation‐specific PCR (MSP and USP) was used to evaluate the methylation status of two tumor suppressor gene promoter regions known to be methylated with high frequency in prostate cancers: GSTP1 (glutathione S‐transferase1) and RARB2 (retinoic acid receptor beta‐variant 2). 11 , 12 , 13 Sodium bisulfite treatment of genomic DNA using the EZ DNA Methylation‐Direct Kit (Zymo Research, Irvine, CA, USA) was followed by MSP and USP using 11 μL of bisulfite converted DNA. Methylation (M) and unmethylation (U) specific primers used to amplify methylated and unmethylated DNA were: GSTP1, (M) F‐TTCGGGGTGTAGCGGTCGTC and R‐GCCCCAATACTAAATCACGACG, (U) F‐GATGTTTGGGGTGTAGTGGTTGTT and R‐CCACCCCAATACTAAATCACAACA; RARB2, (M) F‐GAACGCGAGCGATTCGAGT and R‐GACCAATCCAACCGAAACG, (U) F‐GGATTGGGATGTTGAGAATGT and R‐CAACCAATCCAACCAAAACAATTGTT. Thermal cycling was performed as follows: an initial 10‐minute incubation at 95°C followed by 45 cycles of denaturation at 95°C for 30 seconds, annealing at 60°C for 30 seconds, and extension at 72°C for 30 seconds, and a final hold for 10 minutes at 72°C. PCR products were run on a 4% agarose gel. Leukocyte DNA from the buffy coat fractions of each patient sample collected prior to treatment served as negative controls for methylation analysis.
Positron Emission Tomography
Radiopharmaceutical synthesis
FCH was synthesized in accordance to an Investigational New Drug application by fluorination of ditosylmethane with fluorine‐18 followed by alkylation of the fluorotosylmethane intermediate with dimethylethanolamine using a chemical process control unit (CTI/Siemens CPCU, CTI/Siemens, Knoxville, TN, USA). 14 All synthesis products passed standard assays for radiochemical purity, radionuclide identity, chemical purity, and pyrogenicity prior to injection. Radiochemical purity was greater than 99%.
PET/CT imaging
PET scans combined with in‐line CT were performed using a Philips Gemini TF‐64 PET/CT scanner (Philips Healthcare, Andover, MA, USA). Each patient underwent a series of three FCH PET/CT scans over the course of at least three cycles of chemotherapy based on a docetaxel regimen. The first scan was performed within 3 weeks prior to chemotherapy initiation. The second scan was performed 3 weeks after the first treatment cycle, and the final scan was performed 3 weeks after the third treatment cycle.
For each scan, a CT transmission scan was first performed in the supine position from the pelvis to the skull. The 64‐channel helical CT scanning parameters were: 120 kV, 50 mA/slice, rotation time 0.75 seconds, and slice thickness/interval 5.0 mm. No intravenous contrast was used. At approximately 12–15 minutes after intravenous injection of 2.6 MBq/kg (0.07 mCi/kg) of FCH, emission scans were acquired from mid‐thigh to skull over 9–11 bed positions at 2‐minutes per bed position. Image reconstruction employed a list‐mode version of a maximum likelihood expectation maximization algorithm. CT data was used for attenuation correction of the PET image data.
Image analysis
PET/CT images were reviewed by a single reader (SK) experienced in the interpretation of FCH biodistribution in prostate cancer patients. 15 , 16 Areas of abnormal activity on the PET images were localized anatomically based on CT and classified as arising from a visceral organ (including prostate), internal lymph node, or skeletal structure ( Figure 1 ). Two‐dimensional region of interest (ROI) analysis was used to measure the maximum standardized uptake value (SUVmax) corresponding to each lesion, defined as the highest measured pixel activity in the ROI divided by the injected radioactivity normalized to body weight. A >30% decline in mean lesion SUVmax across all lesions between two serial PET studies was defined as a positive PET response based on criteria adopted from PET Response Criteria in Solid Tumors (PERCIST). 17
Figure 1.
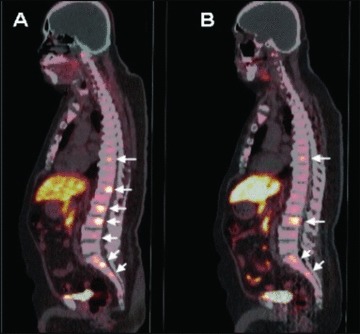
FCH PET/CT of a patient with metastatic hormone‐refractory prostate cancer. Prior to chemotherapy, the FCH PET/CT image ( A ) demonstrates seven metabolically active skeletal metastases involving multiple thoracic and lumbar vertebrae (arrows). Posttreatment FCH PET/CT performed following three cycles of chemotherapy ( B ) demonstrates persistently increased activity in only four of the seven metastases identified on the pretreatment scan (arrows).
Statistical methods
Data analysis was performed using JMP 8.0 (SAS Institute, Cary, NC, USA). For normalization, a logarithmic transformation was applied to mean tumor SUVmax, PSA values, and cfDNA quantities. Untransformed values are given for reporting purposes. Potential associations between cfDNA level (ng/mL), mean tumor SUVmax, and PSA level (ng/mL) were examined by correlation analysis. Mixed‐model ANOVA was used to assess the significance of change across multiple time points. A 2‐tailed p‐value less than 0.05 defined statistical significance.
Results
Subject characteristics
Patient characteristics are summarized in Table 1 . There were no significant differences between PSA levels measured prior to chemotherapy initiation, after the first cycle, and after the third cycle. Of note, patient 5 received radiation therapy for palliation of a bone metastasis immediately before the third treatment cycle.
Table 1.
Patient characteristics and serial PSA measurements.
| Patient ID | Age (years) | Previous primary treatment | Duration of prior hormonal treatments (months) | Baseline PSA at enrollment (ng/mL) | PSA after first chemotherapy cycle (ng/mL) | PSA after third chemotherapy cycle (ng/mL) |
|---|---|---|---|---|---|---|
| 1 | 72 | RT | 12 | 39.3 | 8.1 | 12.4 |
| 2 | 82 | None | 15 | 17.4 | 10.6 | 1.7 |
| 3 | 62 | None | >36 | 25.6 | 19.0 | 5.4 |
| 4 | 69 | RT | >36 | 528.6 | 559.8 | 318.2 |
| 5 | 84 | RP | 15 | 28.1 | 110.0 | 182.0 |
| 6 | 78 | RT | 13 | 44.9 | 38.6 | 21.9 |
| 7 | 76 | None | >36 | 18.1 | 20.4 | 15.4 |
| 8 | 60 | RP | 20 | 28.0 | 24.4 | 15.0 |
RP = radical prostatectomy; RT = radiation therapy.
Cell‐free DNA quantification
Mean cfDNA levels increased from the baseline (prechemotherapy) level of 13.3 ng/mL to 46.8 ng/mL after the first chemotherapy cycle and to 50.9 ng/mL after the third chemotherapy cycle (ANOVA p= 0.001). The pair‐wise comparison of the log cfDNA concentration change from baseline to after the first and third treatment cycle indicated a significant increase in cfDNA for each comparison (p= 0.02 and p= 0.003, respectively on paired t‐tests; Figure 2A ). There were significant correlations between cfDNA concentration and mean SUVmax (r=−0.50, p= 0.01) and between PSA and mean SUVmax (r= 0.61, p= 0.002) across all PET/CT imaging time points ( Figure 3 ). No significant correlations were noted between cfDNA and PSA levels.
Figure 2.
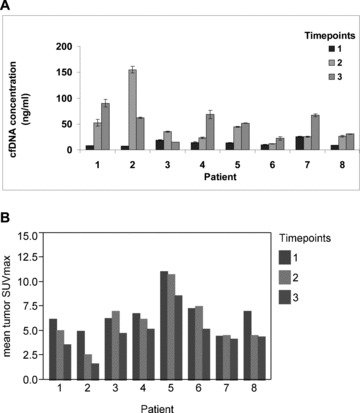
Chemotherapy‐associated changes in cfDNA content and global tumor metabolic activity on FCH PET/CT. A significant increase in cfDNA was observed over the course of chemotherapy ( A ). Error bars for triplicate qPCR measurements are shown for each quantity. A corresponding pattern of decreasing mean tumor activity (SUVmax) was observed with chemotherapy ( B ). Time points correspond to pretreatment (1), after one chemotherapy cycle (2), and after three chemotherapy cycles (3).
Figure 3.
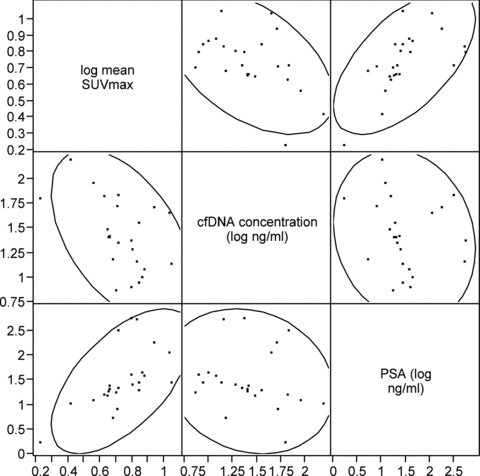
Scatterplot showing the relationships between Mean Tumor SUVmax, cfDNA Concentration, and PSA.
DNA fragment length analysis
DNA from pretreatment samples demonstrated a size range of 160–200 bp consistent with DNA released from apoptotic cells. Additional fragments ranging in size from 200 bp to 10.4 kb were detected in samples collected after the first chemotherapy cycle from patients 1 and 2, suggesting that this was a mixture of DNA derived via apoptotic and necrotic mechanisms ( Figure 4 ).
Figure 4.
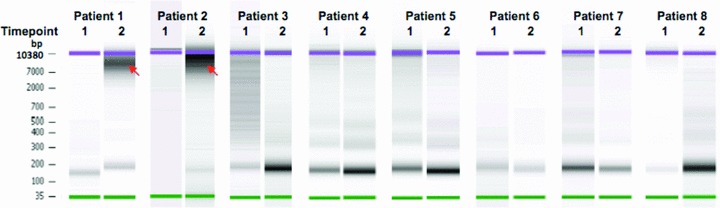
Microfluidic electrophoresis analysis of cfDNA fragment length. DNA size distribution between 35 bp and 10.4 kb was measured using High Sensitivity DNA chip. Samples were obtained prior to chemotherapy (time point 1) and after the first chemotherapy cycle (time point 2). Samples obtained at time point 2 from patients 1 and 2 contained substantially larger DNA fragments (red arrows) with a size range of 200 bp–10.4 kb consistent with necrosis as a source of cfDNA in these samples.
DNA methylation analysis
The plasma cfDNA samples from two patients demonstrated methylation at both GSTP1 and RARB2. Methylation at only RARB2 was demonstrated in one patient, and at only GSTP1 in five patients. In contrast, both GSTP1 and RARB2 were unmethylated in‐patient genomic DNA extracted from leukocytes, with the difference in methylation between leukocyte DNA and cfDNA supporting the tumor‐origin of the cfDNA samples. Methylated GSTP1 and RARB2 cfDNA was no longer detected after chemotherapy in four of the eight patients (patients 1, 2, 4, and 7). This loss of methylated DNA was not associated with significant differences in posttreatment PSA level or change in PSA level.
PET imaging
Mean tumor SUVmax decreased from a pretreatment baseline of 6.8 to 6.1 after the first chemotherapy cycle and to 4.7 after the third chemotherapy cycle ( Figure 2B ). This overall change in mean tumor SUVmax across time points was not statistically significant on the basis of ANOVA (p= 0.13), although on pair‐wise testing between individual time points there were significant decreases in mean tumor SUVmax from baseline to after the third treatment cycle (p= 0.0004) and between the time points following the first and third treatment cycles (p= 0.003). There was a weak but statistically significant correlation between the number of abnormalities detected on FCH PET/CT and PSA level (r= 0.46, p= 0.02).
A significant PET response after the third treatment cycle was noted in patients 1, 2, and 8 ( Figure 1 ). Notably, patients 1 and 2 also exhibited the largest fold‐increases in cfDNA levels, and their postchemotherapy blood samples also contained large DNA fragments consistent with tissue necrosis as the source of cfDNA. Patients in whom PET demonstrated a >30% mean decline in tumor SUVmax after the third treatment cycle had significantly lower pretreatment cfDNA levels than those who did not demonstrate this level of tumor response on PET (8.0 ng/mL of cfDNA in PET responders vs. 16.4 ng/mL in nonresponders, p= 0.03; Figure 5 ). There were no significant differences in PSA levels and changes in PSA levels (after both the first and third cycles of chemotherapy) between PET responders and nonresponders. Posttreatment changes in cfDNA and mean tumor SUVmax are summarized in Table 2 .
Figure 5.
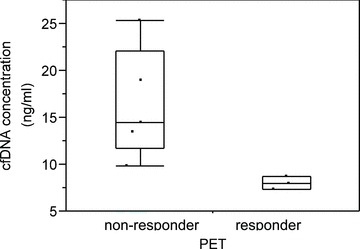
Concentration of plasma cfDNA in PET responders and nonresponders. Criteria for a positive PET response was met by three of eight patients after the third cycle of chemotherapy treatment.
Table 2.
Chemotherapy‐associated fold changes in cfDNA concentration and Mean% changes in tumor SUVmax
| Patient | Baseline cfDNA level (ng/mL) | Fold change in cfDNA after 1 Cycle | Fold change in cfDNA after 3 Cycles | Change in mean tumor SUVmax after 1 Cycle | Change in mean tumor SUVmax after 3 Cycles | Sites of malignancy identified on FCH PET/CT |
|---|---|---|---|---|---|---|
| 1 | 8 | 6.6 | 11.3 | −18% | −42% | S |
| 2 | 7 | 21.2 | 8.5 | −48% | −66% | S |
| 3 | 19 | 1.9 | 0.8 | 11% | −24% | S |
| 4 | 14 | 1.6 | 4.7 | −9% | −24% | S, L |
| 5 | 14 | 3.3 | 3.8 | −3% | −23% | S |
| 6 | 10 | 1.2 | 2.3 | 3% | −29% | S |
| 7 | 25 | 1.0 | 2.6 | 2% | −7% | S, P |
| 8 | 9 | 3.0 | 3.5 | −34% | −37% | L |
For malignant sites identified by FCH PET/CT, S = skeletal system, L = lymph nodes, and P = prostate.
Discussion
The measurement of PSA levels during chemotherapy has not proven to be a reliable predictor of therapeutic response in patients with HRPC, with approximately half of responders in clinical trials failing to show a significant decline in PSA initially. 3 , 4 We preliminarily examined changes in plasma cfDNA as another potential tumor marker based on the hypothesis that immediate changes in plasma cfDNA content may occur as a result of acute tumor‐cell lysis following chemotherapy exposure. Our study of cfDNA composition was incorporated into an on‐going clinical trial evaluating FCH PET/CT imaging as a potential whole‐body imaging predictor of chemotherapy response and resistant tumor progression in HRPC. This novel integration allowed us to preliminarily relate the whole‐body measurement of tumor metabolic activity obtained through PET to measures of cfDNA composition over subsequent cycles of chemotherapy treatment.
In this study, significant increases in plasma cfDNA concentration were observed after the first and third cycles of treatment with docetaxel. These changes in cfDNA level did not correlate with the changes in PSA level, supporting the pharmacokinetic independence of cfDNA and PSA production. Large DNA fragments (in the range of 200 bp–10.4 kbp) were detected in posttreatment samples suggesting that necrotic cell lysis was contributing to the posttreatment increase in cfDNA level. Conversely, pretreatment cfDNA samples were composed primarily of small cfDNA fragments supporting apoptosis as the primary mechanism of constitutive cfDNA production. 10 Similar increases in large circulating cfDNA fragments following neo‐adjuvant chemotherapy of breast cancer have also been reported. 9 Further research is needed to determine whether these chemotherapy‐associated changes in cfDNA composition may translate into novel clinical predictors of therapeutic response.
Promoter methylation involving the genes GSTP1 and RARB2 are among the most frequently encountered epigenetic alterations in prostate cancer. 12 , 13 In this study, promoter methylation at GSTP1 and/or RARB2 was detected in pretreatment plasma cfDNA samples of each patient, confirming that at least some of the cfDNA obtained before treatment was derived from tumors. A change in methylation status at these genes was detected in four out of eight patients following chemotherapy exposure. One potential explanation for this change is that all tumor cells were eliminated after the first treatment cycle and that the cfDNA found in posttreatment samples were derived from dividing nontumor cells that underwent necrosis as a result of chemotherapy toxicity. If confirmed, cfDNA profiling may have the potential to serve as a means to monitor the nontumor side effects of chemotherapy. However, there is some doubt that all tumor sources of cfDNA could be eliminated so readily. Another hypothesis explaining the change in methylation status is that tumor cells with promoter methylation at GSTP1 or RARB2 are more sensitive to chemotherapy, leading to their earlier elimination. The subsequent posttreatment samples could therefore contain tumor DNA that does not exhibit these epigenetic alterations. Other patterns of gene methylation have already been associated with an increased sensitivity to treatment with taxanes in endometrial and cervical cancer. 18 , 19 Various methylation changes have also been associated with responsiveness to docetaxel in breast cancer, 20 , 21 although one study of breast cancer patients reported no association between primary tumor response to docetaxel and GSTP1 methylation status specifically. 22 Further studies are needed to investigate these and other potential mechanisms leading to changes in cfDNA methylation following exposure to chemotherapy.
In addition to significant changes in the cfDNA profile after chemotherapy, a significant change in overall tumor metabolic activity measured by FCH PET/CT was detected after the third treatment cycle. Although the study sample size was small, mean tumor SUVmax correlated significantly with both the cfDNA concentration and PSA level, supporting a potential mechanistic relationship between these potential measures of tumor activity. The possibility that chemotherapy‐associated declines in tumor activity measured by FCH PET/CT are related to nonapoptotic tumor cell death was supported by our observations that the largest increases in plasma cfDNA concentration, and the appearance of necrotic‐size cfDNA fragments, occurred in the posttreatment samples of patients experiencing the most significant PET responses. Further genomic analysis of cfDNA fragments obtained following chemotherapy exposure may therefore be a source of insight into the mechanisms of metabolic detection by PET, as well as the tumor genetics associated with chemotherapy sensitivity.
Lower cfDNA concentrations at baseline were found to be associated with PET responses measured after the third chemotherapy cycle, raising the possibility that information derived from pretreatment cfDNA profiling could aid in predicting chemotherapy outcomes. Larger studies are needed to explore this possibility and ascertain the biological basis of its potential relationship to PET response. Because there have been few previous attempts at correlating the results of cfDNA analysis with molecular imaging, this study was conducted on an exploratory scale. Therefore, while this study has established the feasibility of annotating potential tumor sources of cfDNA using FCH PET/CT imaging, the clinical translational value of these distinctly different measures of tumor activity as potential diagnostic markers of tumor response will need to be based on larger studies in the future.
Conclusion
Substantial changes in plasma cfDNA content can be observed after chemotherapy for HRPC. Changes in the promoter methylation status of cancer‐related genes isolated from cfDNA may also be observed along with tumor metabolic changes measured by FCH PET/CT that appear to correlate with changes in cfDNA content. The translational significance of these interrelationships, including their potential clinical value as therapeutic response markers in advanced prostate cancer, is to be determined by further investigation.
Acknowledgment
This work was supported by federal grants NIH/NCI R21CA139687, NIH/NCI CA071789–12S8, and NIH/NCRR 5G12RR003061. Additional support was provided by The Queen Emma Research Fund.
References
- 1. Leon SA, Shapiro B, Sklaroff DM, Yaros MJ. Free DNA in the serum of cancer patients and the effect of therapy. Cancer Res. Mar 1977; 37(3): 646–650. [PubMed] [Google Scholar]
- 2. Stroun M, Anker P, Maurice P, Lyautey J, Lederrey C, Beljanski M. Neoplastic characteristics of the DNA found in the plasma of cancer patients. Oncology. 1989; 46(5): 318–322. [DOI] [PubMed] [Google Scholar]
- 3. Tannock IF, de Wit R, Berry WR, Horti J, Pluzanska A, Chi KN, Horti J, Pluzanska A, Chi KN, Oudard S, Théodore C, James ND, Turesson I, et al. Docetaxel plus prednisone or mitoxantrone plus prednisone for advanced prostate cancer. N Engl J Med. Oct 7 2004; 351(15): 1502–1512. [DOI] [PubMed] [Google Scholar]
- 4. Petrylak DP, Tangen CM, Hussain MH, Lara PN, Jr. , Jones JA, Taplin ME, Burch PA, Berry D, Moinpour C, Kohli M, et al. Docetaxel and estramustine compared with mitoxantrone and prednisone for advanced refractory prostate cancer. N Engl J Med. Oct 7 2004; 351(15): 1513–1520. [DOI] [PubMed] [Google Scholar]
- 5. Kwee SA, DeGrado TR, Talbot JN, Gutman F, Coel MN. Cancer imaging with fluorine‐18‐labeled choline derivatives. Semin Nucl Med. Nov 2007; 37(6): 420–428. [DOI] [PubMed] [Google Scholar]
- 6. Price DT, Coleman RE, Liao RP, Robertson CN, Polascik TJ, DeGrado TR. Comparison of [18 F] fluorocholine and [18 F] fluorodeoxyglucose for positron emission tomography of androgen dependent and androgen independent prostate cancer. J Urol. Jul 2002; 168(1): 273–280. [PubMed] [Google Scholar]
- 7. Ackerstaff E, Glunde K, Bhujwalla ZM. Choline phospholipid metabolism: a target in cancer cells? J Cell Biochem. Oct 15 2003; 90(3): 525–533. [DOI] [PubMed] [Google Scholar]
- 8. Glunde K, Jacobs MA, Bhujwalla ZM. Choline metabolism in cancer: implications for diagnosis and therapy. Expert Rev Mol Diagn.Nov 2006; 6(6): 821–829. [DOI] [PubMed] [Google Scholar]
- 9. Deligezer U, Eralp Y, Akisik EE, Akisik EZ, Saip P, Topuz E, Dalay N. Size distribution of circulating cell‐free DNA in sera of breast cancer patients in the course of adjuvant chemotherapy. Clin Chem Lab Med. 2008; 46(3): 311–317. [DOI] [PubMed] [Google Scholar]
- 10. Giacona MB, Ruben GC, Iczkowski KA, Roos TB, Porter DM, Sorenson GD. Cell‐free DNA in human blood plasma: length measurements in patients with pancreatic cancer and healthy controls. Pancreas. Jul 1998; 17(1): 89–97. [DOI] [PubMed] [Google Scholar]
- 11. Jerónimo C, Henrique R, Hoque MO, Mambo E, Ribeiro FR, Varzim G, Oliveira J, Teixeira MR, Lopes C, Sidransky D. A quantitative promoter methylation profile of prostate cancer. Clin Cancer Res. Dec 15 2004; 10(24): 8472–8478. [DOI] [PubMed] [Google Scholar]
- 12. Vanaja DK, Ehrich M, Van den Boom D, Cheville JC, Karnes RJ, Tindall DJ, Cantor CR, Young CY. Hypermethylation of genes for diagnosis and risk stratification of prostate cancer. Cancer Invest. Jun 2009; 27(5): 549–560. [DOI] [PMC free article] [PubMed] [Google Scholar]
- 13. Sunami E, Shinozaki M, Higano CS, Wollman R, Dorff TB, Tucker SJ, Martinez SR, Mizuno R, Singer FR, Hoon DS. Multimarker circulating DNA assay for assessing blood of prostate cancer patients. Clin Chem. Mar 2009; 55(3): 559–567. [DOI] [PubMed] [Google Scholar]
- 14. Lim J, Dorman E, Cabral C. Automated production of [18F] FECh and [18F] FCH: preparation and use of [18F] Fluoroalkane sulfonates and Fluoroalkylation agents. J Label Compd Radiopharm. 2003; 46: S46. [Google Scholar]
- 15. Kwee SA, Coel MN, Ly BH, Lim J. (18)F‐Choline PET/CT imaging of RECIST measurable lesions in hormone refractory prostate cancer. Ann Nucl Med. Aug 2009; 23(6): 541–548. [DOI] [PubMed] [Google Scholar]
- 16. Kwee SA, Thibault GP, Stack RS, Coel MN, Furusato B, Sesterhenn IA. Use of step‐section Histopathology to evaluate (18)F‐Fluorocholine PET sextant localization of prostate cancer. Mol Imaging. Jan‐Feb 2008; 7(1): 12–20. [PubMed] [Google Scholar]
- 17. Wahl RL, Jacene H, Kasamon Y, Lodge MA. From RECIST to PERCIST: evolving considerations for PET response criteria in solid tumors. J Nucl Med. May 2009; 50(Suppl 1): 122S–150S. [DOI] [PMC free article] [PubMed] [Google Scholar]
- 18. Banno K, Yanokura M, Kawaguchi M, Kuwabara Y, Akiyoshi J, Kobayashi Y, Iwata T, Hirasawa A, Fujii T, Susumu N, et al. Epigenetic inactivation of the CHFR gene in cervical cancer contributes to sensitivity to taxanes. Int J Oncol. Oct 2007; 31(4): 713–720. [PubMed] [Google Scholar]
- 19. Yanokura M, Banno K, Kawaguchi M, Hirao N, Hirasawa A, Susumu N, Tsukazaki K, Aoki D. Relationship of aberrant DNA hypermethylation of CHFR with sensitivity to taxanes in endometrial cancer. Oncol Rep. Jan 2007; 17(1): 41–48. [PubMed] [Google Scholar]
- 20. Kastl L, Brown I, Schofield AC. Altered DNA methylation is associated with docetaxel resistance in human breast cancer cells. Int J Oncol. May 2010;36(5): 1235–1241. [DOI] [PubMed] [Google Scholar]
- 21. Fiegl H, Millinger S, Mueller‐Holzner E, Marth C, Ensinger C, Berger A, Klocker H, Goebel G, Widschwendter M. Circulating tumor‐specific DNA: a marker for monitoring efficacy of adjuvant therapy in cancer patients. Cancer Res. Feb 15 2005; 65(4): 1141–1145. [DOI] [PubMed] [Google Scholar]
- 22. Arai T, Miyoshi Y, Kim SJ, Akazawa K, Maruyama N, Taguchi T, Tamaki Y, Noguchi S. Association of GSTP1 expression with resistance to docetaxel and paclitaxel in human breast cancers. Eur J Surg Oncol. Jul 2008; 34(7): 734–738. [DOI] [PubMed] [Google Scholar]