Abstract
Since 2006, columns of superficially porous particles (SPP), often called Fused-core®, porous-shell or core-shell particles, have had serious impact on HPLC separations. These particles have pore diameters of about 100 Å designed for separating small molecules. More recently, SPP with 160 - 200 Å pore diameter have been made available for separating peptides and small proteins. This report describes the effects of fused-core particle size, pore size, shell thickness and ligand type for the rapid, efficient separation of larger molecules such as intact proteins and other biomacromolecules up to at least 400 kDa. Optimization of these parameters resulted in particles that show no restricted diffusion that would compromise separating efficiency for large biomolecules. The thin porous shell provides excellent mass transfer (kinetics) for these large molecules, resulting in superior separations compared to conventional totally porous particles. Sample loading capacity can be adjusted to allow good detection sensitivity for minor components in a complex mixture. Strong particle strength ensures the loading of stable, high-efficiency columns. Stationary phases with different alkyl ligands were tested to provide data on retention, column efficiency and peak shapes for proteins. The development of these new wide-pore fused-core particles now allows the HPLC separation of a wide range of molecules of different sizes with advantages of the SPP configuration.
Keywords: Superficially porous particles, fused-core particles, core-shell particles, protein separations, van Deemter plots, pore size
1. Introduction
The availability of Fused-Core® particles in 2006 has made serious impact on the separation of small molecules because of the ability to prepare columns with high separating efficiency with only modest operating pressure. In this report we designate superficially porous particles (SPP) to indicate generic particles with solid cores and porous shells, and fused-core particles as those superficially porous particles specifically prepared at Advanced Materials Technology, Inc. Columns of 2.6 - 2.7 μm SPP with about 100 Å porosity allow separations that are almost equivalent to columns of sub-2 μm particles, but with only about one-half the operating pressure [1-7]. The thin outer shell of the SPP allows rapid diffusion of solute molecules in and out of the pore volume for interaction so that rapid separations can be performed with superior performance, especially for large molecules [8, 9]. The unique characteristics of SPP allow the use of conventional HPLC apparatus without the need for expensive high-pressure equipment and tedious operational steps. More recently, SPP with larger pore diameters (160 - 200 Å) have been made available for the rapid, efficient separation of peptides and small proteins [10-12].
This report describes the development of fused-core particles with even wider pores to allow the separation of biomacromolecules such as intact large proteins. The large pore size for these particles ensures that restricted diffusion for molecules up to at least 400 kDa does not affect separating efficiency. Selection of appropriate particle size, porous shell thickness and stationary phase provides excellent mass transfer (kinetics) for these large molecules, so that columns of these materials show superior separations compared to comparable totally porous particles. The new fused-core particles have the mechanical strength that allows operation to at least 600 bar with stable, efficient columns. Retention, efficiency and peak shapes for proteins were tested with C18, C8 and C4 alkyl stationary phase ligands. The new wide-pore fused-core particles exhibit sufficient sample loading capacity which allows good detection sensitivity for minor components in complex mixtures.
2. Experimental
2.1 Chemicals
Peptides and proteins used as sample probes and in sample mixtures as well as mobile phase modifiers, including potassium phosphate, ammonium formate, and formic acid were obtained from Sigma-Aldrich (St. Louis, MO). Trifluoroacetic acid was obtained from Pierce Chemicals (Rockford, IL) and acetonitrile from EMD (Gibbstown, NJ). Electrophoretic analysis of proteins were conducted on Bio-Rad (Hercules, CA) Criterion TGX 4-20% gradient SDS-PAGE gels that were visualized using Bio-Safe Coomassie G-250 stain, using conditions as essentially recommended by the manufacturer.
2.2 Particles/Columns/Chromatographic conditions
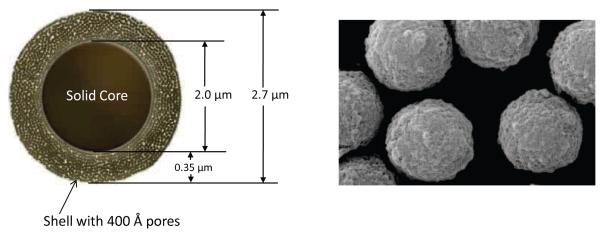
The physical dimensions of one of the new wide-pore SPP particles prepared in this study is shown in a Figure 1 graphic together with a SEM photomicrograph of one of the wide-pore fused-core particles synthesized. Table 1 summarizes the physical characteristics for a range of fused-core particles, including the original Halo particles for separating small molecules, Halo Peptide particles with wider pores for separating peptides, and three new fused-core particles synthesized with even wider pores for separating proteins and other such biomacromolecules. Our main interest has focused on wide-pore 2.7 μm particles with 0.35 μm shell and 3.4 μm particles with 0.2 μm shell. Consequently, the experimental studies of this report mainly involve these two wide-pore particles. The fused-core particles in Table 1 allow fast, efficient separations, as each particle with different pore size, surface area and shell thickness has been designed to provide superior characteristics for particular molecular sizes and configurations.
Figure 1.
Cartoon graphic and SEM microphotograph of fused-core particle with 400 Å pores
Table 1.
Physical Characteristics of Fused-core Particles
| Fused-core particle |
Particle size, μm |
Pore size, Å |
Surface area, m2/g |
Shell thickness, μm |
Core/particle diameter ratio |
% Porosity |
Pore volume, cm3/g |
|---|---|---|---|---|---|---|---|
| Halo | 2.7 | 90 | 135 | 0.5 | 0.63 | 75 | 0.26 |
| Halo Peptide | 2.7 | 160 | 80 | 0.5 | 0.63 | 75 | 0.29 |
| Wide-pore | 2.7 | 400 | 29 | 0.35 | 0.74 | 59 | 0.23 |
| Wide-pore | 2.7 | 420 | 14 | 0.2 | 0.85 | 46 | 0.11 |
| Wide-pore | 3.4 | 400 | 10 | 0.2 | 0.88 | 31 | 0.07 |
Particle sizes were determined with a Coulter Multisizer 3 instrument (Fullerton, CA). Surface area BET measurements were conducted with a Micromeritics TriStar II instrument (Norcross, GA). Shell thicknesses were determined by the difference in Coulter counter measurements for the starting solid cores and the final particles. This parameter was confirmed by cross-section microphotographs prepared by Micron, Inc. (Wilmington, DE), who also prepared scanning electron microphotographs of the fused-core particles.
Columns of fused-core particles, including HALO® and HALO Peptide, were obtained from Advanced Materials Technology (Wilmington, DE). Columns of conventional totally porous particles were from Mac-Mod Analytical (Chadds Ford, PA). The collection of HPLC data was conducted with an Agilent Model 1100 liquid chromatograph (Palo Alto, CA) having an operating pressure up to 400 bar. Data acquisition and instrument control used version B.01.03 ChemStation software. Some data were obtained with an Agilent Model 1200 SL instrument up to 600 bar using Version B.03.02 ChemStation data collection and instrument control software. To minimize extra-column band broadening effects, a 5 μL flow cell with the heat exchanger bypassed was used for the Agilent 1100, while a 2 μL flow cell was used for the Agilent 1200. Additionally, all of the capillary tubing connections and needle seats were 0.12 mm ID for both Agilent instruments. Peak widths (Full Width Half Max) were used for measuring plate numbers. The column stability study was performed on a Shimadzu Prominence UFLC XR instrument. No corrections for instrumental extra-column band broadening effects were applied to any of the chromatographic data in this study.
3. Results and Discussion
3.1 Effect of particle dimensions
Plots of plate heights versus mobile phase velocity (usually called van Deemter plots) are often used to characterize HPLC columns. The van Deemter relationship is expressed as [13]:
| (1) |
where, H is the plate height, A, B, C are constants, and u is the linear mobile phase velocity. The constant A relates to the band spreading contribution by eddy diffusion effects, B defines the contribution by longitudinal diffusion and C is the contribution due to mobile and stationary phase mass transfer (kinetic) effects. This relationship can be reconfigured in a convenient form attributed to Knox [14]:
| (2) |
where, h is the reduced plate height (h = H/dp, dp is the particle diameter) and v is the reduced mobile phase velocity (v = ucdp/Dm; uc is the mobile phase interstitial velocity, and Dm is the solute diffusion coefficient). However, for purposes of the studies in this report, the reduced plate height h value in the Knox equation is slightly altered in that the linear mobile phase velocity u is used instead of reduced velocity, since practitioners often use this easily-obtained experimental value to define column performance. The reduced plate value h determined in this manner conveniently describes fused-core column performance when changes in particle size, shell thickness and other such variables are studied. The reduced plate height h plotted versus the reduced mobile phase velocity is of special interest for column performance information when solutes with different diffusion characteristics are compared.
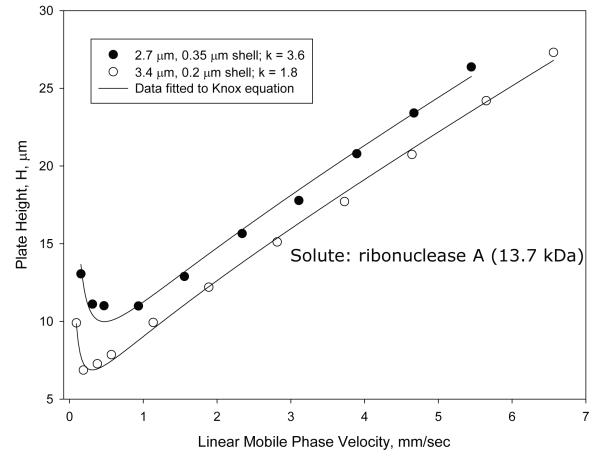
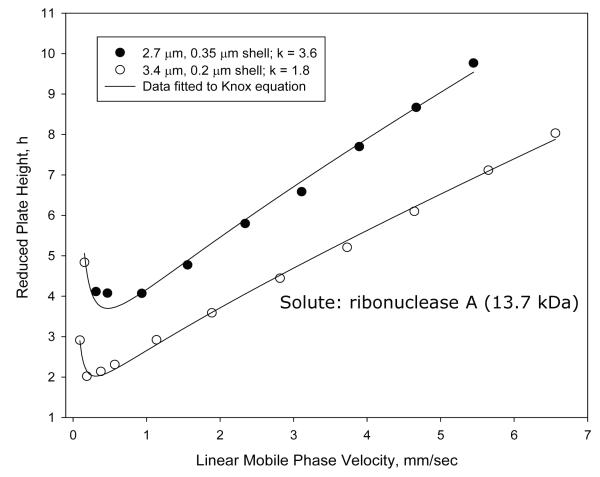
Unusual results were found when van Deemter plots were attempted with proteins on the particles of this study. Figure 2A shows plate height plots for two of the wide-pore particles of this study using ribonuclease A (13.7 kDa) as the solute. Because of internal interest our attention has largely been focused on the 2.7 μm particles with a 0.35 μm porous shell and 3.4 μm particles with a 0.2 μm shell. Surprisingly, when columns of 4.6 mm × 100 mm are compared, the larger (3.4 μm) particle shows a smaller plate height (better efficiency) than smaller particles (2.7 μm) (Table 1) throughout the mobile phase range studied. This is not in keeping with conventional theory for small molecules where the smaller particle should result in smaller plate heights [13]. However, other tests using small molecules showed reduced plate heights h for the columns were 1.4 and 1.7, respectively, for the 3.4 and 2.7 μm particles. This result suggests superior packed bed homogeneity for the larger particles. Since pore sizes were closely comparable (Table 1), the unusual results of Figure 2A may be at least partially attributed to differences in packed bed efficiency. The unusual data also could be due to shell thickness and surface area differences. The reduced plate height Knox plots in Figure 2B give the same information, except here the thinner shells show slightly smaller increase in reduced plate height with mobile phase velocity increase (smaller van Deemter C terms). To verify this unusual trend, van Deemter and Knox plots were also prepared for apomyoglobin (17.3 kDa). Closely similar results were found (not reported here). Guiochon et al. have proposed that performance of superficially porous particles can vary with the roughness of the particles surface affecting diffusion [6, 15]. The slightly rougher surface of the wide-pore particles with the thicker porous shell may have some effect, if this is a source. The unusual results of this study need further investigation to provide a more satisfactory picture. However, other studies have clearly shown the advantage of larger particles in the packing of columns with lower reduced plate heights. Reduced plate height decreases with increase in the particle size for totally porous particles [16]. The same trend has been found for SPP [17, 18], so we are inclined to favor superior packing homogeneity for the higher efficiency of the 3.4 μm particles.
Figure 2.
Effect of particle on performance
Columns: 4.6 × 100 mm; Particles: as shown on figure; Solute: ribonuclease A; Temperature: 60 oC; Mobile phase: 23.9% acetonitrile/76.1% aqueous 0.1% trifluoroacetic acid; Instrument: Agilent 1100 with autosampler
A. Plate height; B. Reduced plate height.
Another aspect of the van Deemter experiments using proteins that was observed was the change in retention factor as flow rate/pressure increased. The maximum pressure applied was 220-320 bar, depending on the particle and the mobile phase composition. This effect was more pronounced with higher molecular weight proteins. For example, the retention factor of enolase almost doubled with a doubling of the flow rate/pressure. In contrast, the increase in retention factor for ribonuclease A was a factor of 1.3 with double the flow rate/pressure. This effect has previously been reported [19].
3.2 Bonded phase effects
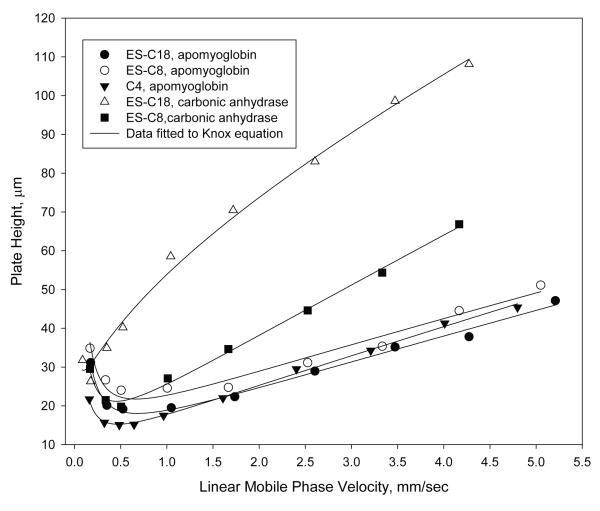
Van Deemter plots for C18, C8 and C4 bonded stationary phases on wide-pore fused-core particles are shown in Figure 3 for the protein, apomyoglobin (17 kDa) and C8 and C18 data for carbonic anhydrase (30 kDa). The C8 and C18 stationary phases were prepared with sterically-protected silanes [20, 21] (diisopropyl-n-octylsilane and diisobutyl-octadecylsilane, respectively) while the C4 phase consisted of a densely-reacted straight-chain n-butyl group. Interestingly, all phases show similar characteristics for the effect of mobile phase velocity on the apomyoglobin plate height (van Deemter C-term), with the C4 phase showing slightly better efficiency. For the larger protein, carbonic anhydrase, the shorter-chain C8 ligand shows a smaller plate height and a much lower increase in plate height with mobile phase velocity increase compared to the C18 phase. This result on fused-core particles suggests that the C18 phase may be less desirable for some protein separations with the shorter C8 and C4 ligands preferred. Since the same particles and operating conditions were used for carbonic anhydrase with the two phases, the large differences in plate heights, especially at higher mobile phase velocities, suggest that a stationary phase mass transfer limitation may be strongly occurring here for the C18 stationary phase. Further data are needed to clarify this possibility.
Figure 3.
Effect of bonded phase on proteins
Columns: 4.6 × 100 mm; Particles: 2.7 μm, 400 Å; Temperature: 60 °C; Mobile phase – ES-C18, apomyoglobin: 38.6% acetonitrile/61.4% water/0.1% trifluoroacetic acid ES-C8, apomyoglobin: 37.7% acetonitrile/62.3% water/0.1% trifluoroacetic acid C4, apomyoglobin: 39.4% acetonitrile/60.6% water/0.1% trifluoroacetic acid ES-C18, carbonic anhydrase: 41% acetonitrile/59% water/0.1% trifluoroacetic acid ES-C8, carbonic anhydrase: 39.76% acetonitrile/60.24% water/0.1% trifluoroacetic acid
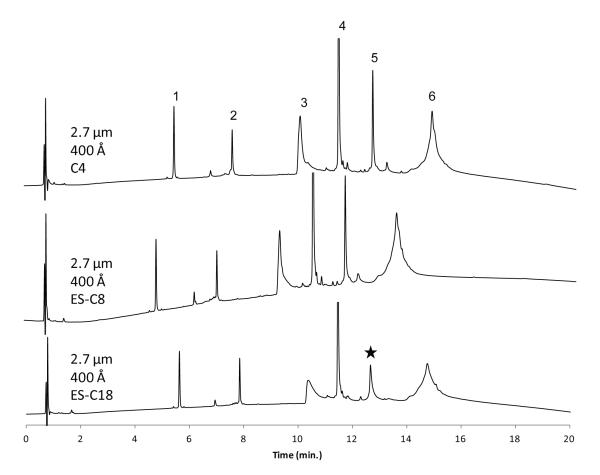
It is well known that columns with different alkyl bonded phases can show differences in retention and selectivity for different compounds in a mixture [21]. Accordingly, it would be expected that this should also be the case for different macromolecules such as peptides and proteins. To test this feature for the wide-pore fused-core particles, columns with C4, C8 and C18 stationary phases were prepared and separations performed with a mixture of typical proteins, as shown in Figure 4. For this acetonitrile/aqueous trifluoroacetic acid mobile phase, there were only minor differences in the peak shape and yield of the components in this mixture for the C4 and C8 phases. Bovine serum albumin and phosphorylase B are proteins with known impurities and/or possible structural variations which result in broader, less well-defined peaks in this separating system. The shorter C4 phase shows slightly greater retention because of a higher density of the ligand on the silica support (4.2 μmol/m2, 0.85 % carbon), compared to the bulky sterically-protected C8 group (2.0 μmol/m2, 0.92 % carbon) [20]. However, for these separating conditions, the column with the sterically-protected C18 phase in Figure 4 generally showed poorer peak shapes for some compounds, and even an apparent loss of some proteins during the separation (e.g., enolase peak). It should be noted, however, that mismatch of the hydrophobicity of a protein and the stationary phase can result in significant differences in selectivity within some separation conditions [22, 23]. This situation probably means that, depending on the protein, stationary phase and operating conditions, the optimum separation of a particular protein can be best performed with a particular stationary phase, but that C8 and C4 ligands appear to be more desirable for some proteins.
Figure 4.
Effect of bonded phase on protein separation
Columns: 2.1 × 100 mm; Mobile phase gradient: 20-70% acetonitrile/aqueous 0.1% trifluoroacetic acid in 20 min; Flow rate: 0.3 mL/min; Temperature: 60 °C; Injection: 1 μL; Detection: 215 nm; Peak identities: (1) ribonuclease A – 13.7 kDa (2) cytochrome c – 12.4 kDa (3) bovine serum albumin – 66.4 kDa (4) apomyoglobin – 17 kDa (5) enolase – 46.7 kDa (6) phosphorylase b – 97.2 kDa; Instrument: Agilent 1200 SL with autosampler; Star shows an apparent loss of enolase protein on the ES-C18 column
3.3 Pore size effects
The size of the particle pores determines the range of compounds that can enter the porous structure for interaction with the stationary phase. Particle pore size should be large enough so that the solute molecules can access pores without restricted diffusion, otherwise, the result is broader peaks and reduced column performance. In the case of proteins, pore size is particularly important as these large molecules can undergo conformational changes as a result of folding and unfolding tendencies. Native and non-native forms can exist simultaneously, so that in the reversed-phase separation process the usual approach is to ensure that the protein is in a stable chromatographic configuration, usually in a non-native state. A mobile phase with trifluoroacetic acid or containing urea or some other agent often is used in an attempt to produce stable configurations for separating proteins [24].
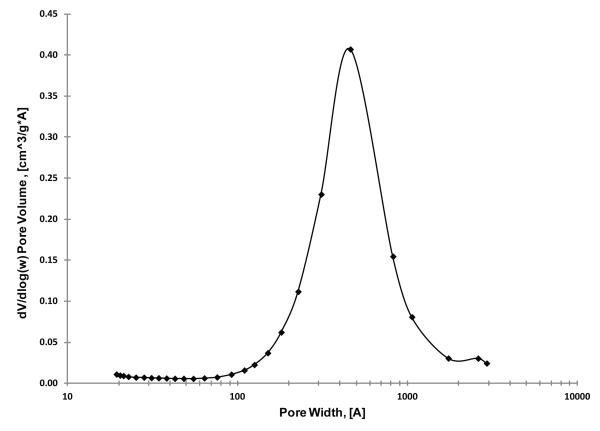
In this study, we have prepared particles with pores sufficiently large to allow the unrestricted pore access of large proteins. Figure 5 shows a plot of a BET nitrogen adsorption measurement of one of the wide-pore particles synthesized in this study (2.7 μm, 0.35 μm shell). The median of this Gaussian pore volume plot is 400 Å for this wide-pore material. Successful BET pore size measurements of this type were made with wide pore particles using the instrument manufacturer’s recommendations for long equilibrium times with nitrogen adsorption (10 sec) and a large sample mass for smaller surface area particles.
Figure 5.
Pore-size distribution of fused-core particles
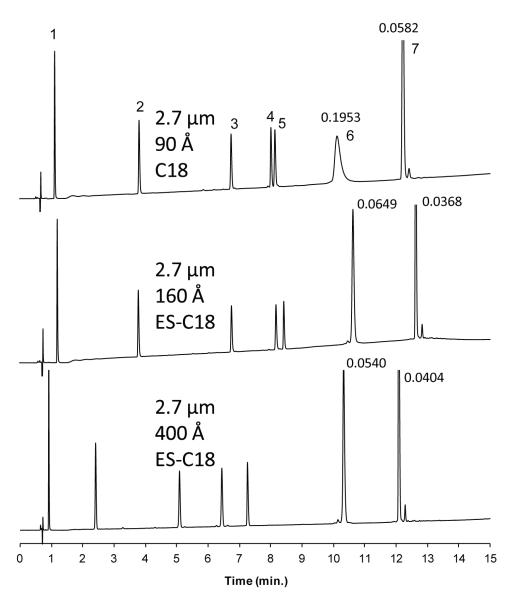
The effect of pore size is illustrated by the data in Figure 6 for some peptides and smaller proteins. The same mixture of peptides and small proteins was run using C18 bonded phase on fused-core particles with different sized pores. The fused-core particles with 90 Å pores (Table 1) clearly show some restricted diffusion for ribonuclease A (13.7 kDa) with a broad peak; pores are too small for total access with a molecule of this size and restricted diffusion results. These particles were specifically developed for separating small molecules, and other studies have indicated that molecules larger than about 5,000 molecular weight can show restricted diffusion. Fused-core particles with 160 Å pores were specifically designed for separating peptides and small proteins. These fused-core particles with 160 Å pores in Figure 6 show a much sharper, lower volume peak for ribonuclease A. However, this pore size appears to be limiting for solutes above about 15,000 molecular weight (depending on molecular configuration), so the 160 Å pore size may be close to reaching its limit in regards to total ribonuclease access. Note that the peak for insulin (~5 kDa) now has narrowed slightly, suggesting that pores in these 90 Å particles were slightly constricting for this protein. In Figure 6, the fused-core particle with 400 Å pores shows an even narrower peak for ribonuclease where no restricted diffusion occurs. As expected, the column with 400 Å pores particles shows somewhat less retention for these solutes because of a smaller surface area. Despite this, the selectivity between peaks 4 and 5 is excellent on the 400 Å ES-C18 column.
Figure 6.
Effect of pore size
Columns: 4.6 × 100 mm; Particles: 2.7 μm; Mobile phase - A: 10% acetonitrile/aqueous 0.1% trifluoroacetic acid; B: 70% acetonitrile/aqueous 0.1% trifluoroacetic acid; Gradient: 0% B to 50% B in 15 min.; Flow rate: 1.5 mL/min; Temperature; 30 °C; Injection: 5 μL; Instrument: Agilent 1100; Detection: 220 nm; Peak identities: (1) Gly-Tyr – 238 g/mol (2) Val-Tyr-Val – 380 g/mol (3) methionine enkephalin – 574 g/mol (4) angiotensin II– 1046 g/mol (5) leucine enkephalin – 556 g/mol (6) ribonuclease A – 13,700 g/mol (7) insulin – 5800 g/mol; Peak widths in minutes measured at 50% height for ribonuclease A and insulin
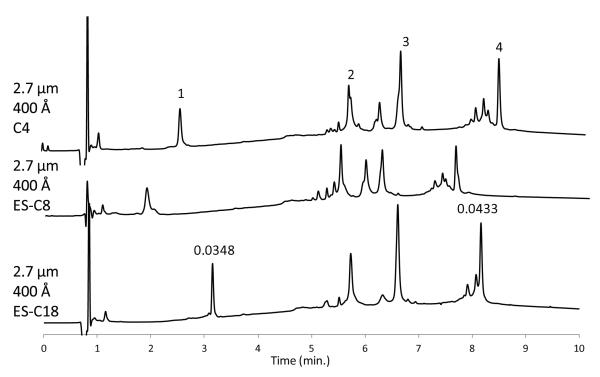
The capability of the particles with 400 Å pores is illustrated in Figure 7 where large proteins up to more than 400 kDa were successfully separated. The commercially available large proteins in this mixture contained impurities or other variants which were at least partially separated by this fast gradient. Some selectivity difference in the separation of these minor peaks was found for the different stationary phases, but for the separation of this particular mixture, the C4 and C8 stationary phases appear to have advantages over a C18 stationary phase. In the gradient separation with the C18 phase, peak widths for the small protein, cytochrome C (12.4 kDa), and the large myosin subunit (220 kDa) are similar, indicating that the large protein enters the pore structure without restricted diffusion. The cytochrome C peak in the C8 separation is somewhat broader than for the other two stationary phases as the effective capacity factor k value is smaller so it is likely that instrumental extra-column effects begin to be effective. As previously noted, retention for the C4 phase is greater because of a higher concentration of organic on the silica support. More information on the separation of the large protein, myosin (200 – 400 kDa), is given in Section 3.9 of this report.
Figure 7.
Separation of large proteins
Columns: 2.1 × 100 mm; Mobile phase - A: water/0.1% trifluoroacetic acid; B: acetonitrile/aqueous 0.1% trifluoroacetic acid; Gradient: 30% B to 70% B in 10 min; Flow rate: 0.3 mL/min; Temperature: 60 °C; injection: 1 μL; Detection: 215 nm; Peak identities: (1) cytochrome c – 12.7 kDa (2) ferritin – 443 kDa (3) β-amylase – 200 kDa (4) myosin – 500 kDa [220 kDa monomer]; Instrument: Agilent 1200 SL; Peak widths in minutes measured at 50% height for cytochrome c and myosin
3.4 Effect of protein molecular weight on column efficiency
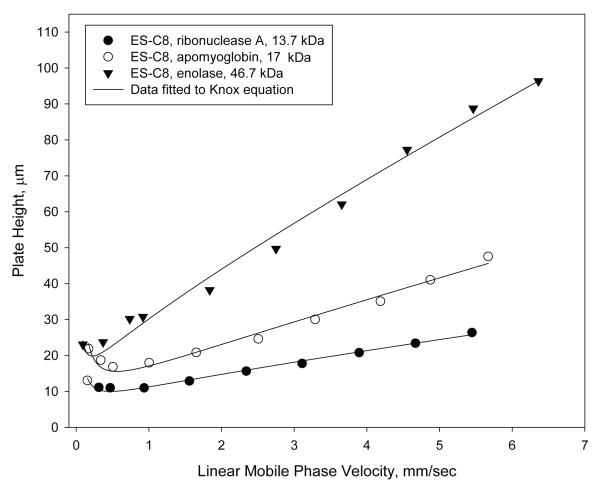
It is well known that increase in the size or molecular weight of solutes causes decreased efficiency of HPLC columns [25]. This effect is a direct result of poorer diffusion for larger molecules. Superficially porous particles tend to minimize this reduced efficiency because of the thin outer shell that facilitates the access and exit of solutes (mass transfer) that interact with the stationary phase. Even with the mass transfer advantage of wide pore fused-core particles, the effect of the poorer diffusion of larger molecules still is present, as shown in Figure 8. As the molecular weight and size of the protein molecules increases, the efficiency of the column decreases and the slope of the van Deemter plot (C-term) increases, as predicted by theory [13]. However, the resulting performance is still sufficient to allow efficient, rapid protein separations, as evidenced in other separations in this report.
Figure 8.
Effect of protein size
Columns: 4.6 × 100 mm; Particles: 2.7 μm, 400 Å, ES-C8; Temperature: 60 °C; Mobile phase – ribonuclease A: 23.9 % acetonitrile/76.1% aqueous 0.1% trifluoroacetic acid; k = 3.6 apomyoglobin: 28.3 % acetonitrile/61.7 % aqueous 0.1% trifluoroacetic acid; k = 3.2 enolase: 42% acetonitrile/ 58 % aqueous 0.1 % trifluoroacetic acid; k = 3.9
3.5 Effect of particle type on sample mass loading of proteins
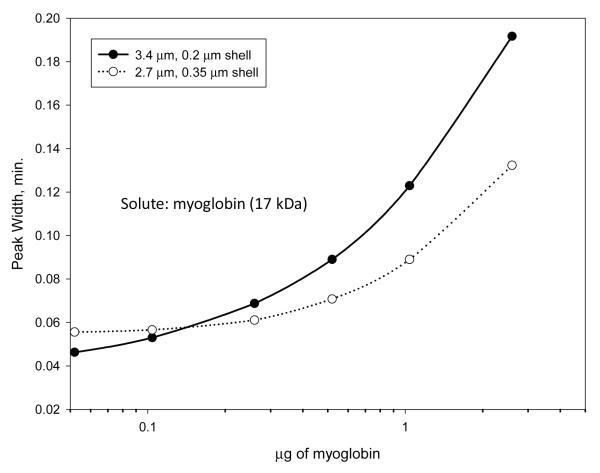
As might be anticipated, the ability to load a sample mass on a column depends on the available surface area of the stationary phase for the particles. This is confirmed with the data in Figure 9. Here, peak widths are reported for a gradient separation of increasing mass of myoglobin (17 kDa) using columns of the wide-pore particles of this study. Higher loading mass can be obtained with the higher surface area particles (Table 1) before a significant change in peak width is observed. In summary, the particles with thinner porous shells and lower surface areas show faster increase in peak widths with increasing sample mass than particles with thicker porous shell and a larger surface area. However, all of the particles studied show sufficient capability in sample loading mass for general use in protein chromatography, especially when sensitive detection such as mass spectrometry is available.
Figure 9.
Effect of particle on sample mass loading for myoglobin
Columns: 4.6 × 100 mm; Particles as shown; Mobile phase - A: water/aqueous 0.1% trifluoroacetic acid; B: acetonitrile/aqueous 0.1% trifluoroacetic acid; Gradient: 37%-47% B in 10 min.; Flow rate: 0.5 mL/min; Temperature: 60 °C; Injection: 5 μL; Instrument: Agilent 1100 with autosampler
3.6 Mobile phase effects
It is well known that different mobile phases can influence the shape of chromatographic peaks and these effects can vary widely, especially for compounds with ionic charge. Proteins have multiple ionic charges, so it might be expected that different mobile phases would have an effect on the peak shape and therefore the efficiency of resultant peaks. Gradient elution, which is routinely used for peptide and protein separations, tends to minimize the broadening of tailing or misshapen peaks. However, loss in column efficiency and separation resolution still exists when peaks for compounds are less than Gaussian.
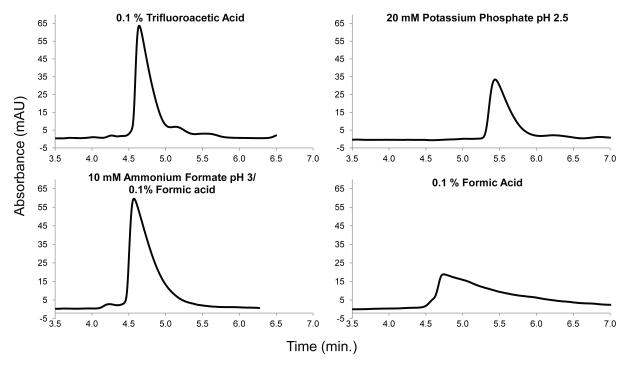
The effect of mobile phase on peak shape was investigated for apomyoglobin (17 kDa) by using isocratic conditions which more clearly defines true peak shape. As shown in Figure 10, four different acetonitrile/ aqueous acid mobile phases were tested. Acetonitrile compositions of 31-38% were required to maintain capacity factor k values in the 3.2 - 3.8 range so that peak shapes could be compared on a closely similar basis. As seen in Figure 10, the isocratic peak for the 0.1% trifluoroacetic acid-modified mobile phase produced a superior peak shape (tailing factor = 2.7), with phosphate (tailing factor = 3.6) and formic acid with ammonium formate (tailing factor = 3.4) yielding similar tailing factors. Formic acid (tailing factor = 5.4), commonly used in separating peptides and proteins with mass spectrometric detection, produced by far the poorest peak shape. Formic acid with 10 - 20 mM ammonium formate shows significantly improved peaks and is recommended when formic acid-base systems must be used [11,26]. The apomyoglobin peak isocratically chromatographed with pH 2.5 phosphate buffer is improved over formic acid-based mobile phases, but this non-volatile additive is not very useful for mass spectrometric studies.
Figure 10.
Effect of mobile phase type: Column: 4.6 × 100 mm; Temperature: 60 °C; mobile phase: 31-38% acetonitrile/modifier as shown; Flow rate: 1.0 mL/min; Capacity factor k range: 3.2-3.8; Solute: apomyoglobin, 2.5 μg; Detection: 215 nm
3.7 Fused-core and totally porous particle comparison
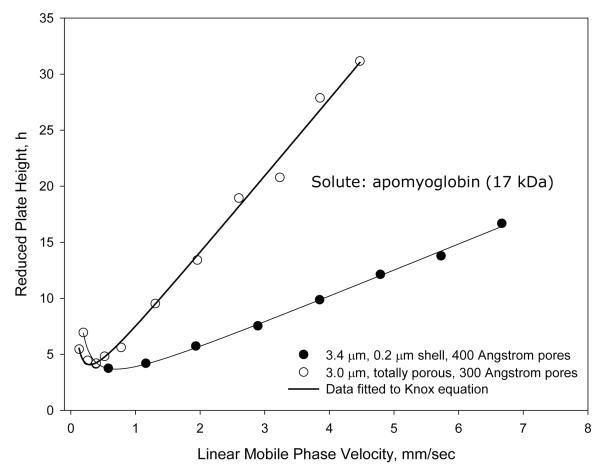
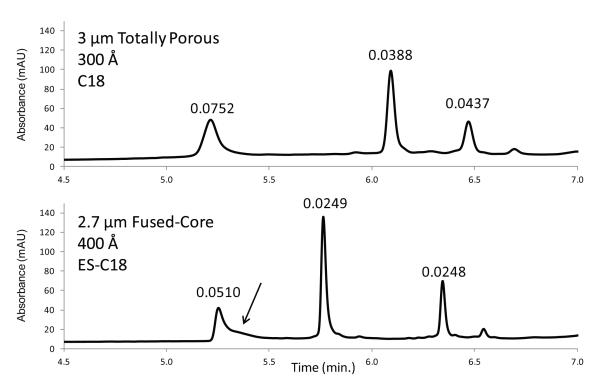
Because of superior mass transfer (kinetic) properties, superficially porous particles are known to provide improved separations, particularly for larger molecules and especially at higher mobile phase velocities [1-4, 10, 21]. The advantage of fused-core particles in this regard is shown in Figure 11 for a comparison of van Deemter plots of apomyoglobin (17 kDa) with 3.4 μm 400 Å fused-core particles and high-quality 3 μm 300 Å totally porous particles. The superior mass transfer and efficiency of the fused-core particles is evident, especially at higher mobile phase velocities. This advantage allows faster protein separations with improved resolution when fused-core particles are used. The chromatographic advantage of the new wide pore particles in this regard is shown in Figure 12. The comparative separation of mid-range proteins is shown for a column of a 3 μm wide-pore totally porous particle (300 Å) and a column of 2.7 μm fused-core particles (400 Å ) of this study. In excess of the slight difference in particle size, the fused-core particles produce significantly narrower peaks for higher separation resolution. For the fused-core column, a minor component in bovine serum albumin indicated by the arrow begins to show some separation, where this is not observed with the totally porous particles.
Figure 11.
Fused-core versus totally porous particles
Columns: 4.6 × 100 mm; Fused-core: 3.4 μm, 0.2 μm porous shell. ES-C8; totally porous: 3.0 μm, C8; Temperature: 60 °C Mobile phase - Fused-core: 37.8 % acetonitrile/62.2 % aqueous 0.1 % trifluoroacetic acid; k = 3.9 Totally porous: 39.8 % acetonitrile/60.2 % aqueous 0.1 % trifluoroacetic acid; k =4.4
Figure 12.
Fused-core vs. totally porous particles: protein separations with C18
Columns: 4.6 × 100 mm; Mobile phase - same as in Figure 7; Gradient: 20% B to 70% B in 10 min; Flow rate: 1.5 mL/min Temperature: 60 °C; Injection: 5 μL; Instrument: Agilent 1100; Detection: 215 nm; Peak identities in order: bovine serum albumin – 66.4 kDa, apomyoglobin – 17 kDa, and enolase – 46.7 kDa; Peak widths in minutes measured at 50% height
3.8 Stability of wide-pore fused-core columns
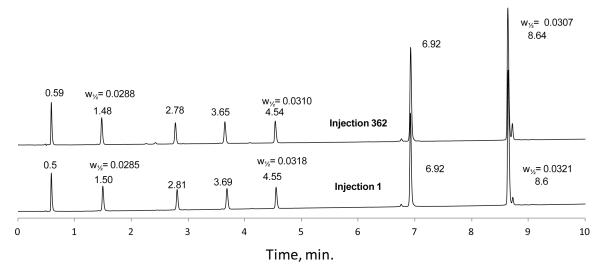
To investigate the stability of columns prepared with the wide-pore fused-core particles, a column of 2.7 μm particles with 0.35 μm shell (400 Å pores) and a C8 stationary phase was successively injected with a sample mixture containing peptides and small proteins. An acetonitrile/aqueous trifluoroacetic acid mobile phase gradient and a temperature of 60 °C were used for this study, with the results shown in Figure 13. After 362 sample injections and gradient separations with a mobile phase of 9,000 total column volumes, no change in retention times or peak widths were seen between the first and injection 362, when the test was arbitrarily terminated. The stability of the C8 stationary phase was expected since the phase was created with a sterically-protected silane which has demonstrated superior stability in aggressive acidic conditions at elevated temperatures [27]. The results in Figure 13 also show no change in the properties of the wide-pore fused-core silica particles for this test, suggesting good stability of this material in conditions that are often used for separating peptides and proteins. Other tests have shown that the wide-pore particles are stable without change to operating pressures at least to 600 bar.
Figure 13.
Fuse-core column stability
Column: 2.1 × 100 mm; Particles: 2.7 μm 400 Å - C8; Mobile phase - A: water/aqueous 0.1% trifluoroacetic acid; B: 70% acetonitrile/ 30% aqueous 0.1% trifluoroacetic acid; Gradient: 9 to 55% B in 10 min; Flow rate: 0.5 mL/min; Temperature: 60 °C; Injection: 1 μL; Instrument: Shimadzu Prominence; Detection: 220 nm
Peak widths measured at half-height for selected compounds (min). Peak identities as stated in Figure 6.
3.9 Application of wide-pore particles for large proteins
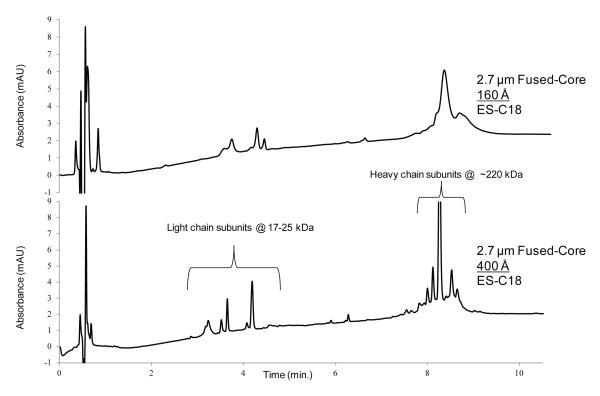
The particles of this study with 400 Å pores allow the separation of large proteins, as previously noted. The protein myosin is composed of heavy and light chain subunits. In a non-native environment, protein-protein interactions can be altered to release the non-covalent sub-units. Variants and impurities present in the original sample form a complex mixture for separations. When fully elongated, this protein has a length of about 150 nm, making it difficult to diffuse into the porous structures of most chromatographic particles. However, when myosin is non-native-configured, as takes place in an acetonitrile/aqueous trifluoroacetic acid mobile phase, the protein dissociates into several sub-units with accompanying variants. These sub-units then can be separated with the 400 Å particles of this study, as shown in Figure 14. The heavy sub-units eluting at about 8 min. show a main component of about 220 kDa with several minor variations and impurities at least partially separated [28]. The light sub-units eluting at about 4 min. are components of about 17-25 kDa, including sample impurities. The (non-optimized) gradient separation of this complex mixture required less than 10 min. separation time. Identification of the heavy and light sub-units was verified by gel electrophoresis of the collected and lyophilized fractions obtained during the chromatographic separation of the myosin sample.
Figure 14.
Effect of pore size on separation of myosin
Columns: 2.1 × 100 mm as shown; Temperature: 80°C; Mobile phase; A = water/0.1% trifluoroacetic acid; B = acetonitrile/0.1% trifluoroacetic acid; Gradient: 35 – 65% B in 15 min.; Flow rate: 0.45 mL/min; Detection: 215 nm; Injection: 1 μL; Instrument: Agilent 1200 SL.
4. Conclusions
The wide pore fused-core particles of this study can be used successfully for efficiently separating large proteins up to at least 400 kDa, depending on molecular configuration. Particles with smaller pores demonstrate restricted diffusion and much broader, less efficient peaks, when the pores are too small to allow unrestricted access of the solutes. The superficially porous structure of these particles allows favorable kinetics so that superior separations can be performed, compared to conventional fully porous particles. Columns of 2.7 μm particles with a 0.35 μm shell and 3.4 μm particles with a 0.2 μm shell both have attractive characteristics for separating proteins. Our studies suggest that columns of the larger particles may be more efficient, perhaps because of the ability to obtain more homogeneous packed beds. However, particles with a thicker porous shell allow a higher mass loading before losing separation efficiency. Stationary phases containing C4, C8 and C18 ligands have been tested. While all appear useful for separating proteins, limited data suggests that the C4 and C8 phases lead to better separations for some protein mixtures. Superior peak shapes for model proteins were found with acetonitrile/trifluoroacetic acid mobile phases, with acetonitrile/formic acid with ammonium formate also producing good peak shapes. As predicted by theory, column performance decreases with increased protein molecular size. However, wide pore fused-core columns still allow rapid high-efficiency separations of proteins because of superior mass transfer properties. Excellent stability of columns with the wide pore particles when using an acetonitrile/aqueous trifluoroacetic acid mobile phase was demonstrated.
Highlights.
New 400 Å pore size particles separate large proteins without restricted diffusion.
Particles with larger surface areas allow greater sample mass loading.
Particles with thinner shells show higher efficiency for proteins.
New wide pore SPP silica particles demonstrate excellent stability.
Particles with C4 and C8 stationary phases appear superior for some protein separations.
Acknowledgements
Partial support of this project by the NIH with SBIR grant GM099355 is gratefully acknowledged. Fused-Core and HALO are registered trademarks of Advanced Materials Technology, Inc.
Footnotes
Publisher's Disclaimer: This is a PDF file of an unedited manuscript that has been accepted for publication. As a service to our customers we are providing this early version of the manuscript. The manuscript will undergo copyediting, typesetting, and review of the resulting proof before it is published in its final citable form. Please note that during the production process errors may be discovered which could affect the content, and all legal disclaimers that apply to the journal pertain.
References
- [1].Kirkland JJ, Langlois TJ, DeStefano JJ. Amer. Lab. 2007;39:18. [Google Scholar]
- [2].DeStefano JJ, Langlois TJ, Kirkland JJ. J. Chromatogr. Sci. 2008;46:254. doi: 10.1093/chromsci/46.3.254. [DOI] [PubMed] [Google Scholar]
- [3].Fekete S, Fekete J, Ganzler K. J. Pharm. Biomed. Anal. 2009;50:703. doi: 10.1016/j.jpba.2009.05.039. [DOI] [PubMed] [Google Scholar]
- [4].Song W, Pabbisetty D, Groeber EA, Steenwyk RC, Fast DW. J. Pharm. Biomed. Anal. 2009;50:491. doi: 10.1016/j.jpba.2009.05.011. [DOI] [PubMed] [Google Scholar]
- [5].Yang P, McCabe T, Pursch M. J. Sep. Sci. 2011;34:2975. doi: 10.1002/jssc.201100530. [DOI] [PubMed] [Google Scholar]
- [6].Guiochon G, Gritti F. J. Chromatogr. A. 2011;1218:1915. doi: 10.1016/j.chroma.2011.01.080. [DOI] [PubMed] [Google Scholar]
- [7].Baker JS, Vinci JC, Moore AD, Colón LA. J. Sep. Sci. 2010;33:2547. doi: 10.1002/jssc.201000251. [DOI] [PubMed] [Google Scholar]
- [8].Kirkland JJ. Anal. Chem. 1992;64:1239. [Google Scholar]
- [9].Marchetti N, Cavazzini A, Gritti F, Guiochon G. J. Chromatogr. A. 2007;1163:203. doi: 10.1016/j.chroma.2007.06.046. [DOI] [PubMed] [Google Scholar]
- [10].Kirkland JJ, Truszkowski FA, Dilks CH, Jr., Engel GS. J. Chromatogr. A. 2000;809:3. doi: 10.1016/s0021-9673(00)00392-7. [DOI] [PubMed] [Google Scholar]
- [11].Schuster SA, Boyes BE, Wagner BM, Kirkland JJ. J. Chromatogr. A. 2012;1228:232. doi: 10.1016/j.chroma.2011.07.082. [DOI] [PMC free article] [PubMed] [Google Scholar]
- [12].Fekete S, Berky R, Fekete J, Veuthey J-L, Guillarme D. J. Chromatogr. A. 2012;1236:177. doi: 10.1016/j.chroma.2012.03.018. [DOI] [PubMed] [Google Scholar]
- [13].Snyder LR, Kirkland JJ, Dolan JW. Introduction to Modern Liquid Chromatography. 3rd ed John Wiley; Hoboken, NJ: 2010. Chap. 2. [Google Scholar]
- [14].Knox JH. In: Advances in Chromatography. Brown PR, Grushka E, editors. Vol. 38. Dekker; New York: 1998. p. 1. [Google Scholar]
- [15].Gritti F, Guiochon G. J. Chromatogr. A. 2012;1221:2. doi: 10.1016/j.chroma.2011.04.058. [DOI] [PubMed] [Google Scholar]
- [16].Fekete S. PhD dissertation. Budapest University of Technology and Economics, Department of Inorganic and Analytical Chemistry; Budapest: 2011. [Google Scholar]
- [17].Schuster SA, Wagner BM, Boyes BE, Kirkland JJ. 38th International Symposium on High Performance Liquid Phase Chromatography and Related Techniques; Anaheim, CA USA. June 16-18; L-01-04. [Google Scholar]
- [18].Farkas T, Sanchez AC, Chitty M, Anspach J, Layne J. 38th International Symposium on High Performance Liquid Phase Chromatography and Related Techniques; Anaheim, CA USA. June 16-18; L-01-14. [Google Scholar]
- [19].Liu X, Zhou D, Szabelski P, Guiochon G. Anal. Chem. 2003;75:3999. doi: 10.1021/ac0205964. [DOI] [PubMed] [Google Scholar]
- [20].Glajch JL, Kirkland JJ. 4,847,159 U.S. Pat. 1989 Jul 11;
- [21].Snyder LR, Kirkland JJ, Dolan JW. Introduction to Modern Liquid Chromatography. 3rd ed John Wiley; Hoboken, NJ: 2010. Chapt. 5. [Google Scholar]
- [22].Boyes BE, Walker DG. J. Chromatogr. A. 1995;691:337. [Google Scholar]
- [23].Welinder BS. J. Chromatogr. A. 1991;542:83. doi: 10.1016/s0021-9673(01)88750-1. [DOI] [PubMed] [Google Scholar]
- [24].Nugent KD, Burton WG, Slattery TK, Johnson BF, Snyder LR. J. Chromatogr. A. 1988;488:381. doi: 10.1016/s0021-9673(00)94809-x. [DOI] [PubMed] [Google Scholar]
- [25].Farnan D, Frey DD, Horvath C. Biotech. Prog. 1997;13:429. doi: 10.1021/bp970044k. [DOI] [PubMed] [Google Scholar]
- [26].Johnson D, Boyes B, Fields T, Kopin R, Orlando R. J. Biomol. Tech. 2012 doi: 10.7171/jbt.13-2402-003. in press. [DOI] [PMC free article] [PubMed] [Google Scholar]
- [27].Kirkland JJ, Glajch JL, Farlee RD. Anal. Chem. 1989;61:2. [Google Scholar]
- [28].Neverova I, Van Eyk JE. Proteomics. 2002;2:22. [PubMed] [Google Scholar]


