

Abstract
A quartz crystal microbalance (QCM) immunosensor has been successfully employed to screen for both whole Mycobacteria tuberculosis (Mtb) bacilli and a Mtb surface antigen, lipoarabinomannan (LAM). One of the most abundant components of the Mtb cell surface, LAM, may be detected without the presence of the entire bacterium. Using available antibodies with proven utility in enzyme-linked immunoassays (ELISAs), a sensor was designed to measure Mtb bacilli and LAM. Equilibrium association constants (Ka) were determined for the interaction of Mtb with immobilized α-LAM and anti-H37Rv antibodies, where avidity was seen to strengthen this interaction and provide for greater binding than might have otherwise been achieved. The binding of LAM to immobilized α-LAM had a high associate rate constant (ka) allowing for rapid detection. Evaluating these binding constants helped the compare the sensitivity of these immunosensors to conventional ELISAs. The use of these assays with the better antibodies may allow for immunosensor use in determining LAM as a point-of-care (POC) diagnostic for Mtb.
Keywords: Quartz Crystal Microbalance, Lipoarabinomannan, Mycobacterium tuberculosis, immunosensor, Langmuir isotherm, equilibrium association constant, steric hindrance effects, kinetic analysis, antibody adsorption
1. Introduction
Mycobacterium tuberculosis (Mtb) currently affects one third of the world population, or about 2 billion people and is a leading health concern.[1] One out of every ten people develop active Mtb in their lifetime and then infect, on average, 10–15 people a year.[1] The development of easy to use, affordable, portable, sensitive, and specific point-of-care diagnostics for tuberculosis is a critical unmet need in developing nations. Current techniques for diagnosing Mtb, such as sputum smear microscopy, the current gold standard in Mtb detection, lack the sensitivity needed to properly diagnose Mtb at the POC.[2, 3] Other approaches also lack sensitivity,[4] are too expensive,[4–7] and require highly skilled personnel[8] as well as substantial time.[9, 10] New diagnostic assays would enable rapid diagnosis and treatment, therefore, lowering the extent of Mtb transmission and provide for earlier determination of vaccine efficacy. [11] An immunosensor based on the QCM meets these requirements and has been used as a platform for diagnostic immunoassays.[12–14] These assays can be adapted for use with antibodies to multi-drug resistant and extremely-drug resistant tuberculosis, reducing the time it takes to develop diagnostics for new strains of tuberculosis. Since current analytical techniques have not sufficiently demonstrated, practicality for use at the POC, the use of the QCM to detect Mtb bacilli and antigens will be assessed as a competing technology.
The QCM has proven useful for the detection of various biological species, particularly in the examination of bacteria, with both whole cells and antigenic components of cells studied.[14–19] These detection systems function in complex environments such as serum,[20] agar,[21, 22] milk, [23] and sputum[24] without the need for labeling, which can impose additional time and cost demands.[25] Detection of whole tuberculosis cells with the QCM has been studied previously, but without rapid analysis.[24, 26] Real-time analysis allows for continuous monitoring of binding events and determination of kinetic constants[27] which can be used to determine whether a system is specific and sensitive enough to be used at the POC. Piezoelectric devices, such as the QCM, have been used routinely to determine equilibrium constants for small molecules and proteins in real-time and would therefore be useful for evaluating sensors prior to introduction at the POC.[28–31]
Since detection with the QCM occurs in a process that is normally less than twenty minutes, kinetic data can be gathered and used to determine the binding affinities of each immunosensor. The stronger the attachment that occurs between antigens and antibodies, the lower the limit of detection and the greater the confidence will be in clinical settings. A complete description and references for the mathematics required in calculation of these constants is included in supplemental information (Eqs. S-1 through S-7). Briefly, the Langmuir isotherm can be used to extrapolate Δmmax since it asymptotically approaches Δmmax, but this requires making approximations (Eq. 1).
| (1) |
For a more precise calculation of these constants, a rearrangement of the equation for Langmuir adsorption isotherms was used to calculate maximum change in mass (Δmmax) and equilibrium association constants (Ka) (Eq. 2). [32–34]
| (2) |
The association rate constants (ka and kd) were determined as described in supplemental equations S-8 through S-14.
Previous Mtb diagnostic research included the detection of tuberculosis cells, as well as the study of a component of the cell wall, LAM.[35] LAM detection could help diagnose individuals with active pulmonary disease in situations where tests utilizing the detection of whole Mtb bacilli might fail.[4, 9, 36] Therefore, LAM is of great interest and is an ideal target for POC detection due to its extracellular position[37] and prevalence in exhaled breath, which allows for a minimally invasive detection method. Furthermore, antibodies can be developed with high specificity for each mycobacterial strain and adapted as diagnostics are improved.[38] In this study, immunosensors utilizing α-LAM and anti-H37Rv antibodies have been developed to detect both whole Mtb cells and LAM. The ability to quantify the amount of LAM in various biological fluids will help in the understanding of its particular role in immune system evasion, as well as to gauge the infectivity of individual patients.
2. Experimental
2.1 Proteins, Cells and Chemicals
CS-40 anti-H37Rv LAM mouse monoclonal antibody (IgG1), α-LAM anti-H37Rv LAM rabbit polyclonal antibody (α-LAM), anti-H37Rv whole cell live infection guinea pig polyclonal antibody (anti-H37Rv), H37Rv-strain, γ-irradiated Mtb whole cells (8.7×10¹¹ bacterial cells per 1 gram of wet weight, Mtb),[39] and manLAM (from M. tuberculosis H37Rv, MW ~35 kDa, LAM)[40] were received as part of NIH, NIAID Contract No. HHSN266200400091C, entitled “Tuberculosis Vaccine Testing and Research Materials,” which was awarded to Colorado State University, Fort Collins, CO. These samples can now be obtained through Biodefense and Emerging Infections Research Resources Repository (BEI Resources). Protein A (46,762 kDa) from Staphylococcus aureus and Protein L (35,800 kDa) from Escherichia coli were purchased from Pierce. Bovine serum albumin (BSA, 66,000 kDa), Tween® 20, tetramethylbenzidine (TMB), goat anti-rabbit IgG, and goat anti-guinea pig IgG peroxidase conjugated antibodies were purchased from Sigma Aldrich Inc. Water was purified using a Barnstead NANOpure Diamond water purification system (~18 MΩ/cm). Phosphate buffer saline (PBS) was prepared as 50 mM phosphate with 150 mM NaCl at pH 7.2, unless noted otherwise. Acetate buffer (Ace) was prepared as 100 mM acetate with 150 mM saline at pH 4.5. Carbonate buffer (CB) was prepared as 50 mM carbonate at pH 9.6. Piranha was prepared fresh as 3 parts concentrated H2SO4:1 part H2O2 (30%). All salts and hydrogen peroxide were purchased from Fisher Scientific, while sulfuric acid was purchased from EMD Chemicals Inc.
2.2 Quartz Crystal Microbalance
Gravimetric analysis was performed with a Maxtek Research QCM. Ti/Au coated 5 MHz quartz crystals (Maxtek Inc.) were mounted in a Kynar crystal holder to allow flow via a Masterflex peristaltic pump. Flow rate was maintained at a speed of 30 μL/min. With a 100 μL chamber volume, this flow rate refreshes the cell volume every 3 minutes which lessens the effects of mass transport, but still allows for high sensitivity and quick detection.[13, 41] The crystals were cleaned three times prior to every experiment with piranha, H2O, and EtOH and then dried with a stream of N2 (g). Maxtek software records changes in frequency and resistance, which are used to determine change in mass while accounting for changes in rigidity. The liquid environment intrinsically introduces mechanical softening and stiffening based on the viscosity of the solution. Calculating the changes in resistance along with the normal frequency measurements collected allows for calculations of mass load that account for these changes in viscosity.[13] A calibration with sucrose was used to correct for changes that occur in density and viscosity similar to corrections previously reported.[33] The resulting equation used to calculate mass load incorporating this correction factor is based on the original linear relationship developed by Sauerbrey in 1959 (Eq. 3).[42]
| (3) |
In this equation, Δm is the change in mass (μg), Δf is the change in frequency (Hz), s is the sucrose correction factor (−2.2 Hz/Ω), ΔR is the change in resistance (Ω), Cf is the known sensitivity factor of a 5 MHz crystal (56.6 Hz cm2 μg−1), and A is the overlapping area of the contact electrode (0.342 cm2).[33, 43]
2.3 Immunosensor Assembly
Binding recognition with the QCM was achieved through the selectivity of antibodies bound to the surface of the gold crystal, similar to previously described methods.[33] The formation of immunosensors was achieved with adsorption of Protein A (200 μg/mL in a 50/50 mix of PBS/Ace, pH 5.4 near the isoelectric point of Protein A as pH 7.0 resulted in no binding) to the gold QCM surface.[44, 45] Next, BSA in PBS was used to block any non-specific interactions that might occur between the gold substrate and the antibodies or antigens.[46] Then the immunorecognition portion of the sensor bound with Protein A through hydrophobic interactions, either α-LAM (used at 1:1000 dilution in PBS) or anti-H37Rv (used at 1:1000 dilution in PBS).[47, 48] It was determined that 1:1000 dilution achieved a sufficiently high surface coverage and binding efficiency as compared to other concentrations. The lower dilution values of 1:10 and 1:100 would have used more solution than was available for experimental use through the NIAID materials contract. Comparing 1:1000 dilution with 1:500, we measured 110 ± 69 ng as compared to 143 ± 27 ng respectively. Using a t-test at a 95% confidence level, there was no statistically significant difference between these two dilutions. We used 50% less antibody and saw only a 25% reduction in binding. We then tried a 1:10,000 dilution and saw minimal binding. Binding efficiency is the percentage of the solution that binds to the sensor surface as opposed to the net coverage of the sensor surface. A high surface coverage was desirable as the more antibodies on the surface translate to more binding of the antigen, to a point where steric effects limit binding at higher concentrations. A high binding efficiency was needed to prevent waste of unbound antibodies. Maximizing between these two variables, we determined the 1:1000 dilution to have high efficiencies in both these areas, where lower dilutions had greater binding efficiency but minimal surface coverage. Similarly, Protein L (71.6 μg/mL in 50/50 mix of PBS/Ace, pH 5.4) bound CS-40 (1:20 dilution in PBS) through kappa light chain interactions.[49] PBS was used between each protein to wash away any free or weakly bound molecules from the crystal face. The combination of these three proteins creates an immuno-selective layer capable of binding tuberculosis cells and LAM (Figure 1). In order to characterize the immunosensors, the strength of the interactions between the antibodies and Mtb or LAM was measured using Langmuir adsorption isotherms. These studies examined the kinetics of the binding between the antibodies, α-LAM or anti-H37Rv, and Mtb or LAM. The immunosensors were exposed to inactivated tuberculosis cells at concentrations ranging from 8.7×10⁴ to 8.7×10⁷ cells/mL. The α-LAM immunosensor was exposed to LAM at concentrations ranging from 2 to 10 μg/mL. Because of limited availability and low dilution (1:10) requirements for study of CS-40, its use was restricted to binding studies with LAM at a concentration of 10 μg/mL.
Figure 1.
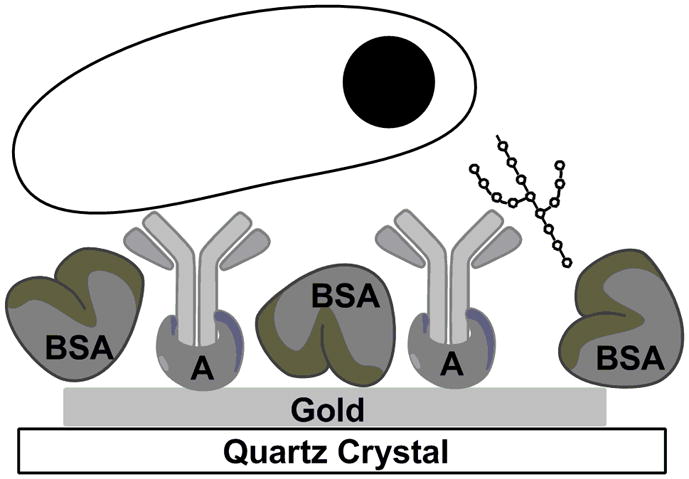
Cartoon depiction of protein A attachment to gold and binding to the Fc region of a bivalent antibody. The antibody is binding to LAM on the right, and tuberculosis on the left (not to scale). BSA was used to block the bare surface of the gold.
2.4 Enzyme-linked immunosorbent assay (ELISA)
ELISAs similar to those developed previously by Hamasur et al. were developed for LAM and Mtb detection.[9] Other ELISA based systems used to detect LAM were also consulted.[9, 10, 40, 50] Briefly, 100 μL of antigen, either LAM or Mtb was plated in Immulon 2HB microplates (Fisher Scientific) in carbonate buffer at varying concentrations. The wells were incubated for 1 hour and washed with PBST (PBS with 0.05% Tween® 20). The wells were sequentially incubated for 1 hour with BSA (300 μL, 1 mg/mL), α-LAM or anti-H37Rv (100 μL, 1:1000), and the appropriate peroxidase conjugated secondary antibody (either goat anti-rabbit IgG or goat anti-guinea pig IgG) based on the species that the primary antibody was raised in (100 μL, 1:5000), washing with PBST between steps. Finally, TMB was added to each well (100 μL) as a substrate for the peroxidase conjugated antibody in order to initiate a color change. After five minutes, the reaction was halted with 2 M H2SO4, and the plates were read at 450 nm (BioTek Synergy HT plate reader). The limits of detection for tuberculosis cells and for LAM determined using ELISAs were compared to the limits of detection using a QCM.
3. Results and Discussion
The development of a rapid, real-time sensor for the detection of Mtb and LAM that can be used at the POC will enable rapid diagnosis and treatment, thus reducing the spread of the disease. The benefit of a reusable QCM immunosensor is in low resource environments or in animal and patient care facilities to continuously monitor for Mtb and its antigens environmentally. The QCM successfully measured the adsorption of Mtb and LAM in less than 20 minutes. Monitoring mass changes as the different immunosensor layers are introduced to the crystal allows control to be maintained over the depositions in terms of the absolute mass of each layer. Real-time detection throughout the development of the entire immunosensor can be achieved (Figure 2A). In this example, Protein A (253 ng) adsorbed onto the gold substrate first, followed by BSA (10 ng) and α-LAM (51 ng). Detection of Mtb was seen by the increase of 12 ng immediately following its introduction to the immunosensor. Similar to kinetic measurements taken using surface plasmon resonance, the collected data has curvature indicative of Langmuirian association and disassociation. These curves are common indicators of binding, and demonstrate the measurable on and off rates of binding until equilibrium is reached, and the curve levels off. After switching to running buffer, any weakly adsorbed molecules will disassociate as indicated by mass loss. A similar study was conducted utilizing anti-H37Rv (Figure 2B).
Figure 2.


Real-time detection of Mtb (8.7×10⁶ cells/mL) with rabbit polyclonal antibody α-LAM (A) and with guinea pig polyclonal antibody anti-H37Rv (B). PBS flow is indicated by the shaded region. Steps 1–3 depict the building of the sensing layers and step 4 depicts the detection of Mtb. The total mass detected in each step is as follows: (A-1) 253 ng protein A (A-2) 10 ng BSA (A-3) 51 ng α-LAM (A-4) 12 ng Mtb (B-1) 207 ng protein A (B-2) 26 ng BSA (B-3) 130 ng anti-H37Rv (B-4) 9 ng Mtb.
The assembly of the immunosensor for antigen detection was kept as uniform as possible for all cell concentrations. Typical variation in a single run was ± 1 ng, but run to run variability was much higher. Protein A and antibody concentrations remained constant for the creation of the immunosensor, but maximum binding did vary slightly between runs; Protein A, x̄ = 258 ± 84 ng, BSA, x̄ = 27 ± 20 ng, α-LAM, x̄ = 52 ± 21 ng and anti-H37Rv, x̄ = 96 ± 38 ng. The deviation of how much antibody could pack onto the surface of the crystal was dependent on more than simply the amount of Protein A already on the crystal. For example, the ratio of moles of Protein A to moles anti-H37Rv was 10.0(±5.0):1 and the ratio of moles of Protein A to moles α-LAM was 19.4(±10.1):1. This means that there was an approximate variance of 50% in the amount of antibody bound to the sensor resulting from surface roughness, protein A clustering, and the overall topography.” The variation could be due to the different orientations of the proteins on the surface of the gold.[51] Protein A can bind directly to the gold in any orientation, while the antibodies are restricted to sites occupied by Protein A.
The QCM immunosensors were able to detect Mtb at concentrations as low as 8.7×10⁵ cells/mL with α-LAM and 8.7×10⁶ cells/mL with anti-H37Rv. The average change in mass for each concentration is seen after introduction of Mtb using (A) an α-LAM immunosensor and (B) an anti-H37Rv immunosensor (Figure 3). The detection of Mtb with the anti-H37Rv immunosensor occurs linearly as would be expected. Examining the average binding curves for the detection of Mtb with the α-LAM immunosensor, one would notice the greatest change of mass occurs with a cell concentration of 4.8×10⁷ cells/mL instead of with a concentration of 8.7×10⁷ cells/mL. There are two hypotheses that could explain this behavior. First, at higher concentrations steric effects dominate, preventing increased binding. Second, a greater number of antibodies could have bound to Protein A for the lower concentration compared with the higher concentration, thus increasing the number of possible binding sites. Comparison of the average amount of bound α-LAM for each cell density proves the second hypothesis is invalid. The average amount of α-LAM that bound for Mtb (4.8×10⁷ cells/mL) was 43 ± 22 ng, while for Mtb (8.7×10⁷ cells/mL) the average antibody binding measured was 56 ± 5 ng. Therefore, the greater detection was actually achieved with a lower average amount of antibody present on the surface of the crystal.
Figure 3.


Average detection of varying concentrations of Mtb with (A) α-LAM antibodies (1:1000) and (B) anti-H37Rv antibodies (1:1000).
The QCM is often used to assess binding constants without considering the interactions occurring between the molecules adsorbed to the crystal face. In some instances, multi-layers can be assumed to have formed while at other times, only partial surface coverage is achieved. To determine why and how layers form, it is beneficial to examine the size and shape of the adsorbed molecules. Mathematically, one can hypothesize possible surface orientations and therefore determine how each molecule might inhibit the binding of lateral molecules on the quartz crystal. Possible orientations of each layer on the surface of the crystal must be examined.
Protein A (46 kDa) is a spherical, globular protein with a reported radius of 1.03 nm.[52, 53] Mathematically, the number of proteins that can pack together on the sensitive area of the crystal (0.342 cm2) is dependent on the size of the protein and on the packing density. Multiplying by the molecular weight of Protein A yields the change in mass (784 ng) that can be attained for this surface with no space between molecules. If it is assumed that the maximum monolayer surface coverage by this spherical protein could take a face-centered packing lattice, then the protein could maximally pack at 74% efficiency as has been determined using the Kepler conjecture.[54] At 74% packing efficiency, the change in mass would instead be 588 ng. With an average Protein A binding of 258 ± 84 ng, this translates to a surface coverage of 44 ± 14%.
BSA is a protein with a cardioid shape whose radius and dimensions have received much scrutiny with reported radii ranging from 3.3–4.5 nm.[55–61] The representation of BSA with spherical calculations would fail to consider the possible orientations with which BSA can adsorb. Rezwan et al. have suggested an adsorption model based on zeta potential and UV-Vis measurements.[62] They presented a “side-on” model calculating surface coverage from the smaller axis (223 ng/cm2) and “end-on” models calculated from the larger axis (365 ng/cm2). Using these models, maximum adsorption for a monolayer of BSA on the quartz crystal would be in the range of 76–125 ng. With an average BSA adsorption of 27 ± 20 ng, the QCM crystal is most likely covered with molecules in both conformations and the surface coverage of BSA is in the range of 36 ± 26 to 22 ± 16% covered with BSA. Analyzing the possible conformations of BSA and Protein A helps demonstrate why there is such variation between runs and how 100% of the surface could be covered with completely different ratios of Protein A and BSA. Future studies should incorporate the use of pegylated thiols or any smaller blocking agent to ensure greater surface coverage and to prevent and non-specific binding and steric hindrances that might arise. Sea block, casein and octanethiol were all used as blocking agents, but similar non-specific binding to BSA precluded their continued use.
IgG antibodies can adsorb onto a surface in multiple orientations due to the y-shape formed from the Fc and Fab regions of the protein. Protein A binds to the Fc region of the antibodies used in this study, which eliminates many orientations of adsorption leaving only rotations that occur along the radius of gyration (Rg, Figure S-1). There are many ways to mathematically represent the possible orientations that IgG molecules could assume while bound to Protein A. Literature reports the dimensions of IgG antibodies as follows (Figure S-1): Fab-Fab (14.2 nm)[63], height (11.5, 14.0 nm)[64], Fc-Fab (13.6 nm)[65], Fc (0.91[53], 3.8[63] nm), Rg (6,[60] 5.5[66], 5.6[67] nm), a (8.5 nm)[63], b (4.5 nm)[63], c*d*e (7×5×4 nm)[63], x-y-z (8.3-7.3-7.9 nm)[68]. This study uses these reported dimensions in the comparison of two probable IgG representations, a spherical and an elliptical representation, in order to calculate packing efficiency and steric hindrance. The first model calculates steric effects using a spherical representation with an average of reported Rg values, 5.7 nm, for various IgGs. This model assumes that the molecules will pack in such a way that each molecule will sterically hinder neighboring molecules and prevent them from being closer than their Rg would allow. The second model utilizes an elliptical representation. With an elliptical representation, the molecules could pack more densely, but this could only take place if the molecules were oriented with their Fab regions parallel to each other. From this information, a spherical representation, assuming a 75% packing efficiency, would allows for a maximum mass change for a monolayer of IgG antibody to be 87 ng. Basing the calculations on an elliptical shape using the average of d and b for the width, and Fab-Fab for the length, and 75% packing efficiency yields a maximum monolayer formation of 159 ng. Using the spherical model, the Protein A/BSA layer would therefore be 60 ± 24% covered with α-LAM or 110 ± 44% covered with anti-H37Rv. Comparatively, the binding detected translates to 33 ± 13% surface coverage using the elliptical model with α-LAM and 60 ± 24% with anti-H37Rv. The actual surface coverage of IgG antibodies relies on random orientation within any of the four Protein A binding pockets and therefore could pack with the Fab regions parallel or perpendicular to each other resulting in a mixture of orientations. The more ordered the packing, the more antibodies that can be present on the sensor, increasing the number of binding sites possible for antigen detection.
Coverage by Mtb could also be represented by an ellipse with a width of 0.44 μm and a length of 3 μm.[69] This would yield a maximum theoretical surface coverage of 1.88 μg, which translates to an experimental surface coverage of 1.3% using the maximum detection of Mtb cells. Considering the binding that occurs spatially, when the Mtb cells lay on the immunosensor, they could physically make contact with 1.9×10⁴ IgG molecules based on the elliptical model of IgG molecules described previously. When one antibody binds a cell, the orientation of the remaining epitopes on the cell will only bind if the spacing between antibodies and epitopes match perfectly. Imperfect matching leads to strained or weakened bonds that would lessen the affinity of the sensor for the cell versus a sensor with complimentary spacing of IgG. However, the imperfect matches would still be stronger than singular attachment mechanisms. Based upon the amounts of antibodies and cells detected, enough antibodies were present to saturate the surface of the cell, but it is not likely that every antibody in the immunosensor was able to bind to an epitope on the cell surface. It is believed that the low percentage of surface coverage by Mtb is indicative of steric hindrances due to the spatial orientation of epitopes on the cell as compared with the spatial orientation of the IgG molecules in the immunosensor. This contributes more to Mtb surface coverage than the added strength that would come from multiple antibody attachments.
In order for a reaction to be energetically favorable, the association kinetic rate constant must be larger than the dissociation rate constant. Immobilized interactions on the quartz crystal versus interactions in solution do not have statistically different kinetics.[70] QCM measurements make it possible to observe on and off rates of binding directly in rapid succession, and allow the affinity constants to be determined for each antibody-based sensor by examining the binding at multiple antigen concentrations. Since the Langmuir isotherm is a good fit to the Mtb binding curves with α-LAM and anti-H37Rv, it is expected that the affinity coefficients would have little error in their values (Figure 4). Ka and maximum change in mass (Δmmax) for the interaction of Mtb with both antibodies (α-LAM and anti-H37Rv) were determined (Eq. 2). The Δmmax for the interaction of α-LAM to Mtb was 23±1 ng and for the interaction of anti-H37Rv to Mtb was 14±1 ng. The interactions are energetically favorable and the affinity of the antibodies to Mtb is high. The Ka for both relationships was much higher than expected for antibody-antigen interactions (Table 1).[71] The attachment of multiple antibodies would strengthen the Ka of Mtb to the immunosensor, and the dissociation would be dictated by the mass of the cell as well as the strength and number of antibodies which attach the cell to the QCM crystal.[72] The high Ka demonstrates the avidity occurring from multiple antibodies binding per cell on the QCM surface.
Figure 4.

Rectangular hyperbolic fits of Mtb binding with α-LAM (black) and with anti-H37Rv (grey) to the Langmuir isotherm obtained using their respective Δmmax and Ka (Eq. 2). (R2=0.99 for both α-LAM and anti-H37Rv)
Table 1.
Equilibrium association constants determined for the interaction of Mtb with either α-LAM or anti-H37Rv antibodies.
| Δmmax (ng) | Ka (M−1) | |
|---|---|---|
| αLAM to Mtb | 23 ± 1 | 3.1 ± 2.4 (×1014) |
| anti-H37Rv to Mtb | 14 ± 1 | 4.4 ± 1.2 (×1013) |
The QCM detection of LAM was achieved in a manner similar to the attenuated or weakened Mtb cells. Real-time detection of LAM at varying concentrations with α-LAM was achieved at a pH of 7.0 and 7.2. Statistical analysis was performed, and it was determined that there was no difference between detection achieved with the immunosensors at the differing pHs. Even though it was thought that the change in pH might change the protein surface charges and therefore packing efficiency, this study appears to support previous findings which found that the adsorption behavior of proteins was independent of pH in the range of 6.5–7.5 at high ionic strength.[73] Although LAM is not a protein, this rule appeared to hold true for adsorption based on the average moles of LAM detected. Detection of LAM was demonstrated (Figure 5), and the kinetics of the combined data sets at pH 7.0 and 7.2 were examined. The Ka for the detection of LAM with α-LAM is in the range expected for antibody antigen interactions, from 106–1010 M−1.[71] Unlike Mtb, whose Ka was increased due to avidity, LAM is a small molecule and interaction with α-LAM would be one-to-one and would therefore be expected to fit in this range. Since LAM was a one-to-one interaction, association and disassociation rate constants were additionally measured (ka and kd respectively, Table 2). High association rate constants were also observed which explains the sharp binding curve measured with the QCM. The significantly lower dissociation rate explains why the saturated antigen layer would have slow dissociation from the sensor surface. The amount of LAM that bound was Δmmax=9.4 ±1.4 ng based on 40 experiments at different concentrations and this variation could be due to the heterogeneity in LAM size, 1–2 nm wide and 5–10 nm in length, as well as the pooled error that arises from the compilation of data from differing pHs. Based on mathematical approximations of the size and shape of LAM, 47 ng could bind to the surface of the QCM immunosensor before encountering complete steric hindrance.[69] The average amount of LAM that bound to the surface of the QCM (10 ng) is equivalent to a surface coverage of 21%. Comparing the average moles of α-LAM that bound with the average moles of LAM detected, a ratio of approximately 1:1 is calculated, and therefore it appears that the amount of LAM that binds is limited by the amount of antibody bound to the sensor. Detection was experimentally confirmed at a concentration as low as 60.6 nM. Furthermore, sensor reusability was confirmed through the binding of Mtb followed by the binding of LAM (Figure S-2).
Figure 5.

Real-time detection of LAM (8 μg/mL). The total mass detected in each step is as follows: (1) 131 ng protein A (2) 39 ng BSA (3) 61 ng α-LAM (4) 12 ng LAM.
Table 2.
Equilibrium association and rate constants for the interaction of LAM with α-LAM antibodies, where the affinity for the sensor surface was determined to be in the range for strong antibody-antigen interactions.
| Ka (M−1) | ka (M−1s−1) | kd (s−1) | |
|---|---|---|---|
| LAM | 1.3 ± 0.5 (×107) | 2.3 ± 1.5 (×106) | 0.7 ± 0.3 |
Three control experiments were performed: (1) immunosensor without the antibody testing for non-specific binding of Mtb and LAM, n=7; (2) complete immunosensor against the non-specific targets of LAM components mannose and arabinose and the Ebola virus glycoprotein, n=7; and (3) testing of BSA and its ability to block non-specific binding of LAM, n=2. There was no effective binding of any of these controls and the standard deviation of the baseline (sbl) did not change appreciably during exposure to the control (sc). The pooled standard deviation of all control experiments is reported here as sc:sbl to demonstrate the lack of change to the experimental baseline: (1) ± 2:3 ng, (2) ± 1:1 ng and (3) ± 1:1 ng.
Whole tuberculosis cells and LAM were detected with ELISA to corroborate the results attained using the developed QCM immunosensor. ELISA confirmed that the interaction of α-LAM and anti-H37Rv to Mtb increased with the concentration of cells present in the well plate (Figure S-3). The LOD was determined as the average background plus three times the average standard deviation. The LOD for the interaction of Mtb and α-LAM was calculated to be 1.5×10⁴ cells/mL, while the LOD for the interaction of Mtb with anti-H37Rv was calculated to be 1.3×10⁵ cells/mL. As mentioned previously, the LOD for the QCM immunosensors was 8.7×10⁵ cells/mL with α-LAM and 8.7×10⁶ cells/mL with anti-H37Rv, both one order of magnitude higher than the ELISA results.
There has been much discussion over the benefits of ELISA versus QCM. While ELISA is normally considered a gold standard, the QCM has been found to be more sensitive in some instances.[12] ELISA benefits from natural enzymatic signal amplification, while QCM is faster with real-time results relying on the densities of the adsorbed particles for signal amplification. The ELISA results utilized whole cells which were attached to the well plate first. Next, antibodies were allowed to attach to epitopes on the surface of the cell in any conformation. As stated previously, with QCM the antibodies were used as an immunosensor and thus more antibodies where sterically prevented from binding to the cells.[74] The LOD for ELISA was therefore improved through the increased enzymatic amplification that occurs with multiple attachments of antibodies that were not sterically hindered to the extent that they were within the QCM. The LOD for the interaction of α-LAM and LAM was determined to be 0.05 μM. The LOD achieved with the QCM for LAM was on the same order of magnitude (60 nM) than the LOD confirmed with ELISA (50 nM). This detection was possible even with the low surface coverage of antibodies present on the crystal.
Additional antibodies were briefly studied for the assessment of their usefulness in LAM detection using the QCM. Anti-H37Rv polyclonal antibodies were raised against whole Mtb cells in guinea pigs (CSU) and as such were found to have no binding affinity for LAM in both ELISA and QCM experiments. Binding of LAM (10 μg/mL) to CS-40 had an average binding in the QCM of 6 ± 2 ng. Kinetic analysis and ELISA detection of LAM with CS-40 were not possible considering the large quantity of CS-40 required and the limited quantity available. Direct analysis of exhaled breath samples from rhesus macaques was attempted to determine the presence of LAM, but non-specific binding in these samples was too high for discrimination by the immunosensors using these antibodies. Future experiments could incorporate higher affinity antibodies as they are generated to quickly adapt at the POC, including recently described LAM monoclonal antibodies.[38]
The simplicity of using the QCM for early detection of LAM and Mtb could have an immediate impact in clinical settings as antibodies are developed with higher affinity and selectivity. The sensitivity with which these immunosensors can detect non-processed bacilli and lipoarabinomannan renders them a potent tool in the fight against tuberculosis worldwide. The LAM immunosensor in particular would have a great advantage for use in environmental and clinical settings where its ability for detecting LAM in such small quantities in a non-invasive and timely manner could be utilized.
4. Conclusions
Tuberculosis whole cells were detected in a more sensitive and specific method than is currently available. The QCM was shown to be a valid method for detection of both Mtb whole cells and LAM. The association and dissociation of Mtb and LAM to the immunosensor surface was seen in less than twenty minutes through changes in frequency and resistance. This binding was analyzed to infer information about the kinetics governing the interactions. The average binding to α-LAM and anti-H37Rv at various concentrations was used to extrapolate equilibrium association constants and rate constants. These constants describe the strong affinity with which the immunosensor bound the antigens in the QCM while ELISA was used to affirm the interaction. Mathematical representations were used to describe possible orientations of the molecules on the surface of the QCM. The affects of steric hindrances on both surface coverage and binding affinities was examined. The α-LAM immunosensor has a strong affinity for LAM. Therefore, the α-LAM immunosensor has the most promise for use in POC settings.
Supplementary Material
Acknowledgments
This work was supported in part by NIH GM 076479 and from materials received as part of NIH, NIAID Contract No. HHSN266200400091C, entitled “Tuberculosis Vaccine Testing and Research Materials” which was awarded to Colorado State University. We thank Dr. Chad Roy from Tulane National Primate Research Center for his suggestions to study LAM as a possible antigen useful for diagnosis and for the donation of exhaled breath samples from Mtb infected rhesus macaques. L. A. Hiatt thanks Dr. R. Gerald Keil from the University of Dayton for QCM training during his time on sabbatical at Vanderbilt University.
Biographies
Leslie Hiatt received her B.S. in Biochemistry from Freed-Hardeman University in 2006 with a minor in mathematics. She has defended her PhD from Vanderbilt University in the Department of Chemistry which will be conferred in May of 2011. Her PhD project focused on the detection of tuberculosis using the Quartz Crystal Microbalance (QCM). She also worked to develop a microfluidic electrochemical assay for the detection of oxidative bursts from activated macrophages.
David Cliffel is an Associate Professor of Chemistry and an Adjunct Associate Professor of Pediatrics at Vanderbilt University. He received his PhD from the University of Texas at Austin in 1998 and then completed a post-doctoral assistantship at the University of North Carolina at Chapel Hill. The focus of his research group lies in the development of bioanalytical sensors, nanoparticle synthesis, multianalyte microphysiometry, and electrochemistry.
Footnotes
Publisher's Disclaimer: This is a PDF file of an unedited manuscript that has been accepted for publication. As a service to our customers we are providing this early version of the manuscript. The manuscript will undergo copyediting, typesetting, and review of the resulting proof before it is published in its final citable form. Please note that during the production process errors may be discovered which could affect the content, and all legal disclaimers that apply to the journal pertain.
References
- 1.Factsheet on Tuberculosis. World Health Organization; 2009. [accessed June 20, 2010]. http://www.who.int/tb. [Google Scholar]
- 2.Haldar S, Chakravorty S, Bhalla M, De Majumdar S, Tyagi JS. Simplified detection of Mycobacterium tuberculosis in sputum using smear microscopy and PCR with molecular beacons. J Med Microbiol. 2007;56:1356–1362. doi: 10.1099/jmm.0.47265-0. [DOI] [PubMed] [Google Scholar]
- 3.Chakravorty S, Dudeja M, Hanif M, Tyagi JS. Utility of universal sample processing methodology. combining smear microscopy, culture, and PCR, for diagnosis of pulmonary tuberculosis. J Clin Microbiol. 2005;43:2703–2708. doi: 10.1128/JCM.43.6.2703-2708.2005. [DOI] [PMC free article] [PubMed] [Google Scholar]
- 4.Chan ED, Reves R, Belisle JT, Brennan PJ, Hahn WE. Diagnosis of tuberculosis by a visually detectable immunoassay for lipoarabinomannan. Am J Respir Crit Care Med. 2000;161:1713–1719. doi: 10.1164/ajrccm.161.5.9908125. [DOI] [PubMed] [Google Scholar]
- 5.Engin G, Acunas B, Acunas G, Tunaci M. Imaging of Extrapulmonary Tuberculosis. Radio Graphics. 2000;20:471–488. doi: 10.1148/radiographics.20.2.g00mc07471. [DOI] [PubMed] [Google Scholar]
- 6.Maalouf R, Fournier-Wirth C, Coste J, Chebib H, Saikali Y, Vittori O, Errachid A, Cloarec JP, Martelet C, Jaffrezic-Renault N. Label-free detection of bacteria by electrochemical impedance spectroscopy: comparison to surface plasmon resonance. Anal Chem. 2007;79:4879–4886. doi: 10.1021/ac070085n. [DOI] [PubMed] [Google Scholar]
- 7.Perkins EA, Squirrell DJ. Development of instrumentation to allow the detection of microorganisms using light scattering in combination with surface plasmon resonance. Biosens Bioelectron. 2000;14:853–859. doi: 10.1016/s0956-5663(99)00069-x. [DOI] [PubMed] [Google Scholar]
- 8.Palomino JC. Nonconventional and new methods in the diagnosis of tuberculosis: feasibility and applicability in the field. Eur Respir J. 2005;26:339–350. doi: 10.1183/09031936.05.00050305. [DOI] [PubMed] [Google Scholar]
- 9.Hamasur B, Bruchfeld J, Haile M, Pawlowski A, Bjorvatn B, Kallenius G, Svenson SB. Rapid diagnosis of tuberculosis by detection of mycobacterial lipoarabinomannan in urine. J Microbiol Methods. 2001;45:41–52. doi: 10.1016/s0167-7012(01)00239-1. [DOI] [PubMed] [Google Scholar]
- 10.Sada E, Aguilar D, Torres M, Herrera T. Detection of lipoarabinomannan as a diagnostic test for tuberculosis. J Clin Microbiol. 1992;30:2415–2418. doi: 10.1128/jcm.30.9.2415-2418.1992. [DOI] [PMC free article] [PubMed] [Google Scholar]
- 11.Dutta Noton K, Mehra S, Didier Peter J, Roy Chad J, Doyle Lara A, Alvarez X, Ratterree M, Be Nicholas A, Lamichhane G, Jain Sanjay K, Lacey Michelle R, Lackner Andrew A, Kaushal D. Genetic Requirements for the Survival of Tubercle Bacilli in Primates. J Infect Dis. 2010;201:1743–1752. doi: 10.1086/652497. [DOI] [PMC free article] [PubMed] [Google Scholar]
- 12.Peduru Hewa TM, Tannock GA, Mainwaring DE, Harrison S, Fecondo JV. The detection of influenza A and B viruses in clinical specimens using a quartz crystal microbalance. J Virol Methods. 2009;162:14–21. doi: 10.1016/j.jviromet.2009.07.001. [DOI] [PMC free article] [PubMed] [Google Scholar]
- 13.Yang LMC, Diaz JE, McIntire TM, Weiss GA, Penner RM. Covalent Virus Layer for Mass-Based Biosensing. Anal Chem. 2008;80:933–943. doi: 10.1021/ac071470f. [DOI] [PubMed] [Google Scholar]
- 14.Shen Z, Huang M, Xiao C, Zhang Y, Zeng X, Wang PG. Nonlabeled Quartz Crystal Microbalance Biosensor for Bacterial Detection Using Carbohydrate and Lectin Recognitions. Anal Chem. 2007;79:2312–2319. doi: 10.1021/ac061986j. [DOI] [PMC free article] [PubMed] [Google Scholar]
- 15.Fung YS, Wong YY. Self-assembled monolayers as the coating in a quartz piezoelectric crystal immunosensor to detect Salmonella in aqueous solution. Anal Chem. 2001;73:5302–5309. doi: 10.1021/ac010655y. [DOI] [PubMed] [Google Scholar]
- 16.Das K, Penelle J, Rotello VM, Nuesslein K. Specific Recognition of Bacteria by Surface-Templated Polymer Films. Langmuir. 2003;19:6226–6229. [Google Scholar]
- 17.Mo XT, Zhou YP, Lei H, Deng L. Microbalance-DNA probe method for the detection of specific bacteria in water. Enzyme Microb Technol. 2002;30:583–589. [Google Scholar]
- 18.Lee SH, Stubbs DD, Cairney J, Hunt WD. Rapid detection of bacterial spores using a quartz crystal microbalance (QCM) immunoassay. IEEE Sens J. 2005;5:737–743. [Google Scholar]
- 19.Cooper MA, Singleton VT. A survey of the 2001 to 2005 quartz crystal microbalance biosensor literature: applications of acoustic physics to the analysis of biomolecular interactions. J Mol Recognit. 2007;20:154–184. doi: 10.1002/jmr.826. [DOI] [PubMed] [Google Scholar]
- 20.Pavey KD, Ali Z, Olliff CJ, Paul F. Application of the quartz crystal microbalance to the monitoring of Staphylococcus epidermidis antigen-antibody agglutination. J Pharm Biomed Anal. 1999;20:241–245. doi: 10.1016/s0731-7085(99)00026-6. [DOI] [PubMed] [Google Scholar]
- 21.Schofield AL, Rudd TR, Martin DS, Fernig DG, Edwards C. Real-time monitoring of the development and stability of biofilms of Streptococcus mutans using the quartz crystal microbalance with dissipation monitoring. Biosens Bioelectron. 2007;23:407–413. doi: 10.1016/j.bios.2007.05.001. [DOI] [PubMed] [Google Scholar]
- 22.Zhao J, Zhu W, He F. Rapidly determining E. coli and P. aeruginosa by an eight channels bulk acoustic wave impedance physical biosensor. Sens Actuators, B. 2005;B107:271–276. [Google Scholar]
- 23.Ali Z, O’Hare WT, Theaker BJ. Detection of bacterial contaminated milk by means of a quartz crystal microbalance based electronic nose. J Therm Anal Calorim. 2003;71:155–161. [Google Scholar]
- 24.He F, Zhang L. Rapid diagnosis of M. tuberculosis using a piezoelectric immunosensor. Anal Sci. 2002;18:397–401. doi: 10.2116/analsci.18.397. [DOI] [PubMed] [Google Scholar]
- 25.Godber B, Thompson KSJ, Rehak M, Uludag Y, Kelling S, Sleptsov A, Frogley M, Wiehler K, Whalen C, Cooper MA. Direct quantification of analyte concentration by resonant acoustic profiling. Clin Chem. 2005;51:1962–1972. doi: 10.1373/clinchem.2005.053249. [DOI] [PubMed] [Google Scholar]
- 26.He F, Zhang L, Zhao J, Hu B, Lei J. A TSM immunosensor for detection of M. tuberculosis with a new membrane material. Sens Actuators, B. 2002;B85:284–290. [Google Scholar]
- 27.Cooper MA. Advances in membrane receptor screening and analysis. J Mol Recognit. 2004;17:286–315. doi: 10.1002/jmr.675. [DOI] [PubMed] [Google Scholar]
- 28.Saha K, Bender F, Gizeli E. Comparative Study of IgG Binding to Proteins G and A: Nonequilibrium Kinetic and Binding Constant Determination with the Acoustic Waveguide Device. Anal Chem. 2003;75:835–842. doi: 10.1021/ac0204911. [DOI] [PubMed] [Google Scholar]
- 29.Campbell GA, Mutharasan R. Monitoring of the Self-Assembled Monolayer of 1-Hexadecanethiol on a Gold Surface at Nanomolar Concentration Using a Piezo-Excited Millimeter-Sized Cantilever Sensor. Langmuir. 2005;21:11568–11573. doi: 10.1021/la0519960. [DOI] [PubMed] [Google Scholar]
- 30.Shen D, Huang M, Chow LM, Yang M. Kinetic profile of the adsorption and conformational change of lysozyme on self-assembled monolayers as revealed by quartz crystal resonator. Sens Actuators, B. 2001;B77:664–670. [Google Scholar]
- 31.Wu B, Wu K, Wang P, Zhu DM. Adsorption Kinetics and Adsorption Isotherm of Poly(N-isopropylacrylamide) on Gold Surfaces Studied Using QCM-D. J Phys Chem C. 2007;111:1131–1135. [Google Scholar]
- 32.Janshoff A, Galla HJ, Steinem C. Piezoelectric mass-sensing devices as biosensors-an alternative to optical biosensors? Angew Chem Int Ed. 2000;39:4004–4032. doi: 10.1002/1521-3773(20001117)39:22<4004::aid-anie4004>3.0.co;2-2. [DOI] [PubMed] [Google Scholar]
- 33.Gerdon AE, Wright DW, Cliffel DE. Quartz Crystal Microbalance Detection of Glutathione-Protected Nanoclusters Using Antibody Recognition. Anal Chem. 2005;77:304–310. doi: 10.1021/ac048953t. [DOI] [PubMed] [Google Scholar]
- 34.Liu Y, Yu X, Zhao R, Shangguan DH, Bo Z, Liu G. Real time kinetic analysis of the interaction between immunoglobulin G and histidine using quartz crystal microbalance biosensor in solution. Biosens Bioelectron. 2003;18:1419–1427. doi: 10.1016/s0956-5663(03)00090-3. [DOI] [PubMed] [Google Scholar]
- 35.Barry CE., III Interpreting cell wall “virulence factors” of Mycobacterium tuberculosis. Trends Microbiol. 2001;9:237–241. doi: 10.1016/s0966-842x(01)02018-2. [DOI] [PubMed] [Google Scholar]
- 36.Hunter SW, Gaylord H, Brennan PJ. Structure and antigenicity of the phosphorylated lipopolysaccharide antigens from the leprosy and tubercle bacilli. J Biol Chem. 1986;261:12345–12351. [PubMed] [Google Scholar]
- 37.Alsteens D, Verbelen C, Dague E, Raze D, Baulard AR, Dufrene YF. Organization of the mycobacterial cell wall: a nanoscale view. Pfluegers Arch. 2008;456:117–125. doi: 10.1007/s00424-007-0386-0. [DOI] [PubMed] [Google Scholar]
- 38.Schmidt R, Jacak J, Schirwitz C, Stadler V, Michel G, Marmé N, Schütz GJ, Hoheisel JrD, Knemeyer J-P. Single-Molecule Detection on a Protein-Array Assay Platform for the Exposure of a Tuberculosis Antigen. J Proteome Res. 2011;10:1316–1322. doi: 10.1021/pr101070j. [DOI] [PubMed] [Google Scholar]
- 39.TB Vaccine Testing Research Materials FAQs. Colorado State University; 2007. [accessed September 20, 2007]. http://www.cvmbs.colostate.edu/microbiology/tb/faq.htm. [Google Scholar]
- 40.Kaur D, Lowary TL, Vissa VD, Crick DC, Brennan PJ. Characterization of the epitope of anti-lipoarabinomannan antibodies as the terminal hexaarabinofuranosyl motif of mycobacterial arabinans. Microbiology. 2002;148:3049–3057. doi: 10.1099/00221287-148-10-3049. [DOI] [PubMed] [Google Scholar]
- 41.Myszka DG, Morton TA, Doyle ML, Chaiken IM. Kinetic analysis of a protein antigen-antibody interaction limited by mass transport on an optical biosensor. Biophys Chem. 1997;64:127–137. doi: 10.1016/s0301-4622(96)02230-2. [DOI] [PubMed] [Google Scholar]
- 42.Sauerbrey G. The use of quartz oscillators for weighing thin layers and for microweighing. Z Physik. 1959;155:206–222. [Google Scholar]
- 43.Hillier AC, Ward MD. Scanning electrochemical mass sensitivity mapping of the quartz crystal microbalance in liquid media. Anal Chem. 1992;64:2539–2554. [Google Scholar]
- 44.Eckert R, Jeney S, Hörber JKH. Understanding Intercellular Interactions and Cell Adhesion: Lessons from studies on protein-metal interactions. Cell Bio Inter. 1997;21:707–713. doi: 10.1006/cbir.1997.0215. [DOI] [PubMed] [Google Scholar]
- 45.Norde W. Adsorption of proteins from solution at the solid-liquid interface. Adv Coll Inter Sci. 1986;25:267–340. doi: 10.1016/0001-8686(86)80012-4. [DOI] [PubMed] [Google Scholar]
- 46.Brewer SH, Glomm WR, Johnson MC, Knag MK, Franzen S. Probing BSA Binding to Citrate-Coated Gold Nanoparticles and Surfaces. Langmuir. 2005;21:9303–9307. doi: 10.1021/la050588t. [DOI] [PubMed] [Google Scholar]
- 47.Kato K, Lian LY, Barsukov IL, Derrick JP, Kim H, Tanaka R, Yoshino A, Shiraishi M, Shimada I, Arata Y, Roberts GCK. Model for the complex between protein G and an antibody Fc fragment in solution. Structure. 1995;3:79–85. doi: 10.1016/s0969-2126(01)00136-8. [DOI] [PubMed] [Google Scholar]
- 48.Boujday S, Bantegnie A, Briand E, Marnet PG, Salmain M, Pradier CM. In-Depth Investigation of Protein Adsorption on Gold Surfaces: Correlating the Structure and Density to the Efficiency of the Sensing Layer. J Phys Chem B. 2008;112:6708–6715. doi: 10.1021/jp711916g. [DOI] [PubMed] [Google Scholar]
- 49.Nilson BHK, Loegdberg L, Kastern W, Bjoerck L, Akerstroem B. Purification of antibodies using protein L-binding framework structures in the light chain variable domain. J Immunol Methods. 1993;164:33–40. doi: 10.1016/0022-1759(93)90273-a. [DOI] [PubMed] [Google Scholar]
- 50.Sharma A, Saha A, Bhattacharjee S, Majumdar S, Das Gupta SK. Specific and randomly derived immunoactive peptide mimotopes of mycobacterial antigens. Clin Vacc Immunol. 2006;13:1143–1154. doi: 10.1128/CVI.00127-06. [DOI] [PMC free article] [PubMed] [Google Scholar]
- 51.Hook F, Rodahl M, Brzezinski P, Kasemo B. Energy Dissipation Kinetics for Protein and Antibody-Antigen Adsorption under Shear Oscillation on a Quartz Crystal Microbalance. Langmuir. 1998;14:729–734. [Google Scholar]
- 52.Sauer-Eriksson AE, Kleywegt GJ, Uhlen M, Jones TA. Crystal structure of the C2 fragment of streptococcal protein G in complex with the Fc domain of human IgG. Structure. 1995;3:265–278. doi: 10.1016/s0969-2126(01)00157-5. [DOI] [PubMed] [Google Scholar]
- 53.Yang L, Biswas ME, Chen P. Study of Binding between Protein A and Immunoglobulin G Using a Surface Tension Probe. Biophys J. 2003;84:509–522. doi: 10.1016/S0006-3495(03)74870-X. [DOI] [PMC free article] [PubMed] [Google Scholar]
- 54.Conway JH, Sloane JJA. Sphere Packings, Lattices and Groups. Springer-Verlag; New York: 1988. [Google Scholar]
- 55.Brownsey GJ, Noel TR, Parker R, Ring SG. The Glass Transition Behavior of the Globular Protein Bovine Serum Albumin. Biophys J. 2003;85:3943–3950. doi: 10.1016/S0006-3495(03)74808-5. [DOI] [PMC free article] [PubMed] [Google Scholar]
- 56.Tabak M, Neto DodS, Salmon CEG. On the Interaction of Bovine Serum Albumin (BSA) with Cethyltrimethyl Ammonium Chloride Surfactant: Electron Paramagnetic Resonance (EPR) Study. Braz J Phys. 2006;36:83–89. [Google Scholar]
- 57.Phillies GDJ. Diffusion of bovine serum albumin in a neutral polymer solution. Biopolymers. 1985;24:379–386. doi: 10.1002/bip.360240206. [DOI] [PubMed] [Google Scholar]
- 58.Wasyl Z, Luchter E, Bielanski W. Determination of the effective radius of protein molecules by thin-layer gel filtration. Biochim Biophys Acta. 1971;243:11–18. doi: 10.1016/0005-2795(71)90031-6. [DOI] [PubMed] [Google Scholar]
- 59.Jachimska B, Wasilewska M, Adamczyk Z. Characterization of Globular Protein Solutions by Dynamic Light Scattering, Electrophoretic Mobility, and Viscosity Measurements. Langmuir. 2008;24:6866–6872. doi: 10.1021/la800548p. [DOI] [PubMed] [Google Scholar]
- 60.De Wit JN. Nutritional and functional characteristics of whey proteins in food products. J Dairy Sci. 1998;81:597–608. doi: 10.3168/jds.s0022-0302(98)75613-9. [DOI] [PubMed] [Google Scholar]
- 61.Boehme U, Scheler U. Effective charge of bovine serum albumin determined by electrophoresis NMR. Chem Phys. 2007;435:342–345. [Google Scholar]
- 62.Rezwan K, Meier LP, Rezwan M, Vörös J, Textor M, Gauckler LJ. Bovine Serum Albumin Adsorption onto Colloidal Al2O3 Particles: A New Model Based on Zeta Potential and UV-Vis Measurements. Langmuir. 2004;20:10055–10061. doi: 10.1021/la048459k. [DOI] [PubMed] [Google Scholar]
- 63.Sarma VR, Silverton EW, Davies DR, Terry WD. The Three-Dimensional Structure at 6 A Resolution of a Human γG1 Immunoglobulin Molecule. J Biol Chem. 1971;246:3753–3759. [PubMed] [Google Scholar]
- 64.Labrijn AF, Poignard P, Raja A, Zwick MB, Delgado K, Franti M, Binley J, Vivona V, Grundner C, Huang CC, Venturi M, Petropoulos CJ, Wrin T, Dimitrov DS, Robinson J, Kwong PD, Wyatt RT, Sodroski J, Burton DR. Access of Antibody Molecules to the Conserved Coreceptor Binding Site on Glycoprotein gp120 Is Sterically Restricted on Primary Human Immunodeficiency Virus Type 1. J Virol. 2003;77:10557–10565. doi: 10.1128/JVI.77.19.10557-10565.2003. [DOI] [PMC free article] [PubMed] [Google Scholar]
- 65.Kimura S, Laosinchai W, Itoh T, Cui X, Linder CR, Brown RM., Jr Immunogold Labeling of Rosette Terminal Cellulose-Synthesizing Complexes in the Vascular Plant Vigna angularis. Plant Cell. 1999;11:2075–2086. doi: 10.1105/tpc.11.11.2075. [DOI] [PMC free article] [PubMed] [Google Scholar]
- 66.Narita T, Kitazato H, Koshimura J, Suzuki K, Murata M, Ito S. Effects of protein meals on the urinary excretion of various plasma proteins in healthy subjects. Nephron. 1999;81:398–405. doi: 10.1159/000045323. [DOI] [PubMed] [Google Scholar]
- 67.Mayans MO, Coadwell WJ, Beale D, Symons DB, Perkins SJ. Demonstration by pulsed neutron scattering that the arrangement of the Fab and Fc fragments in the overall structures of bovine IgG1 and IgG2 in solution is similar. Biochem J. 1995;311:283–291. doi: 10.1042/bj3110283. [DOI] [PMC free article] [PubMed] [Google Scholar]
- 68.Boehm MK, Woof JM, Kerr MA, Perkins SJ. The fab and fc fragments of IgA1 exhibit a different arrangement from that in IgG: a study by X-ray and neutron solution scattering and homology modelling. J Mol Recognit. 1999;286:1421–1447. doi: 10.1006/jmbi.1998.2556. [DOI] [PubMed] [Google Scholar]
- 69.Takade A, Umeda A, Matsuoka M, Yoshida S-i, Nakamura M, Amako K. Comparative Studies of the Cell Structures of Mycobacterium leprae and M. tuberculosis Using the Electron Microscopy Freeze-Substitution Technique. Microbiol Immunol. 2003;47:265–270. doi: 10.1111/j.1348-0421.2003.tb03394.x. [DOI] [PubMed] [Google Scholar]
- 70.Navratilova I, Papalia GA, Rich RL, Bedinger D, Brophy S, Condon B, Deng T, Emerick AW, Guan HW, Hayden T, Heutmekers T, Hoorelbeke B, McCroskey MC, Murphy MM, Nakagawa T, Parmeggiani F, Qin X, Rebe S, Tomasevic N, Tsang T, Waddell MB, Zhang FF, Leavitt S, Myszka DG. Thermodynamic benchmark study using Biacore technology. Anal Biochem. 2007;364:67–77. doi: 10.1016/j.ab.2007.01.031. [DOI] [PubMed] [Google Scholar]
- 71.Nelson DL, Cox MM. Lehninger Principles of Biochemistry. 3. Worth Publishers; New York: 2000. [Google Scholar]
- 72.Cooper MA, Dultsev FN, Minson T, Ostanin VP, Abell C, Kieneman D. Direct and sensitive detection of a human virus by rupture event scanning. Nat Biotechnol. 2001;19:833–837. doi: 10.1038/nbt0901-833. [DOI] [PubMed] [Google Scholar]
- 73.Hook F, Rodahl M, Kasemo B, Brzezinski P. Structural changes in hemoglobin during adsorption to solid surfaces: effects of pH, ionic strength, and ligand binding. Proc Natl Acad Sci U S A. 1998;95:12271–12276. doi: 10.1073/pnas.95.21.12271. [DOI] [PMC free article] [PubMed] [Google Scholar]
- 74.Huang CJ, Cho NJ, Hsu CJ, Tseng PY, Frank CW, Chang YC. Type I Collagen-Functionalized Supported Lipid Bilayer as a Cell Culture Platform. Biomacromolecules. 2010;11:1231–1240. doi: 10.1021/bm901445r. [DOI] [PubMed] [Google Scholar]
Associated Data
This section collects any data citations, data availability statements, or supplementary materials included in this article.