

1. Introduction
This article documents the often spectacular rise of the share of cohabitation in the process of union formation in over 350 regions of 13 Latin American countries during the last 30 years of the 20th Century. To this end harmonized census microdata were utilized (IPUMS International). In many provinces, and especially those with larger Indian and black populations, cohabitation and visiting unions have always existed as alternatives to the classic “European” marriage. However, as the data from 3 or 4 census rounds indicate, the rise in cohabitation occurred both in such areas with “old cohabitation” practices and in those where cohabitation had remained much more exceptional till the 1970s. In other words, there is now a sizeable chunk of “new cohabitation” besides or on top of “old cohabitation”.
The same census data also document the existence of a universal negative cohabitation-education gradient, with women with higher levels of education cohabiting less and moving to marriage in greater proportions. On the basis of such negative cross-sectional gradients, one would expect that with advancing education over time, cohabitation would yield to marriage. The advancement in male and female education in Latin America has been quite pronounced since the 1970s, and yet just the opposite trend in marriage and cohabitation is observed compared to the one predicted on the basis of this cross-sectional education gradient. This not only reveals once more the fallacy inherent in the extrapolation of cross-sectional differentials, but illustrates even more strongly that other factors favorable to cohabitation must have been “flying under the radar”.
In this paper we shall therefore also explore to what extent economic and ideational factors may be among the root causes of this trend. More specifically, we shall consider the rise of cohabitation as a possible response to the period of hyperinflation of the 1980s and to major changes in the domain of ethics, religiosity and values concerning gender relations. The latter aspects bring us inevitably to the issue of a possible partial convergence of several Latin American populations to the pattern of the “Second Demographic Transition” (SDT).
The structure of the paper follows the outline given above. We start with a brief historical note on the distinction between traditional and new forms of cohabitation in section 2. In section 3 we discuss some data issues, and continue with a full presentation of the series of cohabitation figures from the 1970 to 2000 census rounds, both for countries as a whole and for their regions. In section 3 we also focus on the link between the incidence of cohabitation and education, and on the shift in this education gradient over time. In section 4 we consider both the economic and ideational factors that may be involved in accounting for the observed “cohabitation boom”. More specifically, we consider the possible impact of the crisis and hyperinflation of the 1980s and of changes in the system of social values (ethics, gender relations, secularization) that could be involved in the process of lifting the social stigma against a number of behavioral features, including cohabitation. Section 5, finally, is devoted to conclusions and suggestions for further research.
2. “Old” and “new” cohabitation
The colonization of Latin America and of the Caribbean not only produced ethnic mixes and persisting strong social stratification differentials, but also a high degree of heterogeneity in partnership formation.
To start with, the indigenous indios populations had marriage systems that were very different from the European Christian version. Ethnographic descriptions1, mostly for the first half of the 20th Century and covering Mexican to Southern Andean indian populations, indicate that many had a practice of polygamy, with either polygyny or polyandry, exchange of brides, occasional wife-lending, rarely strict rules about premarital sex, and typically brideservice or bridewealth instead of a dowry 2. With this in mind, it should not come as a surprise that the mestizo populations in the colonial times developed partnership patterns based on arrangements other than classic European marriage. This has for instance been reflected in historically high levels of “illegitimacy” of births3.
The story for the New World black and mulatto or creole populations is of course very different given the connection with slavery. As such, black slaves had to undergo the rules dictated by the plantation owners. Marriages and even unions were not encouraged by the European masters, given the lower labor productivity of pregnant women and mothers. And for as long as imported slaves were in ample supply and cheap, there was little interest of the owners in the natural increase of the estates’ slave population. It is in this context that freed or eloped slaves developed the pattern of “visiting unions”. In such arrangements, women accept a male partner for as long as he contributes financially or in kind to the household expenditures. Children generally grow up in their mother’s household. But men may be found simultaneously in more than one visiting relationship, and would not necessarily reside there (Smith 1956, Roberts and Sinclair 1978). Even today the partner may be absent from the household, in which case the mother would appear in census statistics as a “false” single or a lone mother.
The white colonial settlers population or the upper social class by contrast adhered to the rules of the European Catholic marriage (“Spanish” marriage, or Portuguese nobres marriage), being monogamous and with strong social class endogamy to retain control over assets. However, this European pattern was often complemented by widespread concubinage, either with lower social class women or slaves.4
The Catholic church and the states generally tended to favor the European marriage pattern, but with quite some ambiguity. First, the Catholic parish clergy, and especially those in more distant places, did not observe the celibacy requirement that strictly. Second, many Christian and pre-Colombian practices were merged into highly syncretic devotions. The promotion of the Christian marriage was therefore mainly the work of the Catholic religious orders who followed the doctrine much more rigorously. At present, however, that promotion is vigorously carried out by the new Evangelical churches which have been springing up all over the continent since the 1950s, and most visibly in Brazil.
Also the role of the various states is often highly ambiguous. Generally, states copied the European legislations of the colonizing nations and hence “officially” promoted the classic European marriage, but more often than not this was accompanied by amendments that involved the recognition of consensual unions as a form of common law marriage and also of equal inheritance rights for children born in such unions. In Brazil, for instance, Portuguese law had already spelled out two types of family regulations as early as the 16th Century (Philippine Code of 1603), namely laws pertaining to the property of notables (nobres) who married in church and transmitted significant property, and laws pertaining to the countryfolk (peões) who did not necessarily marry and continued to live in consensual unions (Borges, 1994). Furthermore, it should also be stressed that many central governments were often far too weak to implement any consistent policy in favor of the European marriage pattern. Add to that the remoteness of many settlements and the lack of interest of local administrations to enforce the centrally enacted legislation.
However, it would be a major mistake to assume that this “old cohabitation” was a uniform trait in Latin American countries (see also J. Quilodran 1999). Quite the opposite is true. In many areas late 19th Century and 20th century mass European immigration (Spanish, Portuguese, Italian, German) to the emerging urban and industrial centers of the continent reintroduced the typical Western European marriage pattern with monogamy, highly institutionally regulated marriage, condemnation of illegitimacy and low divorce. As a consequence the European model was reinforced as a point of reference and became a marker of social success and an ingredient in the process of embourgeoisement. This not only caused the incidence of cohabitation to vary widely geographically and in function of the ethnic mix, but also produced the emergence of a marked gradient by educational level and social class: the higher the level of education, the lower the incidence of cohabitation and the higher that of marriage. This negative cohabitation-education gradient is obviously essentially the result of historical developments, and, as we shall illustrate shortly, found in every single one of the 13 countries studied here. The gradient is not the outcome of a particular economic crisis or decade of stagnation (e.g. the 1980s and 1990s).
To sum up, by the second half of the 20th Century, the incidence of cohabitation in Latin America varied widely from common in non-European ethnic groups or racially mixed groups and in lower social strata to quite uncommon among European populations with higher levels of education and mainly belonging to an urban middle class. What happened during the second half of that century, and continuing to at least the beginning of the 21st Century, is the growth of “new cohabitation” among groups that hardly had any before, and the expansion of “old” cohabitation among populations that already had a historical tradition in this regard.
3. The Latin American cohabitation boom
3.1. Data considerations
Latin American censuses have historically provided an explicit category for consensual unions (uniones libres, uniones consensuales). The examination of the questionnaires of all Latin American and Caribbean censuses conducted between the1960s and 2000s reveals that in the vast majority of them cohabitants could be explicitly indentified either through the variables ‘marital status’ (dominant approach) or ‘union status’ (quite common in Caribbean countries) or through a direct question (e.g. Brazil and recently in Argentina and Suriname).
The individual census records, as used in the IPUMS, have a number of advantages and disadvantages. Firstly, they have a large geographical coverage and allow for spatial disaggregation. Secondly, data can be standardized as to facilitate international comparisons. Thirdly, major individual level covariates are available such as education. And fourthly, they allow for robust trend estimation. The drawbacks are also considerable. The data pertain only to the current status of the individuals, and not to previous positions. Hence, there is no information on ever-cohabited, ever-married, ever-divorced etc. In addition, dates of entry into a particular state are not reported and hence no durations can be computed. Finally, the census data are only available at large time intervals, most commonly only every 10 years. This obviously does not allow for detailed time series analyses in tandem with economic indicators, such as inflation rates, unemployment rates etc.
Further methodological problems arise as well. For instance, there is the problem of the “false singles” and “visiting unions”. In these instances, women report the presence of their own children in the household, but there is no male partner being referred to. These women have probably been in a union in the past, but it is unclear whether they are now newly single or a partner in a visiting union. In the present analysis such “unclear” cases have not been added to either numerator or denominator. This is likely to result in an underestimate of the true incidence of cohabitation and visiting unions as combined alternatives to marriage, but in a fair assessment of the incidence of cohabitation only.
A similar problem arises when individuals that cohabited in the past but were no longer in union at the time of the census, now report themselves as singles (Esteve, García and McCaa 2011). This clearly exaggerates the proportion of singles and affects the ratio between married and cohabitating couples as we observe ages that are increasingly distant from those in which union formation was more intense. To minimize bias, our analysis focuses on younger ages, mainly 25-295, but not on the very young who are just starting to enter unions.
Several researchers (e.g. Ruiz Salguero and Rodriguez Vignoli 2011, Rosero-Bixby, Castro Martin and Martin Garcia 2009, Lopez Ruiz, Esteve and Cabré 2008, Rodriguez 2005, Garcia and Rojas 2002) have used census data to explore cohabitation patterns in Latin America. Some of them did so on the basis of the Integrated Public Use Microdata Series (IPUMS) that have been collected and harmonized at the University of Minnesota Population Studies Center (Minnesota Population Center 2011). Also, estimates of the share of consensual unions were apparently made by the US Census Bureau (2004) using the censuses of the 1950s and 60s and probably also other sources. These estimates pertain to a more limited number of countries, but we have not been able to locate their original data file.
Previous research based on these US Census Bureau data (Fussell and Palloni 2004) indicates that the rise in cohabitation most probably already starts during the 1960s in a number of countries, involving both countries with an initially very low incidence of cohabitation and countries with higher levels. Note that the cohabitation percentages reported by Fussell and Palloni seem to pertain to all women aged 25-29, whereas the ones used in this paper pertain only to women currently in a union in that age group. The Fussell and Palloni figures are therefore lower than ours. Keeping this distinction in mind, their data indicate that Argentina (5.8 % cohabitation of all women in 1950), Uruguay (5.7 % in 1960), Chile (3.0 % in 1970) and Brazil (5.1% in 1960) belong to the former category with initially low cohabitation frequencies. Peru (20.9 % in 1960) and Colombia (13.5 % in 1960) are typical examples of a middle group with higher starting values and later rises. However, countries with pre-existing high levels of what we have called “old cohabitation” did not witness the onset of such a trend until much later. Examples thereof are Guatemala (56.1 % in 1950) or Venezuela (29.7 % in 1950), the Dominican Republic (44.4 % in 1960) or El Salvador (34.2 % in 1960).
3.2. The spatial view
The results that will be reported from here onward stem from the extensive analysis of the harmonized Latin American census microdata samples available at IPUMS international (Minnesota Population Center 2011). This analysis uses as many census rounds between 1970 and 2000 as possible (see Appendix 1). Consequently, with the exception of a few areas, the time series generally capture the initial rises of the share of cohabitation among all unions. The results are shown in Table 1 for 13 countries, and for men and women aged 25-29 and 30-34 respectively.
Table 1.
Percent cohabiting among all unions of men and women, 25-29 and 30-34, in Latin American countries, 1970-2000 census rounds
| 25-29
|
30-34
|
||||||||||
|---|---|---|---|---|---|---|---|---|---|---|---|
| 1970 | 1980 | 1990 | 2000 | Dif. 2000 -1970 | 1970 | 1980 | 1990 | 2000 | Dif. 2000 -1970 | ||
|
|
|
||||||||||
| Men | |||||||||||
| Argentina | 13.05 | 14.90 | 25.85 | 48.72 | 35.67 | 10.93 | 12.16 | 20.9 | 33.19 | 22.26 | |
| Bolivia | . | . | . | 41.13 | . | . | . | 28.59 | |||
| Brazil | 7.15 | 13.29 | 25.24 | 45.52 | 38.37 | 6.52 | 11.25 | 19.54 | 35.41 | 28.89 | |
| Chile | 4.36 | 6.19 | 12.06 | 29.29 | 24.93 | 4.22 | 5.75 | 9.59 | 20.38 | 16.16 | |
| Colombia | 20.32 | 36.42 | 54.81 | 72.95 | 52.63 | 18.59 | 30.47 | 46.11 | 62.07 | 43.48 | |
| Costa Rica | 16.99 | 20.10 | . | 38.05 | 21.06 | 15.28 | 17.99 | . | 29.84 | 14.56 | |
| Cuba | . | . | . | 62.10 | . | . | . | 54.59 | |||
| Ecuador | 27.17 | 29.93 | 31.30 | 41.52 | 14.35 | 24.75 | 27.61 | 28.64 | 36.35 | 11.6 | |
| Mexico | 16.61 | . | 16.19 | 25.04 | 8.43 | 14.59 | . | 12.6 | 19.62 | 5.03 | |
| Panama | 58.42 | 54.93 | 58.82 | 70.17 | 11.75 | 57.49 | 52.42 | 50.52 | 58.3 | 0.81 | |
| Peru | . | . | 50.74 | 76.60 | . | . | 37.49 | 62.73 | |||
| Puerto Rico | 8.09 | 6.24 | 13.49 | . | 8 | 5.12 | 11.01 | . | |||
| Venezuela | 30.61 | 34.14 | 38.68 | 56.39 | 25.78 | 30.57 | 32.81 | 35.34 | 47.7 | 17.13 | |
| Women | |||||||||||
| Argentina | 11.05 | 13.02 | 22.47 | 41.28 | 30.23 | 10.08 | 11.53 | 19.46 | 28.72 | 18.64 | |
| Bolivia | . | . | . | 34.68 | . | . | . | 23.39 | |||
| Brazil | 7.59 | 13 | 22.22 | 39.27 | 31.68 | 7.13 | 11.73 | 19.03 | 31.6 | 24.47 | |
| Chile | 4.63 | 6.72 | 11.35 | 24.6 | 19.97 | 4.61 | 6.52 | 10.95 | 18.3 | 13.69 | |
| Colombia | 19.66 | 33.18 | 49.17 | 65.6 | 45.94 | 18.2 | 28.44 | 42.44 | 56.64 | 38.44 | |
| Costa Rica | 16.82 | 19.44 | . | 32.58 | 15.76 | 16.05 | 17.27 | . | 26.32 | 10.27 | |
| Cuba | . | . | . | 55.82 | . | . | . | 50 | |||
| Ecuador | 26.96 | 29.37 | 30.12 | 37.44 | 10.48 | 25.34 | 26.84 | 27.47 | 32.54 | 7.2 | |
| Mexico | 15.34 | . | 15.16 | 22.69 | 7.35 | 14.16 | . | 12.49 | 18.63 | 4.47 | |
| Panama | 58.86 | 52.33 | 53.24 | 62.54 | 3.68 | 53.78 | 51.01 | 49.32 | 54.06 | 0.28 | |
| Peru | . | . | 43.09 | 69.81 | . | . | 31.85 | 56.05 | |||
| Puerto Rico | 8.51 | 5.25 | 12.01 | . | 6.57 | 4.67 | 10.09 | . | |||
| Venezuela | 30.81 | 32.59 | 36.85 | 51.61 | 20.8 | 31.18 | 32.64 | 34.89 | 45.15 | 13.97 | |
Source: Own calculations based on Latin American census microdata from IPUMS international
The data in Table 1 not only document the marked heterogeneity of Latin American countries at the onset, but also that especially the 1990s witnessed an acceleration of an already upward trend.
During the 1960s (1970 census round) the share of cohabitation among all women 25-29 in a union varied between about 5 and 15 percent in countries with low levels of “old cohabitation” (Chile, Brazil, Puerto Rico, Argentina), but a genuine cohabitation boom must have taken place during the 1990s (2000 census round) that drove up these percentages to levels between 25 and 45. The 1990s were equally significant for a number of countries who were in the middle range at the 1970 census round. This holds very strikingly for Colombia where the share of cohabitation for women 25-29 jumps from about 20 percent in 1973 to almost 50 in 1993 and over 65 in 2007. Less spectacular, but equally noteworthy are the rises in Mexico and Costa Rica, where the cohabitation shares initially remained fairly stable around 15 percent, but also increased during the 1990s by 7 and 16 percentage points respectively.
Among the countries with 30 percent or more cohabitors among women 25-29 in unions in the 1970s census round, i.e. among those with sizeable categories of “old cohabitation”, there are also remarkable rises that took place during the last decade of the previous century. Clear examples thereof are Venezuela, where the share of cohabiting young women rose from 37 in 1990 to 52 percent in 2000, and Peru with a jump from 43 to 70 over the same decade. Only for the “champion” of old cohabitation, namely Panama, is there a more modest rise during the 1990s, from 53 to 63 percent. And at the other end of the distribution, Puerto Rico remains the most conservative country in the entire set, but the share of cohabitation among women 25-29 of over 20 percent by 2000 should not come as a surprise.
Taken together, in the 2000 census round 6 countries of the 13 had shares of cohabitation in excess of 40 percent for women 25-29, and 9 out of the 13 had such large shares for men 25-29. In the 1990 census round there were only such 4 countries (counting in Cuba) for either men or women 25-29, and in 1970 presumably only 1 (Panama).
The census estimates of the shares of cohabitation for women 25-29 are equally available for the regions (or even municipalities of Colombia) of the various countries. For most countries these regions remain the same over the entire period of observation (see Table 2), except for Brazil, where the spatial resolution improves starting from 26 regions in 1970 to 135 smaller ones subsequently. There are no regional data for Puerto Rico, whereas Cuba, Bolivia and Costa Rica only contribute information for the 2000 census round.
Table 2.
Number of regions with shares of cohabitation among all unions of 20 and 50 percent respectively, women 25-29. Latin American countries, 1970-2000 census rounds
| >20% | >50% | |||||||
|---|---|---|---|---|---|---|---|---|
|
| ||||||||
| 1970 | 1980 | 1990 | 2000 | 1970 | 1980 | 1990 | 2000 | |
| Chile | 0 (13) | 0 (13) | 0 (13) | 9 (13) | 0 (13) | 0 (13) | 0 (13) | 0 (13) |
| Brazil | 2 (26) | 22 (133) | 67 (135) | 131 (135) | 0 (26) | 0 (133) | 3 (135) | 29 (135) |
| Puerto Rico | 0 (1) | 0 (1) | 0 (1) | 0 (1) | 0 (1) | 0 (1) | ||
| Bolivia | 8 (9) | 2 (9) | ||||||
| Argentina | 8 (23) | 8 (24) | 18 (24) | 24 (24) | 1 (23) | 0 (24) | 0 (24) | 4 (24) |
| Mexico | 8 (30) | 8 (32) | 20 (32) | 0 (30) | 0 (32) | 0 (32) | ||
| Costa Rica | 3 (7) | 3 (7) | 6 (7) | 0 (7) | 0 (7) | 2 (7) | ||
| Colombia | 15 (27) | 28 (30) | 30 (30) | 33 (33) | 2 (27) | 4 (30) | 19 (30) | 33 (33) |
| Ecuador | 7 (21) | 8 (20) | 9 (22) | 13 (23) | 3 (21) | 3 (20) | 3 (22) | 5 (23) |
| Cuba | 15 (15) | 10 (15) | ||||||
| Venezuela | 23 (24) | 24 (24) | 24 (24) | 24 (24) | 5 (24) | 4 (24) | 3 (24) | 16 (24) |
| Peru | 25 (25) | 25 (25) | 8 (25) | 24 (25) | ||||
| Panama | 10 (10) | 10 (10) | 10 (10) | 11 (11) | 8 (10) | 9 (10) | 8 (10) | 11 (11) |
Note: Regions with less than 50 women among all unions in the dataset are not included.
Source: Own calculations based on Latin American census microdata from IPUMS international
Table 2 documents the rise in cohabitation by counting the number of regions that pass the thresholds of respectively 20 and 50 percent cohabiting women 25-29. As before, these percentages are again the shares of all such women currently in a union (i.e. married + cohabiting).
None of the 13 regions in Chile reached the level of 20 percent until 1990. But at the time of the 2000 census round, no less than 9 regions of these 13 had crossed that threshold. In Brazil, only 22 out of 133 regions passed the lower threshold of 20 percent in 1980. By 2000, virtually all of them had crossed that level, and 29 of them had already passed the much higher threshold of 50 percent in cohabitation rather than marriage. The movement in Argentina is very similar: in the 1970 census round, 8 out of 23 regions had cohabitation shares of 20 percent or more, and by 2000, all of them had crossed that lower threshold. Furthermore, 4 of them had already crossed the line with more women 25-29 in cohabitation than in marriage. The rise in Mexico is less spectacular, but there were 20 out of the 32 regions with a share of cohabitation above 20 percent in 2000 where there were only 8 in 1970 and 1990.
Of all countries, the most striking cohabitation boom may have occurred in Colombia. In 1970 only 2 regions of 27 had more cohabiting than married young women and 12 regions did not even made it across the 20 percent threshold. But in 2000, all 33 of them had not only passed the lower, but also the upper threshold of 50 percent.
As noted earlier, not only the countries with low or moderate levels of “old cohabitation” in 1970 or 1980, but also the ones with high levels witnessed rises. These countries were already above the lower threshold of 20 percent as used in Table 2 to start with, and for them it is the upper threshold that is of relevance. In Venezuela 16 regions of the 24 cross the 50 percent mark in 2000, whereas there were only 3 ten years earlier. Over the same decade the figure jumps from 8 to 24 for the 25 Peruvian regions. Finally, two thirds of the 15 Cuban regions have joined that group by 2000, and the same holds for all 11 Panamese ones.
The full distribution of provincial levels by country is shown in Figure 1 using boxplots. For countries with two such measurements, only the “leader” Panama shows no marked further upward shift of the distribution of regions.
Figure 1.

Boxplot of the share of cohabitation among all unions of women 25-29 in the regions of Latin American countries, various census rounds
Note: Regions with less than 50 women among all unions in the dataset are not included.
Source: Own calculations based on Latin American census microdata from IPUMS international
Another telling way to describe the data consists of ranking the regions by level of cohabitation as measured at the earliest date, and to see how they move up over the next decades. This is done for 10 countries in Figure 2. In addition, a straight line was fitted through the provincial data points for each census so that one can see whether the distribution shifted more as a result of the tail being pulled in or the head moving out. In this way, the lines are essentially parallel in Costa Rica and Brazil, indicating that all regions had similar absolute increases in percentages cohabiting, irrespective of their earlier position in the distribution. Most of the other countries have the higher increments in regions that were at the lower end to start with, which indicates that the overall rise is due to a slightly greater extent to “new” rather than to “old” cohabitation. The main exception is found in Chile, where the big jump between the 1990 and 2000 census rounds is largest for the areas that had the higher cohabitation shares to start with.
Figure 2.


Patterns in the rise of the share of cohabitation among all unions of women 25-29 in regions of Latin American countries, various census rounds
Note: Regions with less than 50 women among all unions in the dataset are not shown.
Source: Own calculations based on Latin American census microdata from IPUMS international.
Finally, we present the list of 25 regions which respectively had the lowest and the highest shares of cohabiting women aged 25-29 in 1970, together with the subsequent increments in these shares over the next three decades. As shown in Table 3, 24 of the 25 “lowest” regions had less than 5 percent cohabitation to start with, and the rise to levels of up to 40 percent can be considered as “new cohabitation”. The most spectacular of such rises are found in seven Brazilian regions (Parana, Ceara, Minas Gerais, Santa Catarina, Piaui, Sao Paulo and especially Rio Grande do Sul), in Argentina (Cordoba), Chile (RM Santiago) and Colombia (Valparaiso). At the other extreme, among the 25 regions with the highest proportions of “old” cohabitation most consolidate their position, but others still make a jump in excess of 10 percentage points. The latter are areas in Colombia (Cordoba, Cesar and especially Choco and La Guajira), Ecuador (Esmaraldas), Venezuela (Portuguesa, Amazonas, Yaracuy, Delta Amacuro) and even in Panama (Colon).
Table 3.
Changes in the shares of cohabitation among women 25-29 in a union in the 25 regions with respectively the lowest and the highest initial levels of cohabitation in 1970
| 25 Regions with the lowest % of cohabiting unions in 1970 | 25 Regions with the highest % of cohabiting unions in 1970 | |||||||
|---|---|---|---|---|---|---|---|---|
| Region | Country | % 1970 | % 2000 | Region | Country | % 1970 | % 2000 | |
|
|
|
|||||||
| 1 | Azuay | Ecuador | 1.6 | 12.1 | Kuna Yala (San Blas) | Panama | 90.6 | 85.1 |
| 2 | Del Maule | Ecuador | 2.4 | 18.2 | Darien | Panama | 81.0 | 82.1 |
| 3 | Magallanes y Antartica Chilena | Chile | 2.5 | 18.1 | Bocas del Toro* | Panama | 78.4 | 73.9 |
| 4 | Tungurahua | Ecuador | 2.7 | 8.7 | Los Rios | Ecuador | 75.3 | 74.4 |
| 5 | Del Libertador General Bernardo O’Higgins | Chile | 3.0 | 19.5 | Cocle | Panama | 70.7 | 75.7 |
| 6 | Parana | Brazil | 3.1 | 28.9 | Chiriqui* | Panama | 69.9 | 61.4 |
| 7 | Guanajuato | Mexico | 3.3 | 7.1 | Veraguas* | Panama | 68.6 | 68.2 |
| 8 | Cordoba | Argentina | 3.3 | 32.6 | Los Santos | Panama | 65.3 | 61.1 |
| 9 | Ceara | Brazil | 3.4 | 35.7 | Apure | Venezuela | 60.8 | 65.6 |
| 10 | Queretaro | Mexico | 3.4 | 16.2 | Esmeraldas | Ecuador | 60.7 | 75.4 |
| 11 | Santa Catarina | Brazil | 3.5 | 30.4 | Cojedes | Venezuela | 58.2 | 62.0 |
| 12 | Valparaiso | Colombia | 3.5 | 23.9 | Choco | Colombia | 57.1 | 87.4 |
| 13 | Minas Gerais | Brazil | 3.7 | 26.0 | Formosa | Argentina | 52.1 | 59.1 |
| 14 | Loja | Ecuador | 3.8 | 11.6 | Colon | Panama | 51.7 | 62.0 |
| 15 | Region Metropolitana de Santiago | Chile | 3.9 | 24.8 | Cordoba | Colombia | 50.8 | 79.5 |
| 16 | Cotopaxi | Ecuador | 3.9 | 13.6 | Amazonas | Venezuela | 50.4 | 67.6 |
| 17 | Piaui | Brazil | 4.0 | 27.6 | Yaracuy | Venezuela | 50.2 | 63.9 |
| 18 | Aguascalientes | Mexico | 4.1 | 9.3 | Delta Amacuro | Venezuela | 49.5 | 67.8 |
| 19 | Bio-Bio | Chile | 4.1 | 19.0 | Guayas | Ecuador | 48.3 | 50.7 |
| 20 | Sao Paulo | Brazil | 4.3 | 34.8 | Panama | Panama | 47.4 | 57.2 |
| 21 | Chimborazo | Ecuador | 4. 6 | 8.5 | La Guajira | Colombia | 47.4 | 82.8 |
| 22 | Cartago | Costa Rica | 4.6 | 15.5 | Herrera | Panama | 47.1 | 50.7 |
| 23 | Rio Grande do Sul | Brazil | 4.9 | 40.6 | Portuguesa | Venezuela | 46.7 | 60.6 |
| 24 | Canar | Ecuador | 4.9 | 16.2 | Cesar | Colombia | 46.4 | 74.3 |
| 25 | Carchi | Ecuador | 5.5 | 19.1 | Monagas | Venezuela | 46.3 | 52.9 |
Note:
The decrease in the % of cohabitation unions in these regions can be explained by the creation of a new region in Panama in the 2000 round, which was created from them (Ngöble-Bugle; 2000 = 88,44%).
Source: Own calculations based on Latin American census microdata from IPUMS international.
Further geographical details can be gleaned from the two series of maps presented in the appendix. The maps in the first series are of the classic type, and have the advantage of familiarity. However, they misrepresent the demographic weight of each region, and sometimes enormously so. For instance, the Amazone basin covers a very large area, but is only very sparsely populated. Conversely, large urban areas are barely dots on a classic map, but may contain sizeable portions of a nation’s population. To correct for this, also a series of Gastner-Newman cartograms has been made, which may look less familiar but do respect the true demographic weight of each region. Obviously the color (shading) codes have been kept constant for the 4 census rounds, so that the “reddening” (“darkening”) of the map fully catches the well nigh ubiquitous Latin American cohabitation boom.
3.3. The education gradient
We have already pointed out that the negative cross-sectional gradient of cohabitation with rising female education is a historical reflection of ethnic and social class differentials. That negative slope is found in all the countries considered here, and as the top part of Figure 3 shows, this was already clearly so prior to the post-1970 cohabitation boom.
Figure 3.
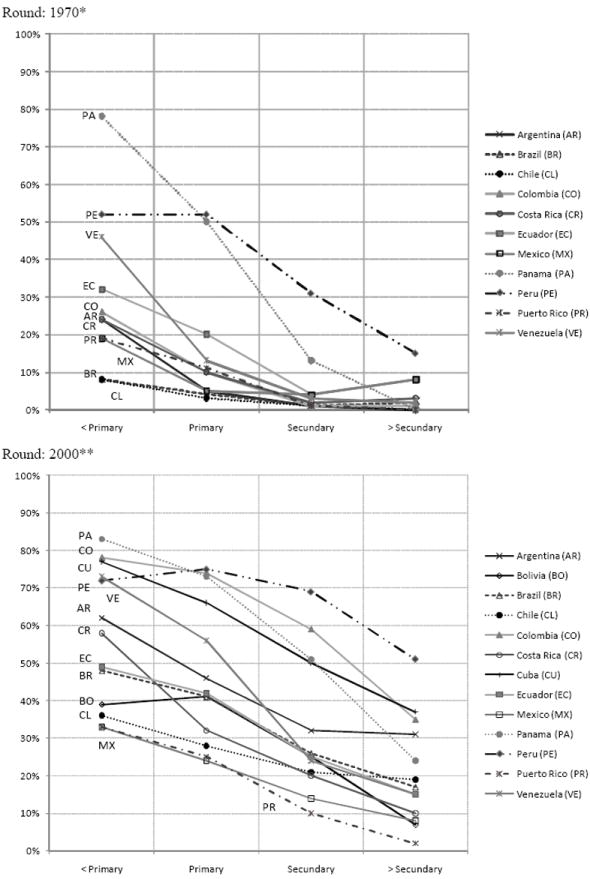
Share of cohabitation among all unions of women 25-29 by level of education, country and census round
Notes: * Perú is 1993. ** Puerto Rico is 1990
Source: Own calculations based on Latin American census microdata from IPUMS international.
The existence of a positive or negative education gradient has very often been used to explain trends. For instance, the finding that contraceptive use and effectiveness both increase with education level is an almost universal cross-sectional feature. If there is furthermore a rise in educational levels over time, then the latter combined with the former is taken as the reason for an overall increase in contraceptive use or effectiveness. Examples of such conclusions based on combinations of a cross-sectional differential and a trend in the independent variable (here: education) are so frequent and “normal” in demography that they lead to leaps of faith.6
If we were to use the typical Latin-American educational gradient of cohabitation in combination with the changes in education over time to come up with such a classic projection of the incidence of cohabitation, we would have been dramatically wrong. As it turns out, female education levels rose dramatically over the three decades in all countries presented here. The boxplots of Figures 4 and 5 show for each country the distribution of regions with respect to their percentages of women 25-29 with at least full primary and full secondary education respectively7. In the 1970 census round, there were 8 countries out of 12 with median regional levels below 50 percent of young women completing at least primary education. In the 2000 round, there is no such country left. All of them have reached regional medians of 70 percent completed primary education or better. In fact, with the exception of a few Brazilian areas, there is hardly any other region left with less than 50 percent of women 25-29 having completed full primary schooling. Very much the same picture holds with respect to the completion of full secondary education by women 25-29. In 1970 or 1980, regional medians for 10 countries were typically below 10 percent of women 25-29 with full secondary education or better. By 2000 these medians have all moved to the 30 to 60 percent band. In fact there is hardly any single region left with less than 10 percent of women 25-29 having completed secondary education.
Figure 4.

Boxplots of the regional distributions of the percentage of women 25-29 with complete primary education or better in Latin American countries, various census rounds
Note: Regions with less than 50 women among all unions in the dataset are not included.
Source: Own calculations based on Latin American census microdata from IPUMS international.
Figure 5.

Boxplots of the regional distributions of the percentage of women aged 25-29 with complete secondary education or better in Latin American countries, various census rounds
Note: Regions with less than 50 women among all unions in the dataset are not included.
Source: Own calculations based on Latin American census microdata from IPUMS international.
Considering these major improvements in educational levels during the last 2 or 3 decades of the 20th Century (a trend) in combination with the negative education gradient of cohabitation (a cross-section) would lead us to expect a drop in the incidence of cohabitation over time. Of course, just the opposite has happened, and quite dramatically so. Evidently, the cross-sectional educational gradient does not at all provide any information as to how and why a particular behavior increases over time.
The outcome is that there must have been major other factors fostering a rise in cohabitation that have been flying under the radar and that have totally neutralized the mere composition effect of rising education. The proof of the existence of such factors lies in the observation that cohabitation has been rising over time in all education groups, and sometimes more among the better educated than among the lesser educated. In other words, all social classes have been affected by the cohabitation boom. The latter feature is eloquently shown in the bottom panel of Figure 3. In 1970, there was not a single country with more than 10 % cohabitation among all women 25-29 living in a union and with more than complete secondary education. In the last census round there are 9 such countries, and the group of best educated women now have cohabitation shares in excess of 30 percent in Argentina, Colombia, Cuba and Peru. Even more striking is that the starkest contrast in 1970 was between those women with less than primary education and the others. In the 2000 census round, this contrast has given way to a more gradual slope as a result of increases in cohabitation among the middle educational groups, who, it should be stressed, now form the bulk of the population.
This obviously begs the question of what has caused this rise in cohabitation in all these countries, regions and educational groups.
4. What flew under the radar ?
A useful framework for starting the analysis of any new form of behavior is the “ready, willing and able” (RWA) one used by A.J. Coale (1973) to interpret the historical European fertility transition, and elaborated by R. Lesthaeghe and C. Vanderhoeft (2001) to accommodate heterogeneity and the time dimension. The “Readiness” condition states that the new form of behavior must have an economic or psychological advantage, and hence refers to the cost-benefit calculus of a particular action compared to its alternatives. The “Willingness” condition, by contrast, refers to the religious and/or ethical legitimacy of the new form of behavior. And the “Ability” condition states that there must be technical and legal means available which permit the realization of that “innovation”. Note, however, that the RWA-conditions must be met jointly before a transition to a new form will take place. It suffices for one condition not being met or lagging for the whole process of change coming to a halt.
In the instance of cohabitation, a number of economic advantages are easily identified. First, compared to legal marriage, cohabitation is an “easy in, easy out” solution. This implies, more specifically, (i) that considerable costs are saved by avoiding more elaborate marriage ceremonies, (ii) that parents and relatives or friends are presented with the outcome of individual partner choice as a fait accompli and without fuzz, and (iii) that the exit costs from cohabitation, both financial and psychological, are considerably lower than in the case of a legal divorce. In other words, cohabitation is the quicker and cheaper road to both sexual partnership and economies of scale. And in many instances, such shorter term advantages may indeed weigh up against the main advantage of marriage, i.e. it being a firmer longer term commitment.
In addition to these general economic advantages, the rise in cohabitation can also be a response to the economic crises of the 1980s and to the slow subsequent recovery of the 1990s. In these instances, future couples could postpone entry into a union of whatever type. Alternatively they could opt for the easier and cheaper version, and therefore prefer cohabitation over marriage. Moreover, also the transition from cohabitation to marriage could be delayed and even foregone as a result of the events in the 1980s and 90s. In the latter two instances there would be a rise in the share of cohabitation among persons in a union.
Within the RWA-framework, a basic change in the R-condition, as described above, would not be sufficient. Concomitant changes in the W and A-conditions are equally necessary. In the Latin American context, we therefore expect there to have been major cultural changes as well, and more particularly with respect to ethics and morality, thereby lifting the stigma on certain forms of behavior (including cohabitation). Most likely, such changes are also accompanied by further secularization and by changes in the attitudes with respect to gender relations as well.
The R and W-conditions are addressed in the next two sections. As far as the “Ability” condition is concerned, we will remain mute, as this requires a detailed study of legal possibilities (e.g. options for contractual provisions, recognition of children, etc.) and legal impediments to cohabitation. Such a comparative study stretches far beyond the expertise of the present authors. But obviously, national differences in cohabitation or trend accelerations can equally be the result of differences or shifts in such institutional factors.
4.1. Cohabitation as a response to economic shocks
Latin America has been known for both, its high social and economic inequalities and its turbulent macroeconomic performance. More specifically, after a spell of dictatorships, a number of Latin American countries “re-democratized”, but policies aimed at diminishing the large differentials in standards of living resulted in inflation and outbursts of hyperinflation (Bittencourt 2010). The attempts at income redistribution during the “populist” phase was done via unfunded public deficits, which then led to catastrophic inflation, and ultimately to even more inequality as the poor were affected more than the rich, who resorted to a dollarization of their assets. Finally, in such instances the fruits of economic development realized prior to 1980 were often annihilated.
The timing, the duration and the severity of the hyperinflation period varies considerably from country to country. Roughly speaking, there were two distinct patterns. The first one is characterized by a very long period of inflation, but at peak annual levels during the 1980s that were generally below 30 percent. The second pattern is that of a short period but of such high intensities that money became worthless overnight. Peak levels of 1000 percent inflation in a given year are then recorded (Singh et al. 2005, Adsera and Menendez, 2011). Obviously, after such inflation spikes consumer price indexes remain at a record high for a much longer time, so that the effect of the crisis is felt for many years, and in the Latin American case, well into the 1990s. Examples of long term creeping high inflation are Chile (already starting in the Allende period) and Colombia. Peaks of 30% were recorded respectively in 1985 and 1990 (Singh et al. 2005, p.4). Examples of virulent hyperinflation are Argentina (3080 % in 1989), Brazil (2950 % in 1990), and especially Peru (7490 % in 1990) and Bolivia (11750 % in 1985). Mexico is an intermediate case with two peaks in the 1980s, one of 100 % in 1983 and another one of 132 % in 1987 (ibidem). Considering such figures, there are enough reasons to advance the thesis that the economic and political conditions have been the main culprits for the rise in the share of cohabitation in overall union formation.
There are, however, several caveats regarding this explanation.
As argued and illustrated by E. Fussell and A. Palloni (2004), ages at first union remained remarkably stable throughout the second half of the 20th century, and show a surprisingly low elasticity to such external disturbances. The authors start out with the following question:
“The joint occurrence of an unusual rapid fertility decline and a traditional marriage regime quite resistant to changes poses a problem. How can one explain their coexistence?”(p.1201)
Their answer consist of pointing out that the economic conditions spurred on the fertility decline, but that:
“As it has been for many centuries, the marriage and kinship system in Latin America continues to provide a system of nonmonetary exchange that parallels rather than competes with market systems.”(p.1211)
As such, in their opinion, the nuptiality system would provide a buffer against economic hardship, for both elites and the bulk of the population. But the paper focuses on the stable ages at first union, not on the shift from marriage to cohabitation. Viewed from the latter perspective, there was much more “internal” change within the nuptiality system, and it remains possible that the turbulent economic events of the 1980s and early 90s are indeed partially responsible for the shift from marriage to cohabitation.
The second caveat concerns the timing of both features, inflation and the rise of cohabitation. In two of the countries considered here, i.e. Brazil and Colombia, the largest increase in percentages cohabiting occurred during the 1970s, i.e. well before the great shocks of the 1980s. During the 1980s, these percentages continued to grow, but in two different inflation regimes. The Brazilian hyperinflation peak of almost 3000 percent comes fairly late, i.e. in 1990, and by that time the cohabitation share for women 25-29 has already tripled from some 7 to 22 percent (see Table 1). In Colombia, the 1980s inflation peak is much lower, i.e. 33 percent, and long term inflation was low by Latin American standards, i.e. 16 percent p.a. for the second half of the 20th Century (Adsera and Menendez, 2011, p.40). Yet Colombia has the most spectacular increase in cohabitation, from some 20 percent to almost 50 percent (see Table 1) before the 1990 inflation maximum.
The two countries with the largest increments in cohabitation in the 1980s are Argentina and Puerto Rico. The former has a hyperinflation peak of over 3000 percent in 1989 and average annual inflation rates for the last 50 years prior to 2003 of no less than 184 percent (Adsera and Menendez, 2011, p.40). Puerto Rico, by contrast has none of this, and still a noticeable rise in cohabitation prior to 1990. In five of the countries considered here (Chile, Costa Rica, Ecuador, Mexico and Venezuela), the largest increment in the share of cohabitation among all unions occurred in the 1990s (see Table 1), i.e. during the restabilization phase of the economy. Of these countries, only Chile had an earlier hyperinflation peak of 504 percent and average annual inflation of over 50 percent for several decades. The other four countries all had more modest peaks between 90 and 130 percent, and also more modest inflation averages below 20 percent p.a. for the last half of the 20th Century (ibidem). Yet, Chile does not have the most spectacular rise in cohabitation by the year 2000 and cohabitation shares among women 25-29 in a union are still below 40 percent in all provinces (see figure 2).
The conclusion from these comparisons is that there is no clear correlation between the timing and the rise in cohabitation on the one hand, and the timing of inflation peaks or the overall degree of inflation on the other. Admittedly, a fine time series analysis is not possible since annual cohabitation rates, unlike marriage rates, cannot be computed. The entry into a consensual union is per definition an unrecorded event. The most one can say is that inflation and hyperinflation may have been general catalysts which strengthened the trend in the shift from marriage to cohabitation, but other causes must have been present as well.
Finally, the census figures for the 2010 round are needed to see whether the upward cohabitation trend has continued, despite the fact that average inflation figures are generally much lower for the 2000 decade than before. In fact, if inflation would have been the prime driving force of the cohabitation boom, then a return to marriage should be expected under the restored conditions of low inflation of the last 10 years. However, such a return to the ex ante situation seems to be an unlikely scenario8.
4.2. Lifting the stigma: cohabitation and ideational changes
As the RWA-framework posits, the switch to more cohabitation in all strata of the population would not have occurred in the absence of a more favorable “Willingness” condition. Hence, also this condition must be researched before coming up with a final conclusion.
With respect to “Willingness”, we possess information from the World Values Surveys (WVS) that indeed suggests the occurrence of a major change in crucial features of the ideational domain. We shall now turn to that evidence.
As is well known, the European (EVS) and World Values Studies (WVS) have a long tradition often going back to the 1980s to measure major ethical, religious, social and political dimensions of the cultural system. Most Latin American countries have only one wave of the WVS, and a single cross-section is of course inadequate for our purposes. Moreover, unlike the EVS, the WVS-surveys measure current cohabitation only (“living as married”) but fail to catch the “ever cohabited” state, thereby hopelessly confounding married persons with and without cohabitation experience9. This shortcoming obstructs the analysis of a single cross-section even more, since the selection over the various household formation strategies in function of differences in values cannot be pursued adequately10.
For three Latin American countries with large shares of post 1960s “new” cohabitation we can at least follow the trend over time with an interval of 15 years. Argentina and Brazil had WVS waves in 1991 and 2006, and Chile in 1990 and 1996, with a subset of questions being repeated. Several of these are of particular use for our purposes since they shed light on the changes occurring in the various age groups in values pertaining to ethics, gender relations, and secularization.
In table 4 we have brought together the WVS results for the 1990-91 and 2006 waves with respect to 5 ethical issues. For three broad age groups and both sexes we have measured the percentages that consider as inadmissible (“never justified”) the following actions: euthanasia, homosexuality, abortion, divorce and suicide. With the exception of abortion in Argentina and Brazil, there are major changes in the direction of greater tolerance, and in many, there is just about a landslide with reductions in the percentages “never justified” of 10 to over 50 percentage points. Furthermore, these changes are often just as large among the older men and women (50+) as among the younger ones.
Table 4.
Attitudinal changes in ethical issues in three Latin American countries, by age and sex, 1990-2006
| Men | Women | ||||||||||
|---|---|---|---|---|---|---|---|---|---|---|---|
|
| |||||||||||
| ≤ 29 | 30-49 | 50+ | Total | N | ≤ 29 | 30-49 | 50+ | Total | N | ||
| Never justified: Euthanasia | |||||||||||
| Argentina | 1991 | 43.3 | 53.4 | 62.0 | 53.6 | 453 | 46.8 | 57.1 | 72.2 | 59.9 | 491 |
| 2006 | 36.3 | 38.2 | 52.0 | 42.1 | 382 | 36.2 | 39.1 | 58.9 | 45.2 | 434 | |
| Chile | 1990 | 51.9 | 62.6 | 72.8 | 61.0 | 700 | 58.7 | 65.2 | 75.9 | 65.7 | 760 |
| 2006 | 25.7 | 34.1 | 48.9 | 36.7 | 411 | 35.1 | 33.0 | 50.0 | 39.4 | 510 | |
| Brazil | 1991 | 58.2 | 59.2 | 73.2 | 62.0 | 811 | 60.8 | 70.4 | 79.2 | 68.6 | 869 |
| 2006 | 41.4 | 48.8 | 47.1 | 46.0 | 611 | 50.4 | 50.3 | 56.3 | 51.9 | 855 | |
| Never justified: Homosexuality | |||||||||||
| Argentina | 1991 | 52.7 | 58.8 | 70.4 | 61.2 | 448 | 42.3 | 56.4 | 73.9 | 59.0 | 505 |
| 2006 | 24.8 | 27.5 | 50.4 | 33.5 | 400 | 16.7 | 23.9 | 40.5 | 27.6 | 449 | |
| Chile | 1990 | 71.8 | 75.6 | 83.6 | 76.1 | 703 | 71.4 | 77.5 | 86.2 | 77.6 | 774 |
| 2006 | 17.5 | 24.6 | 36.0 | 26.4 | 425 | 13.9 | 21.6 | 32.7 | 23.2 | 512 | |
| Brazil | 1991 | 74.7 | 70.1 | 84.9 | 75.2 | 888 | 57.6 | 62.3 | 76.6 | 63.6 | 867 |
| 2006 | 35.8 | 32.5 | 38.7 | 35.3 | 606 | 22.6 | 27.6 | 37.4 | 28.6 | 838 | |
| Never justified: Abortion | |||||||||||
| Argentina | 1991 | 45.0 | 39.1 | 50.0 | 44.6 | 446 | 38.3 | 39.9 | 58.2 | 45.9 | 518 |
| 2006 | 49.6 | 50.0 | 64.7 | 54.7 | 430 | 44.0 | 53.8 | 68.2 | 56.1 | 490 | |
| Chile | 1990 | 69.3 | 76.7 | 78.8 | 74.5 | 709 | 73.8 | 74.6 | 82.0 | 76.2 | 783 |
| 2006 | 43.0 | 53.7 | 63.8 | 54.2 | 432 | 49.6 | 53.6 | 72.1 | 58.9 | 533 | |
| Brazil | 1991 | 59.6 | 59.0 | 67.5 | 61.1 | 890 | 61.7 | 68.5 | 74.9 | 67.3 | 887 |
| 2006 | 55.8 | 65.0 | 62.7 | 61.5 | 613 | 59.5 | 65.6 | 68.5 | 64.5 | 866 | |
| Never justified: Divorce | |||||||||||
| Argentina | 1991 | 20.0 | 20.8 | 31.9 | 24.5 | 461 | 14.1 | 23.2 | 30.6 | 23.4 | 518 |
| 2006 | 13.5 | 16.8 | 24.8 | 18.3 | 427 | 9.9 | 13.4 | 21.2 | 15.2 | 499 | |
| Chile | 1990 | 36.4 | 49.5 | 50.3 | 44.8 | 707 | 42.0 | 44.3 | 58.8 | 47.3 | 780 |
| 2006 | 15.3 | 13.0 | 27.5 | 18.3 | 437 | 8.0 | 13.7 | 26.2 | 16.5 | 533 | |
| Brazil | 1991 | 28.8 | 26.5 | 42.2 | 30.9 | 883 | 25.1 | 32.6 | 45.5 | 32.6 | 881 |
| 2006 | 14.6 | 21.1 | 22.0 | 19.3 | 612 | 12.6 | 20.5 | 26.0 | 19.6 | 859 | |
| Never justified: Suicide | |||||||||||
| Argentina | 1991 | 76.7 | 80.1 | 84.7 | 80.8 | 458 | 78.9 | 81.4 | 89.4 | 83.7 | 496 |
| 2006 | 58.5 | 46.1 | 79.4 | 71.6 | 408 | 69.5 | 74.4 | 85.0 | 76.8 | 462 | |
| Chile | 1990 | 73.3 | 78.9 | 85.4 | 78.3 | 706 | 77.9 | 85.0 | 86.9 | 83.0 | 782 |
| 2006 | 48.2 | 60.0 | 65.7 | 58.7 | 426 | 52.6 | 61.5 | 75.0 | 63.8 | 517 | |
| Brazil | 1991 | 83.1 | 89.3 | 92.0 | 87.5 | 890 | 85.5 | 92.7 | 92.5 | 89.9 | 888 |
| 2006 | 64.9 | 77.8 | 79.7 | 74.3 | 619 | 71.2 | 78.1 | 78.7 | 76.2 | 864 | |
Source: Own tabulations of the 1990 and 2005 rounds of the World Values Surveys data files.
By far the largest change noted in all three countries is the increase in tolerance toward homosexuality. The percentages who consider this as “never justified” are halved or, as in Chile, have been reduced to a third or even a quarter of their 1990 levels. In addition, a similar landslide can also be noted with respect to euthanasia. It equally occurs in the three countries, among both sexes and in all age groups. The change is again most pronounced in Chile. The reductions in percentages rejecting suicide and divorce are more modest compared to the massive change in the previous two items, but still very substantial and found in all age groups. And, as noted above, only the attitudes toward abortion show a mixed picture, with greater tolerance emerging in Chile, but not in Brazil and Argentina. The latter exception notwithstanding, the data in Table 4 clearly indicate that a massive attitude change has taken place during the last two decades in favor of greater tolerance to forms of behavior or interventions that were largely tabooed before. This is obviously a cultural change which is entirely in line with what the theory of the “Second demographic transition” predicted.
The next set of items deals with secularization. The results for three sub-dimensions are given in Table 5: church attendance, roles of the church, and individual prayer. In all instances we measured the percentages who are at the secular end of the spectrum (no attendance, no prayer, church gives no answers). The results for the four items in Table 5 are very clear in the Chilean case: secularization has advanced to a remarkable degree and the trend is entirely in line with those described for the ethical issues in Table 4. The evidence for Argentina is more attenuated. There is a major increase in non-attendance, but a much more modest increase in doubts about the church being capable of addressing family issues and in men reporting no moments of private prayer or mediation. By contrast the church’s capacity to address social problems seems not to have suffered in Argentina.
Table 5.
Attitudinal changes regarding religion and secularization in three Latin American countries, by age and sex, 1990-2006
| Men | Women | ||||||||||
|---|---|---|---|---|---|---|---|---|---|---|---|
|
| |||||||||||
| ≤ 29 | 30-49 | 50+ | Total | N | ≤ 29 | 30-49 | 50+ | Total | N | ||
| Church attendance = never or less than once a year (%) | |||||||||||
| Argentina | 1991 | 45.6 | 33.0 | 30.8 | 35.2 | 275 | 31.5 | 18.1 | 26.0 | 24.0 | 383 |
| 2006 | 73.3 | 58.3 | 65.6 | 65.5 | 467 | 46.5 | 36.8 | 25.0 | 34.9 | 535 | |
| Chile | 1990 | 61.2 | 50.2 | 38.7 | 51.5 | 714 | 36.2 | 27.7 | 23.3 | 29.5 | 786 |
| 2006 | 76.1 | 55.9 | 55.7 | 61.1 | 425 | 47.9 | 39.2 | 23.8 | 36.2 | 542 | |
| Brazil | 1991 | 46.0 | 45.8 | 35.4 | 43.5 | 892 | 34.3 | 31.5 | 16.0 | 29.1 | 890 |
| 2006 | 38.5 | 38.7 | 34.3 | 37.3 | 624 | 25.7 | 21.9 | 19.9 | 20.9 | 870 | |
| Church gives answers to social problems (% No) | |||||||||||
| Argentina | 1991 | 72.6 | 72.3 | 56.8 | 66.8 | 407 | 68.3 | 62.6 | 48.7 | 55.4 | 448 |
| 2006 | 72.8 | 63.6 | 63.5 | 66.5 | 391 | 67.4 | 57.7 | 438 | 55.4 | 466 | |
| Chile | 1990 | 29.3 | 25.1 | 15.6 | 22.8 | 663 | 32.0 | 22.9 | 21.1 | 25.7 | 723 |
| 2006 | 70.3 | 57.9 | 55.3 | 60.4 | 407 | 57.0 | 51.5 | 44.1 | 50.3 | 509 | |
| Brazil | 1991 | 66.7 | 64.9 | 46.4 | 61.4 | 858 | 67.0 | 59.2 | 40.8 | 55.9 | 829 |
| 2006 | 64.4 | 50.2 | 48.8 | 54.3 | 606 | 56.2 | 54.4 | 44.6 | 52.4 | 842 | |
| Church gives answers to problems of the family (% No) | |||||||||||
| Argentina | 1991 | 60.0 | 62.3 | 44.1 | 55.5 | 407 | 54.4 | 47.7 | 39.4 | 46.6 | 465 |
| 2006 | 63.1 | 58.2 | 58.1 | 59.7 | 397 | 60.8 | 58.6 | 44.3 | 53.9 | 475 | |
| Chile | 1990 | 22.1 | 16.0 | 13.0 | 17.5 | 668 | 18.6 | 18.5 | 14.0 | 17.4 | 743 |
| 2006 | 59.6 | 47.9 | 43.9 | 49.9 | 413 | 51.9 | 42.9 | 38.7 | 43.7 | 517 | |
| Brazil | 1991 | 55.0 | 55.3 | 45.9 | 53.0 | 860 | 54.1 | 41.4 | 32.1 | 44.3 | 844 |
| 2006 | 34.2 | 29.0 | 26.5 | 29.9 | 608 | 27.2 | 27.0 | 25.2 | 26.6 | 854 | |
| Moments of prayer or meditation (%No) | |||||||||||
| Argentina | 1991 | 38.5 | 34.5 | 26.1 | 32.6 | 466 | 28.5 | 16.6 | 10.9 | 17.7 | 526 |
| 2006 | 44.6 | 34.2 | 32.7 | 37.0 | 462 | 23.6 | 14.4 | 6.6 | 14.1 | 532 | |
| Chile | 1990 | 27.0 | 18.2 | 14.4 | 20.5 | 706 | 16.3 | 8.9 | 2.0 | 9.7 | 784 |
| 2006 | 45.8 | 29.9 | 22.6 | 31.8 | 443 | 24.6 | 17.5 | 5.9 | 15.3 | 543 | |
| Brazil | 1991 | 15.5 | 15.1 | 10.0 | 14.1 | 887 | 13.9 | 6.4 | 3.0 | 8.6 | 886 |
| 2006 | 21.2 | 13.2 | 10.4 | 14.9 | 609 | 11.2 | 5.4 | 4.4 | 6.9 | 859 | |
Source: Own tabulations of the 1990 and 2005 rounds of the World Values Surveys data files.
The Brazilian outcome differs substantially from the previous two countries: the landslide toward greater ethical tolerance is not matched by advancing secularization. Compared to the 1990 WVS-round, the 2006 one indicates falling percentages of persons never or very rarely attending church and falling percentages of persons doubting the role of the church. In fact, there is a clear rise in the proportions thinking that the church has a role to play in family matters. Only the percentages without moments of prayer and meditation have not changed in any significant direction. Overall, the Brazilian lack of secularization is not in line with international trends11.
The results for four classic attitudinal items regarding family and gender are reported in Table 6. The Chilean results are again the most striking and totally in line with the expected trend: a sharp increase for men and women of all ages who consider marriage an outdated institution, a parallel decrease of respondents considering that a child needs both a father and mother, a marked increase of persons disagreeing with the statement that being a housewife is just as fulfilling (even among men), and a clear drop in the percentages stating that men should have priority when jobs are scarce. It should also be noted that the “feminist” shift is as pronounced among men as among women.
Table 6.
Attitudinal changes in issues regarding family and gender in three Latin American countries, by age and sex, 1990-2006
| Men | Women | ||||||||||
|---|---|---|---|---|---|---|---|---|---|---|---|
|
| |||||||||||
| ≤ 29 | 30-49 | 50+ | Total | N | ≤ 29 | 30-49 | 50+ | Total | N | ||
| Marriage is an outdated institution (% agree) | |||||||||||
| Argentina | 1991 | 13.5 | 11.4 | 4.8 | 9.6 | 460 | 13.7 | 10.5 | 4.4 | 9.2 | 502 |
| 2006 | 38.1 | 29.0 | 22.8 | 29.7 | 434 | 38.2 | 32.3 | 22.0 | 30.1 | 521 | |
| Chile | 1990 | 18.5 | 15.4 | 10.4 | 15.4 | 702 | 17.0 | 16.1 | 10.2 | 14.9 | 774 |
| 2006 | 42.4 | 26.6 | 23.3 | 29.8 | 433 | 39.3 | 29.6 | 22.3 | 29.6 | 530 | |
| Brazil | 1991 | 29.0 | 28.4 | 20.5 | 26.9 | 875 | 32.1 | 26.1 | 18.2 | 26.7 | 868 |
| 2006 | 30.4 | 21.8 | 19.2 | 23.4 | 619 | 17.7 | 19.6 | 19.7 | 19.1 | 871 | |
| Child needs home with father and mother (% agree) | |||||||||||
| Argentina | 1991 | 91.5 | 93.4 | 97.6 | 94.4 | 462 | 94.2 | 96.1 | 96.1 | 95.6 | 519 |
| 2006 | 83.7 | 93.6 | 98.0 | 92.0 | 449 | 79.6 | 80.3 | 89.9 | 83.6 | 518 | |
| Chile | 1990 | 93.5 | 93.6 | 98.2 | 94.6 | 708 | 89.5 | 90.1 | 94.1 | 90.9 | 781 |
| 2006 | 66.7 | 84.0 | 89.0 | 80.9 | 440 | 59.3 | 66.5 | 78.5 | 68.6 | 539 | |
| Brazil | 1991 | 89.8 | 92.2 | 96.5 | 92.2 | 890 | 82.0 | 80.9 | 94.0 | 84.3 | 885 |
| 2006 | 82.6 | 89.6 | 91.5 | 87.9 | 622 | 73.2 | 76.3 | 81.0 | 76.6 | 867 | |
| Being a housewife is just as fulfilling (% disagree + strongly disagree) | |||||||||||
| Argentina | 1991 | 42.9 | 39.0 | 44.8 | 42.1 | 401 | 54.6 | 46.6 | 28.9 | 42.6 | 496 |
| 2006 | 50.4 | 45.0 | 53.4 | 49.5 | 364 | 45.3 | 46.1 | 30.9 | 40.1 | 506 | |
| Chile | 1990 | 35.1 | 23.0 | 11.9 | 24.9 | 687 | 35.4 | 29.6 | 15.3 | 28.0 | 765 |
| 2006 | 48.3 | 43.3 | 24.3 | 38.4 | 419 | 55.4 | 44.7 | 31.9 | 43.0 | 542 | |
| Brazil | 1991 | 43.5 | 36.3 | 27.2 | 37.0 | 862 | 51.5 | 39.0 | 29.4 | 41.8 | 872 |
| 2006 | 51.9 | 40.7 | 39.3 | 43.8 | 601 | 58.7 | 53.6 | 45.3 | 53.0 | 869 | |
| Priority for men if jobs are scarce (% agree) | |||||||||||
| Argentina | 1991 | 25.2 | 23.1 | 31.1 | 26.5 | 471 | 13.1 | 21.8 | 29.8 | 22.2 | 517 |
| 2006 | 26.9 | 29.4 | 32.2 | 29.5 | 454 | 17.6 | 14.2 | 32.8 | 22.0 | 523 | |
| Chile | 1990 | 34.0 | 35.0 | 50.0 | 38.1 | 713 | 30.3 | 33.7 | 49.0 | 36.5 | 781 |
| 2006 | 24.0 | 28.9 | 41.4 | 31.6 | 446 | 21.1 | 19.8 | 32.8 | 24.6 | 548 | |
| Brazil | 1991 | 39.8 | 37.2 | 45.8 | 40.1 | 892 | 33.8 | 33.7 | 49.0 | 37.2 | 885 |
| 2006 | 26.2 | 19.9 | 33.1 | 25.6 | 624 | 10.6 | 20.1 | 27.5 | 19.2 | 870 | |
Source: Own tabulations of the 1990 and 2005 rounds of the World Values Surveys data files.
The Argentinean results again follow the Chilean pattern, but with more moderation. The increase in the percentages considering marriage an outdated institution is just as large, but the Argentinean public is still more convinced that a child needs both a father and mother. There are also mixed signals regarding gender equality: there is the expected increase in persons who disagree with the role of housewife being just as fulfilling, but there is no convincing decline in the opinion that men should have priority when jobs are scarce.
The Brazilian results with respect to the two family items are equally mixed, but different: there is no increase in the percentages considering marriage as an outdated institution, and even a drop among female respondents, but there is a systematic reduction in percentages considering that a child needs a complete parental family. The trend with respect to the gender items is more consistent: there is a rise in percentages disagreeing with the fulfilling nature of being a housewife and a clear drop in those giving men priority if jobs are scarce.
An overview of the attitudinal trends is given in Table 7. We have coded the presence of a strong trend which is furthermore consistently observed among both sexes and in virtually all age groups as “T”, and the presence of a weak or no trend as “t”. Similarly, upper case “F” denotes that the trend fits the direction that one would expect on the basis of the “second demographic transition” theory, whereas lower case “f” signals the lack of such a fit. The outcome is as follows for the 13 items used here:
The patterning for Chile is plainly consistent with what could be expected on the basis of the SDT-theory: there is a straight row of strong and consistent trends (TF) with respect to all values items.
In Argentina and Brazil, there are more exceptions. For these two countries respectively there are 3 and 6 outcomes that fail to fit expected directions (tf +Tf). In the Brazilian case, the exceptions are typically clustered around the topics of religion and abortion, and therefore basically reflect the lack of further secularization. For Argentina, however, the three non-fitting results are scattered, with one exception in each of the three sets of items.
The overall result is that a total of 28 strong and consistent TF combinations are found against 5 Tf cases with strong but inconsistent trends, and 6 more inconclusive tF or tf combinations.
Table 7.
Overview of findings concerning attitudinal changes over the period 1990-2006 in three Latin American countries.
| Argentina | Chile | Brazil | Total | |
|---|---|---|---|---|
| Rise in “marriage outdated institution” | T, F | T, F | T, f | |
| Decline in “child needs home with both father and mother” | T, F | T, F | T, F | |
| Decline in “being housewife just as fulfilling“ | t, F | T, F | T, F | |
| Decline in “priority to men if jobs are scarce” | t, f | T, F | T, F | |
| Decline in “never justified” | ||||
| Euthanasia | T, F | T, F | T, F | |
| Homosexuality | T, F | T, F | T, F | |
| Abortion | T, f | T, F | t, f | |
| Divorce | T, F | T, F | T, F | |
| Suicide | T, F | T, F | T, F | |
| Rise in absence of church attendance | T, F | T, F | T, f | |
| Decline in: church answers social problems | t, f | T, F | T, f | |
| Decline in: church answers family problems | T, F | T, F | T, f | |
| Decline in personal moments of prayer, meditation | t, F | T, F | t, f | |
| Number of T, F combinations | 8 | 13 | 7 | 28 |
| Number of t, F combinations | 2 | 0 | 0 | 2 |
| Number of t, f combinations | 2 | 0 | 2 | 4 |
| Number of T, f combinations | 1 | 0 | 4 | 5 |
| Total | 13 | 13 | 13 | 39 |
Note: “T” = strong trend; “t”= weak or not trend; “F”= trend fits the expected direction on the basis of the “second demographic transition”; “f” = trend does not fit the expected direction on the basis of the “second demographic transition”.
Source: own calculations with the World Value Surveys data.
The answer to the question of what flew under the radar can now be answered partially. The ethical dimension, far more than any other values dimension, has undergone very large shifts during the period under consideration. This lends strong support to the thesis that tolerance for various types of non-conformist behavior, including the rise of “new” cohabitation in Chile, Argentina and Brazil, has increased quite dramatically, and that as a consequence, the W or “willingness”-condition in the RWA-framework has ceased to be a limiting or bottleneck condition. In other words, it is reasonable to assume that the stigma against cohabitation among the better educated has been lifted in tandem with the de-stigmatization of euthanasia, homosexuality, divorce and suicide.
Obviously other changes that remain undocumented here could have equally contributed in creating more favorable R and A conditions for the Latin American cohabitation boom, but at least it is becoming clear that a cultural shift component is again a necessary (but not a sufficient) ingredient of a more complete explanation.
5. Discussion
The reconstruction of the share of cohabitation in the process of union formation of both men and women in some 350 Latin American regions indicates that there has been a real “cohabitation boom” taking place since the 1960s in some instances and accelerating during the 1990s in most. This holds particularly, but not exclusively, in areas which had relatively low levels of “old” or traditional cohabitation with a historical ethnic background. Hence, a sizeable part of the boom is due to “new” cohabitation. Moreover, the negative gradient of cohabitation with female education has been alleviated over time since the rise in cohabitation affected all educational categories, with the middle educational groups and the more educated catching up to a significant extent.
This raises the question whether or not this feature signals a partial convergence of Latin American countries to the European pattern of the so called “second demographic transition”. The discussion of this question has already emerged in the Latin American literature (Garcia and Rojas, 2001; Cabella et al., 2004; Rodriguez Vignoli, 2005; Quilodran, 2008; Castro Martin et al., 2011; Salinas and Potter, 2011; Covre-Sussai and Matthijs, 2010).
Two arguments are offered here in favor of such a convergence. Firstly, on the basis of both the negative cross-sectional gradient with education and the steep rises in female education, one would expect the share of marriage to gain importance, and not the share of cohabitation. Secondly, for three major countries with a sizeable increase in “new” cohabitation (Chile, Brazil, Argentina) data from two rounds of the World Values Studies show major changes, if not a landslide, in the direction of greater tolerance for previously tabooed behavior or actions, such as euthanasia, homosexuality, and suicide. Moreover, several other attitudes in favor of greater secularism, of non-conformist family arrangements, or more egalitarian gender relations emerged during the 15 year period documented by the WVS. These ideational changes, and particularly those in ethics, are indicative of the fact that the cohabitation boom has indeed developed in a context of growing individual autonomy and greater overall tolerance.
The findings with respect to the ideational factor of course do not exclude the distinct possibility that the Latin American cohabitation boom was equally a response to the turbulent economic conditions of the 1980s and early 90s, but clear indications for a neater correlation between these phenomena could not be found: some countries have a significant rise in cohabitation prior to the economic crisis, and for the others there is also no clear match between the size of the hyperinflation peaks or the average inflation rate and the size or pace of the cohabitation boom.
The expansion of cohabitation and of parenthood among cohabitants, or the “non-conformist transition”, is not the only hallmark of the SDT. The other major ingredient is the so called “postponement transition” with the shift to older ages of both nuptiality and fertility. In Western and Northern Europe, both the non-conformist and the postponement parts occurred more or less simultaneously. In advanced Asian industrial societies, the marriage and fertility postponement preceded the hitherto modest increase in cohabitation by three decades. A similar timing gap was witnessed in Southern Europe. The Latin American experience may just be the illustration of the reverse, with the non-conformist transition preceding the postponement one. If that proposition holds, we should now be looking out for rises in ages at first birth and further drops in fertility to below replacement level (cf. Rosero Bixby et al., 2009).
Last but not least, it should be stressed that cohabitation rose in just about all social strata, and in countries and areas with and without traditional forms of cohabitation alike. This seems to indicate that more specific factors, in addition to the more general ones considered here, could be operative in each of these settings. For instance, in which contexts do newly formed cohabiting couples continue to live with parents or other relatives in extended households, and in which settings are they more resembling the European model of neolocal trial marriage? A further scrutiny of such more context specific factors is therefore warranted to achieve a deeper understanding of the phenomenon.
Appendices
Table 8.
Sample characteristics
| Country | Year | Sample density | Women in union
|
Men in union
|
Type of unit | # Units | ||
|---|---|---|---|---|---|---|---|---|
| Age 25-29 | Age 30-34 | Age 25-29 | Age 30-34 | |||||
| Argentina | 1970 | 2,0% | 11,951 | 12,594 | 9,410 | 11,565 | Province | 24 |
| 1980 | 10,0% | 73,547 | 73,733 | 62,566 | 72,154 | Province | 24 | |
| 1991 | 10,0% | 108,866 | 119,285 | 90,369 | 113,934 | Province | 24 | |
| 2001 | 10,0% | 82,852 | 89,599 | 68,084 | 83,112 | Province | 24 | |
| Bolivia | 2001 | 10,0% | 21,002 | 20,533 | 18,001 | 19,275 | Department | 9 |
| Brazil | 1970 | 5,0% | 128,358 | 119,990 | 108,100 | 120,653 | State | 26 |
| 1980 | 5,0% | 175,376 | 152,298 | 157,046 | 157,778 | Meso-region | 137 | |
| 1991 | 5,8% | 248,620 | 245,327 | 210,307 | 238,203 | Meso-region | 137 | |
| 2000 | 6,0% | 269,940 | 288,332 | 229,222 | 275,801 | Meso-region | 137 | |
| Chile | 1970 | 10,0% | 21,923 | 20,134 | 18,653 | 19,269 | Region | 13 |
| 1982 | 10,0% | 31,884 | 30,151 | 27,873 | 29,992 | Region | 13 | |
| 1992 | 10,0% | 41,721 | 43,286 | 34,968 | 41,737 | Region | 13 | |
| 2002 | 10,0% | 34,803 | 42,994 | 27,592 | 39,349 | Region | 13 | |
| Colombia | 1973 | 10,0% | 47,046 | 42,346 | 34,580 | 38717 | Department | 30 |
| 1985 | 10,0% | 80,109 | 67,829 | 60,629 | 66113 | Department | 33 | |
| 1993 | 10,0% | 97,898 | 96,791 | 76,585 | 90675 | Department | 31 | |
| 2005 | 10,0% | 95,127 | 97,155 | 77,645 | 88833 | Department | 33 | |
| Costa Rica | 1973 | 10,0% | 4,430 | 3,970 | 3,790 | 4,032 | Province | 7 |
| 1984 | 10,0% | 7,380 | 6,591 | 6,616 | 6,749 | Province | 7 | |
| 2000 | 10,0% | 10,242 | 11,364 | 8,391 | 10,750 | Province | 7 | |
| Cuba | 2002 | 10,0% | 31,355 | 40,142 | 26,048 | 37,580 | Province | 15 |
| Ecuador | 1974 | 10,0% | 16,243 | 13,543 | 15,839 | 15,654 | Province | 21 |
| 1982 | 10,0% | 22,534 | 19,787 | 19,492 | 20,050 | Province | 22 | |
| 1990 | 10,0% | 28,991 | 26,605 | 23,770 | 25,744 | Province | 23 | |
| 2001 | 10,0% | 33,923 | 33,228 | 28,616 | 32,206 | Province | 23 | |
| Mexico | 1970 | 1,0% | 13,275 | 10,914 | 11,370 | 10,785 | State | 32 |
| 1990 | 10,0% | 251,282 | 231,777 | 209,584 | 216,167 | State | 32 | |
| 2000 | 10,6% | 311,063 | 300,694 | 260,268 | 276,893 | State | 32 | |
| Panama | 1970 | 10,0% | 3,921 | 3,384 | 3,307 | 3,169 | Province | 10 |
| 1980 | 10,0% | 5,412 | 4,991 | 4,347 | 4,916 | Province | 10 | |
| 1990 | 10,0% | 6,653 | 6,172 | 5,459 | 5,966 | Province | 10 | |
| 2000 | 10,0% | 7,953 | 8,047 | 6,580 | 7,600 | Province | 11 | |
| Peru | 1993 | 10,0% | 61,926 | 60,788 | 49,143 | 56,845 | Department | 25 |
| 2007 | 10,0% | 73,421 | 76,790 | 61,394 | 71,985 | Department | 25 | |
| Puerto Rico | 1970 | 1,0% | 740 | 654 | 606 | 600 | Country | 1 |
| 1980 | 5,0% | 4,326 | 4,560 | 3,799 | 4,336 | Country | 1 | |
| 1990 | 5,0% | 4,240 | 4,542 | 3,691 | 4,128 | Country | 1 | |
| Venezuela | 1971 | 10,0% | 27,616 | 24,586 | 22,828 | 24,653 | State | 24 |
| 1981 | 10,0% | 41,685 | 36,022 | 37,357 | 37,231 | State | 24 | |
| 1990 | 10,0% | 46,707 | 44,909 | 41,354 | 44,621 | State | 24 | |
| 2001 | 10,0% | 59,709 | 62,640 | 49,570 | 58,867 | State | 24 | |
Source: IPUMS International.
Map series 1.

Evolution of the share of cohabitation among all unions of women 25-29, various census rounds. (Depending on the journal, we’ll probably have to move to b/w shadings) Source: Own maps based on Latin American census microdata from IPUMS international.
Map series 2.

Cartogram representation of the evolution of the share of cohabitation among all unions of women 25-29, various census rounds. Areas of regions are proportional to their 2000 census round population size. Source: Own maps based on Latin American census microdata from IPUMS international.
Footnotes
See the Murdock-White “Ethnographic Atlas” and the Yale Human Relations Area files (eHRAF).
Compared to the European marriage pattern, these features put the indigenous populations squarely on the other side of J. Goody’s divide (J. Goody, 1976): the Indios were mostly populations where women brought in benefits for their own kin upon marriage, in contrast to the mostly Eurasian populations where they alienated property away from their kinship group (“diverging devolution” of wealth in Goody’s terms). In the latter case, the status of women is lowered and kinship groups resort to social class or lineage endogamy to retain some control over property alienated by women via marriage.
See for instance C. Rabell (1992) for illegitimacy rates by race in a 18th Century Mexican area.
See D.E. Borgess (1994) and J. Beierle (1999) for the Bahia upper class in Brazil, and A. Twinam (1999) for various Spanish speaking populations.
Age at union formation has remained remarkably stable in Latin America during the last few decades. This implies a process in which young cohorts substitute more and more non-marital cohabitation for marriage without modifying substantially the timing of union formation. Since we observe over time similar proportions of individuals in union by age, the rise of cohabitation among individuals aged 25-29 cannot be explained by changes in the timing of union formation.
Recently B. Perelli-Harris and her colleagues (2010, 2011) use the similar cross-sectional negative gradient of fertility among cohabiting women in Russia to infer that the rise in out-of-wedlock fertility has nothing to do with changing values as predicted by the “second demographic transition” but with increasing disadvantage of the less educated segments of the population. From the education gradient they infer that: “these findings suggest that non-marital childbearing in Russia has more in common with the pattern of disadvantage in the United States than with the second demographic transition” (2011:343). And furthermore: “…Thus, the educational gradient can provide information on how and why a particular behavior increases over time” (2010: 775). Moreover, the World Values Surveys of 1990, 1995 and 2006 for Russia show that there were quite dramatic shifts in ethics that parallel those found here in Latin American countries (e.g. the growing tolerance for homosexuality and euthanasia, the changing role of women, and duties of parents toward their children). These trends were not taken into consideration. Also, neither do the authors show how much the living conditions for their educational categories deteriorated and/or improved over the last decades. Finally, it should be stressed that the explanations that have been juxtaposed (economic disadvantage versus SDT) are not mutually exclusive. All of this amounts to the invalidation of their conclusion.
We distinguish four categories of educational attainment: “Some primary school”, “primary school completed”, “secondary school completed”, “more than secondary”. This classification corresponds to the major divisions of EDATTAN as harmonized by IPUMS-International (Esteve and Sobek 2003). EDATTAN takes as a reference the principles and recommendations of United Nations to measure educational attainment in population censuses (UNESCO, 2006). The UNESCO scheme is based on 4 thresholds: 6 years of primary school, 3 years of lower secondary education, 3 years of higher secondary education and later tertiary education. With some exceptions (see a detailed discussion in www.ipums.org/international) most Latin American countries conform to this scheme.
The cohabitation results for Mexican provinces in 2010 show that the preceding decade witnessed even larger increases than the three decades before. Hence the upward trend not only continued, but accelerated between 2000 and 2010 without an upsurge of inflation (i.e. between 3.6 and 6.4 percent p.a. between 2001 and 2010).
That problem is particularly important for countries where much cohabitation is of the “new” type. These countries are more similar to the European ones, for which the insertion of the “ever cohabited” question in the EVS revealed very stark contrasts in values orientations between married persons who ever and never cohabited (R. Lesthaeghe and J. Surkyn, 2002, 2004).
The analysis of V. Salinas and J. Potter (2011) of the Chilean data gathered among new mothers in maternities suffers precisely from such a muddling-up effect. The authors found no significant differences in a series of ethical items by currently married versus cohabiting status, and concluded that this was evidence for refuting the SDT hypothesis. However, the bulk of married women in their atypical sample could not be split up between those who had and did not have prior cohabitation experience. Furthermore, no time series data are presented on the ethics items, despite these being available online for the Chilean WVS rounds of 1990 and 2006. Our results presented in Tables 5 through 7 for a random sample (rather than a highly selective one) show precisely for these items that vast ideational shifts occurred in Chile between 1990 and 2006.
This finding begs the question whether the influence of Evangelical churches in Brazil has been stemming the overall secularization trend, or whether other factors are operative.
References
- Adsera A, Menendez A. Fertility changes in Latin America in periods of economic uncertainty. Population Studies. 2011;65(1):37–56. doi: 10.1080/00324728.2010.530291. [DOI] [PMC free article] [PubMed] [Google Scholar]
- Beierle J. Bahian Brazilians. Yale University Human Relations Area files; 1999. Excerpted in eHRAF World Cultures. electronic version. [Google Scholar]
- Binstock G. Cambios en la formacion de la familia en Argentina: cuestion de tiempo o cuestion de forma ?. Paper presented at the tirad Congress of the Latin American population Association (ALAP); Cordoba, Argentina. September 24-26.2008. [Google Scholar]
- Bittencourt M. Democracy, populism, and hyperinflation(s): Some evidence from Latin America. University of Pretoria: Department of Economics Working paper, nr. 169; 2010. [Google Scholar]
- Borges DE. The family in Bahia, Brazil, 1870-1945. Stanford CA: Stanford University Press; 1994. Also excerpted in eHRAF World Cultures. [Google Scholar]
- Cabella W, Peri A, Street MC. Dos orillas y una transicion ? La segunda transición demografica en Buenos Aires y Montevideo en perspectiva biografica. Paper presented at the first Congress of the Latin American Population Association (ALAP); Caxambu MG, Brazil. September 18-20.2004. [Google Scholar]
- Castro Martin T. Consensual unions in Latin America: the persistence of a dual nuptiality system. Journal of Comparative Family Studies. 2002;33(1):35–55. [Google Scholar]
- Castro Martin T, Puga D. Matrimonio versus union consensual en Latinoamerica: contrastes desde una perspectiva de genero. Paper presented at the third Congress f the Latin American Population Association (ALAP); Cordoba, Argentina. September 24-26.2008. [Google Scholar]
- Castro Martin T, Cortina C, Martin Garcia T, Pardo I. Centro de Ciencias Humanas y Sociales, Consejo Superior de Investigaciones Cientificas (CSIC) Madrid: 2011. Maternidad sin matrimonio en America Latina: un análisis comparativo a partir de datos centrales. Unpublished paper. [Google Scholar]
- Covre-Sussai M, Matthijs K. Socio-economic and cultural correlates of cohabitation in Brazil. Catholic University Leuven, Centre for Sociological Research, Leuven, Belgium; Paper presented at the 2010 Chaire Quételet Conference; Louvain-la-Neuve. 2010. [Google Scholar]
- Coale AJ. The demographic transition reconsidered. International Population Conference; Liège. International Union for the Scienticic Study of Population (IUSSP); 1973. pp. 53–72. [Google Scholar]
- De Vos S. Nuptiality in Latin America – The view of a sociologist and family demographer. University of Wisconsin Center for Demography and Ecology, Madison WI. 1998 CDE Working Paper 98-21. [Google Scholar]
- Esteve A, García J, McCaa R. La enumeración de la soltería femenina en los censos de población: sesgo y propuesta de correcció. Papeles de Poblacón. 2011;66:9–40. [PMC free article] [PubMed] [Google Scholar]
- Fussell E, Palloni A. Persistent marriage regimes in changing times. Journal of Marriage and Family. 2004;66:1201–1213. [Google Scholar]
- Garcia B, Rojas O. Cambio en la formacion y disoluciones de las unions en America Latina. Papeles de Poblacion. 2002;32:12–31. [Google Scholar]
- Garcia B, Rojas O. Las uniones conyugales en America Latina: transfomaciones familiares en un marco de desigualidad social y de genero. Notas de Poblacion. 2004;78:65–96. [Google Scholar]
- Goody J. Production and reproduction – A comparative study of the domestic domain. Cambridge UK: Cambridge University Press; 1976. [Google Scholar]
- Inglehart R. Culture shift in advanced industrial society. Princeton: Princeton university Press; 1990. [Google Scholar]
- Lesthaeghe R, Vanderhoeft C. US National Research Council. Diffusion processes and fertility transition – Selected perspectives. Washington DC: National Academies Press; 2001. Ready, willing and able : a conceptualization of transitions to new behavioral forms; pp. 240–264. [PubMed] [Google Scholar]
- Lesthaeghe R, Surkyn J. UNECE Economic survey of Europe, 2002-1. Geneva: UN Commission for Europe; 2002. New forms of household formation in Central and Eastern Europe. Are they related to newly emerging value orientations? pp. 197–216. [Google Scholar]
- Lesthaeghe R, Surkyn J. Values orientations and the second demographic transition (SDT) in Northern, Western and Southern Europe: An update. Demographic Research. 2004;S3(3) [Google Scholar]
- Lopez Ruiz LA, Esteve A, Cabré A. Distancia social y uniones conyugales en America Latina. Revista Latinoamericano de Poblacion. 2008;1(nr 2):47–71. [Google Scholar]
- Minnesota Population Center. Integrated Public Use Microdata Series International: Version 6.1. Minneapolis: University of Minnesota; 2011. Machine-readable database. [Google Scholar]
- Quilodran J. L’union libre en Amerique latine: aspects récents d’un phénomène séculaire. Cahiers Québécois de Démographie. 1999;28(nr 1-2):53–80. [PubMed] [Google Scholar]
- Quilodran J. Hacia la instalacion de un modelo de nupcialidad post transicional en America Latina?. Paper presented at the third Congress of the Latin American Population Association (ALAP); Cordoba, Argentina. September 24-26.2008a. [Google Scholar]
- Quilodran J. A post-transitional nuptiality model in Latin America?. Paper presented at the International Seminar on Changing Transitions to Marriage; New Delhi, India. September 10-12.2008b. [Google Scholar]
- Rodriguez Vignoli J. Union y cohabitacion en America Latina: modernidad, exclusion, diversidad? CELADE, Division de Poblacion de la CEPAL and UNFPA; Santiago de Chile: 2005. Serie Poblacion y Desarrollo 57. [Google Scholar]
- Roberts GW, Sinclair SA. Women in Jamaïca Patterns of reproduction and family. New York: KTO Press; 1978. [Google Scholar]
- Rosero Bixby L, Castro Martin T, Martin Garcia T. Is Latin America starting to retreat from early and universal childbearing ? In: Cavenaghi S, editor. Demographic transformations and inequalities in Latin America: Historical trends and recent patterns. Vol. 8. Latin American Population Association (ALAP) Serie Investigaciones; 2009. pp. 219–241. [Google Scholar]
- Ruiz Salguero M, Rodriguez Vignoli J. Familia y nupcialidad en los censos latinoamericanos recientes: una realidad que desborda los datos. CELADE, Division de Poblacion de la CEPAL and UNFPA; Santiago de Chile: 2011. Serie Poblacion y Desarrollo 99. [Google Scholar]
- Salinas V, Potter JE. On the universality of the second demographic transition and the rise of cohabitation and non-marital childbearing in Chile. Paper presented at the Annual Meetings of the Population Association of America (PAA); Washington DC. April 2.2011. [Google Scholar]
- Singh A, et al. Stabilization and reform in Latin America: A macroeconomic perspective on the experience since the early 1990s. 2005 Esp Chapter 2: Taking Stock. Occasional paper IMF nr 238. www.imf.org/external/pubs/ft/op/238_2pdf.
- Smith RT. The negro family in British Guyana – Family structure and social status in the villages. London: Routledge & Kegan Paul; 1956. [Google Scholar]
- Twinam A. Public lives, private secrets – Gender, honor, sexuality and illegitimacy in colonial Spanish America. Stanford CA: Stanford University Press; 1999. [Google Scholar]
- United States Census Bureau. Population by marital status, sex and age. Table 047 in International Data Base. 2004 http://www.census.gov/ipc/www/idbsprd.html.