Abstract
This paper describes the surface modification of macroporous membranes using ATRP (atom transfer radical polymerization) to create cation-exchange adsorbers with high protein binding capacity at high product throughput. The work is motivated by the need for a more economical and rapid capture step in downstream processing of protein therapeutics. Membranes with three reported nominal pore sizes (0.2, 0.45, 1.0 μm) were modified with poly(3-sulfopropyl methacrylate, potassium salt) tentacles, to create a high density of protein binding sites. A special formulation was used in which the monomer was protected by a crown ether to enable surface-initiated ATRP of this cationic polyelectrolyte. Success with modification was supported by chemical analysis using Fourier-transform infrared spectroscopy and indirectly by measurement of pure water flux as a function of polymerization time. Uniformity of modification within the membranes was visualized with confocal laser scanning microscopy. Static and dynamic binding capacities were measured using lysozyme protein to allow comparisons with reported performance data for commercial cation-exchange materials. Dynamic binding capacities were measured for flow rates ranging from 13 to 109 column volumes (CV)/min. Results show that this unique ATRP formulation can be used to fabricate cation-exchange membrane adsorbers with dynamic binding capacities as high as 70 mg/mL at a throughput of 100 CV/min and unprecedented productivity of 300 mg/mL/min.
Keywords: biotherapeutics, chromatography, ion-exchange, membrane adsorber, protein purification
1. Introduction
The global market for protein-based therapeutics is expected to grow at an average annual rate of 15% [1]. According to a recent market analysis by Goodman [2], the average share of biopharmaceuticals in the major prescription drug portfolios (MRDP) of the 14 largest pharmaceutical companies is estimated to increase to 40% in 2013. The drugs in the MRDPs are predicted to reach or exceed US $500 million in annual sales by 2013.
Commonly, a majority percentage of the total cost of manufacturing a biotherapeutic is attributed to the downstream recovery and purification process. To provide affordable drug treatments to patients, especially for chronic and high dose treatments, the biopharmaceutical industry needs highly productive unit operations in the downstream train.
Chromatography is a standard unit operation used industrially for the downstream processing of protein therapeutics. It often is used in the primary recovery step, where the goals are to reduce the processing volume and provide some level of purification by capturing the target protein, and in intermediate and final purification steps that result in a purified injectable therapeutic protein. Oftentimes, an expensive affinity chromatography medium is used for protein capture. In the case of monoclonal antibody (mAb) production, Protein A affinity resins are used as the selective material, with a cost that accounts for over half of the total material costs of purification [3]. Relative to other, non-affinity chromatography media, Protein A resins cost almost an order of magnitude more [4]. Within the last 10 years there have been efforts to replace Protein A chromatography with less-costly non-affinity methods, such as ion-exchange chromatography steps in series. One embodiment uses cation exchange (CEX), followed by anion exchange (AEX), and then hydrophobic interaction chromatography (HIC) [5,6] to significantly reduce purification costs. However, to achieve a high enough dynamic binding capacity for a single-cycle capture step using current resin beads, one needs to use low volumetric throughput (i.e., high residence time) [3], which limits productivity.
Membrane chromatography is one possible solution to achieve high dynamic capacity at high throughput in affinity and ion-exchange chromatography processes. As a result, there is a trend towards studies of adsorptive membrane technology for antibody purification [7]. Additionally, the possibility of using non-affinity membrane methods for protein capture and purification has been examined, such as through high-performance tangential-flow filtration [8]. Membranes also have been considered for use in a single-use purification process for the production of a mAb [9]. In this process, a CEX membrane adsorber is used in bind-and-elute mode following a precipitation/dissolution step. Polishing is done using AEX and HIC membranes.
The driver for consideration of membrane and monolithic adsorbers is that the mass throughput for larger biologics can be greater through a substrate with a more open pore structure, a defining characteristic that macroporous membranes have over resin beads [10]. Convection controls the transport of protein to the binding sites within the membrane, unlike the case with resin beads, where transport is controlled by the intra-particle diffusion. This presents the following advantages: dynamic binding capacities are independent of volumetric flow rate, high degrees of loading can be achieved with short residence times, and scale-up is made easier [11–13]. For the same reason, resolution in membrane chromatography can be higher than resin column chromatography under conditions of high loading [14].
Although the potential for utilizing membranes is significant, a technical barrier for broad implementation has been their lower binding capacities relative to resins, resulting from lower surface areas per unit volume. Recent work by our group and others has shown that this barrier can be overcome by grafting polymer tentacles from the pore surfaces of commercial membrane supports. Direct performance comparisons made between a tentacle-based anion-exchange membrane and a resin with the same anion-exchange functionality showed that the membranes possessed higher static and dynamic binding capacities and yielded higher peak resolution during product elution [14].
The structure of the grafted polymer layers is fundamental to optimizing protein binding capacity. For example, spacers and cross-linking methods have been shown to improve binding capacity of weak cation-exchange membranes modified with photo-grafted poly(acrylic acid)-based copolymers [15]. Polymer degree of grafting also impacts binding capacities [16–18]. Previous studies by our group have examined the role of nanolayer structure on protein binding using IgG from bovine serum [17]. Results indicated that having higher chain density (up to the maximum that could be achieved) enhanced membrane performance in bind-and-elute mode, rather than contributing to any size-exclusion effects for this important class of proteins. While there are a number of chemistries that can be used to attach polymer tentacles from membrane surfaces, we implement the grafting-from approach, which has advantages for controlling polymer layer structure [19].
Our group uses surface-initiated ATRP (atom transfer radical polymerization) and AGET (activators generated by electron transfer) ATRP [20] for reasons that have been discussed in detail previously [19,21]. ATRP has been used successfully in the development of membrane adsorbers for ion-exchange chromatography [14,15,17,18,21–26]. Noteworthy examples of cation-exchange membrane development using ATRP have come from Baker, Bruening, and coworkers [24,26] who prepared 2-(methacryloyloxy)ethyl succinate-modified membranes and obtained high static lysozyme binding capacities of 76 ± 8 mg/mL using a stacked membrane adsorber and 120 mg/L in single-membrane measurements with solution residence times of merely 35 ms. Menkhaus and coworkers [25] modified electrospun nanofiber membranes with poly(acrylic acid) nanolayers and obtained lysozyme binding capacities of 2.5 mg/mg membrane material with remarkably high permeance of 640 ± 80 L/(min m2 105 Pa).
Despite the success with ATRP in preparing cation-exchange membranes, there remain formulation challenges that could hinder commercial application. Specifically, while water is most suitable for dissolution of dissociated cationic monomers, there are unwanted side-reactions in water that include disproportionation (and loss) of the metal catalyst [2 Cu(I) → Cu(0) + Cu(II)] and complexation of the metal by the monomer anion. The former can be managed to some extent by proper selection of ligand [27] and the latter can be minimized by addition of an alkali salt [28]. Organic solvent systems avoid these undesired reactions, but the undissociated form of the monomer is needed for solubility, and the amine-based ligands commonly used in ATRP catalysts can form complexes with the undissociated acid monomer. An alternative method was described by Xu et al. [29] for solution-phase ATRP, in which a crown ether is used to coordinate the cation (e.g., potassium ion) of the charged monomer to aid in dissolution of the monomer in an organic solvent (where Cu(I) disproportionation largely can be avoided) and to prevent acid-base complexation between the monomer and the catalyst ligand. In this work, we adopted this strategy for the first time use in surface-initiated ATRP of strong cation-exchange polyelectrolytes from membrane surfaces.
The goals of this research were (A) to produce cation-exchange membranes with dynamic binding capacities that are competitive with current commercial products, and capable of higher productivity (mg product/mL/min); and (B) to evaluate the impact of membrane pore size on these metrics. Adsorptive membranes with varying pore size were prepared using surface-initiated ATRP to graft 3-sulfopropyl methacrylate, potassium salt (SPMAK) from regenerated cellulose macroporous membranes. Polymerization time was used to control the degree of grafting.
To inform the membrane modification work, kinetic studies of surface-initiated ATRP of SPMAK from silicon substrates were performed to measure the change in layer thickness with polymerization time. The purpose of the kinetic studies was to find an ATRP procedure (formulation and reaction conditions) that resulted in a consistent nanolayer thickness that would be acceptable for membranes with pore diameters from 0.2 to 1.0 μm after a reasonable reaction time (not more than 24 h).
2. Experimental method
2.1 Materials
Regenerated cellulose membranes with nominal pore sizes of 0.2, 0.45, and 1.0 μm were purchased from Whatman, Inc. The manufacturer reported thicknesses are 75 μm for 0.2 and 0.45 μm pore size membranes, and 70 μm for 1.0 μm pore size membranes. All membranes were 47 mm in diameter.
The following chemicals and solvents were purchased from Sigma-Aldrich (St. Louis, MO) with purities reported in weight percent: 2-bromoisobutyryl bromide (2-BIB, 98%); copper (I) chloride (99.995%); copper (II) chloride (99.999%); dimethylsulfoxide (DMSO, 99.9%); ethanol (99.5%); 1,1,4,7,10,10-hexamethyltriethylenetetramine (HMTETA, 97%); 1,4,7,10,13,16-hexaoxacyclooctadecane (18C6, 99%); hydrochloric acid (HCl, 37%, ACS grade) lysozyme (lyophilized powder, 90%); potassium chloride (99%); potassium hydroxide (pellets, ≥85%); 3-sulfopropyl methacrylate, potassium salt (SPMAK, 98%); and tetrahydrofuran, anhydrous (anhyd. THF, 99.9%). The following chemicals and solvents were obtained from Fisher Scientific (Fairlawn, NJ): chloroform (HPLC grade), hydrogen peroxide (98%, ACS grade), phosphate buffered saline 1X powder concentrate (Biotech Grade), tetrahydrofuran (THF, 99%), tris(hydroxymethyl)aminomethane (Tris-base), water (HPLC grade). 2-Bromo-2-methylpropionic acid (BPA, 98%) and sulfuric acid (96% in water) were purchased from Acros Organics (Geel, Belgium). Poly(glycidyl methacrylate) (PGMA, MW 290,000 g/mol) was from the School of Material Science and Engineering at Clemson University.
Three buffers were used in the bind-and-elute experiments. A 50 mM Tris-base solution was adjusted with HCl to pH 8 and used as the binding buffer (B). The elution buffer (E) was created by adding 1 M KCl to the binding buffer solution. The wash buffer (E2) was 0.3 M KOH. Distilled deionized water was obtained using a Milli-Q water purification system (EMD Millipore, Bedford, MA) and used to prepare all buffer solutions.
Single-side polished silicon wafers (1 cm × 3 cm) were purchased from Silicon Quest International (Santa Clara, CA).
Membranes were stained for confocal laser scanning microscopy (CLSM) with fluorescin-5-isothiocyanate Isomer 1 (FITC), purchased from Invitrogen (Eugene, OR), which has excitation/emission wavelengths of 494 nm/518 nm. VECTASHIELD® aqueous mounting medium was purchased from Vector Labs and used in mounting samples for CLSM. Type A immersion oil (Nikon) specific to the objective lens was used with the imaging system.
A phosphate buffered saline (PBS) solution (0.989 g/L) was prepared from the bioreagent 1X powder concentrate and modified to pH 8 with sodium hydroxide, anhydrous (NaOH, ≥ 97%, Alfa Aesar, Ward Hill, MA).
2.2 Silicon wafer surface modification
Silicon wafers were cleaned and surface functionalized with initiator-activated PGMA according to the methods described in the literature [22,30,31] with one minor adjustment: In this study, the solvent for the PGMA deposition was chloroform rather than methyl ethyl ketone.
Poly(SPMAK) was grown by ATRP from the functionalized silicon surfaces, as shown in Scheme 1. All masses and volumes are reported on the basis of one silicon wafer. The solvent used for polymerization was DMSO (19.2 mL). The monomer was SPMAK (405 mM, 1.91 g). Crown ether 18C6 (405 mM, 2.05 g) was added to the monomer solution. The monomer solution was deoxygenated using at least three cycles of the freeze-pump-thaw technique described previously (Bhut et al., 2008) with one modification: the headspace of the flask was evacuated continually to approximately 800 Pa. Following the final cycle, the solution was moved directly to an inert environment glovebox (MBraun UNIlab, O2 < 15 ppm, H2O < 1 ppm).
Scheme 1.
Reaction scheme for surface-initiated ATRP from initiator-activated substrates.
Two catalyst formulations were used. The first formulation used only Cu(I)Cl (1.6 mM, 3.05 mg) and ligand HMTETA (3.2 mM, 16.7 μL ). The second formulation used Cu(I)Cl (1.4 mM, 2.67 mg) and Cu(II)Cl2 (0.28 mM, 0.724 mg) in a 1.0:0.2 ratio with ligand HMTETA (3.3 mM, 17.3 μL). In both formulations, the total copper to ligand ratio was 1:2. Each catalyst complex was prepared in DMSO within the glovebox, sealed, removed from the glovebox, and placed in an ultrasonic bath for at least 2 h, until a transparent homogeneous solution was observed, indicative of a soluble catalyst complex. The solubilized catalyst complex was added to the deoxygenated monomer solution in the glovebox to make the ATRP solution.
Functionalized silicon wafers were placed into the ATRP solution and allowed to react for specified times. Wafers were removed and immersed in two sequential solutions comprising Cu(II)Cl2 (20 mM, 13.9 mg) and HMTETA (40 mM, 56μL) in DMSO (5.2 mL), which converts active chain ends to dormant species. The wafers were washed with DMSO, followed by HPLC water, dried with nitrogen gas, and the dry layer thicknesses were measured by ellipsometry. Wafers were returned to the reaction solution, where polymer growth continued until the next specified time.
2.3 Membrane surface modification
Two to eight membranes were modified at once; however, all mass and volume measurements are reported on the basis of one 47 mm membrane.
2.3.1 Membrane surface activation
Membranes were soaked in 10 mL of THF for approximately 10 min before use. Membranes were dried thoroughly to remove the solvent and moved to the glovebox, where the activation reaction was carried out. One 47 mm membrane was placed in a solution containing anhydrous THF (50 mL) and the initiator, 2-BIB (18 mM, 0.11 mL). The membranes were placed under a Teflon cage, with a stir bar on top. The solution was stirred gently at 35 °C for 2 h, at which time the solution was removed from the glovebox. Membranes were washed by immersion in 10 mL each of THF and ethanol for approximately 5 min, and stored in THF until polymerization.
2.3.2 Surface-initiated ATRP of 3-sulfopropyl methacrylate, potassium salt
An initiator-activated membrane was dried with a nitrogen stream and brought into the glovebox. A solution containing the solvent DMSO (19.2 mL), the monomer SPMAK (486 mM, 2.30 g), and the crown ether 18C6 (486 mM, 2.47 g) was prepared and stirred overnight, deoxygenated with the freeze-pump-thaw method, and brought into the glovebox.
The catalyst complex, composed of copper(I) chloride (1.9 mM, 3.70 mg) and HMTETA (6.8 mM, 35.8 μL), was prepared in deoxygenated DMSO as described in Section 2.2 and added to the ATRP solution. Initiator-activated membranes were placed in the ATRP solution for a specified period of time. To terminate the reaction, membranes were removed from the glovebox. After subsequent 10-min immersions in DMSO, HPLC water, and 0.2 M KCl (to remove the crown ether), membranes were stored in HPLC water until protein binding capacity measurements.
2.4 Surface characterization
2.4.1 Ellipsometry
The surface dry-layer thicknesses of poly(SPMAK) were measured using a multi-angle ellispometer (Beaglehole Instruments Picometer™, He-Ne laser, γ = 632.8nm). Measurements were taken at four locations on each surface. Refractive indices of 3.875, 1.455, 1.525, 1.451, 1.485 were used for silicon, silicon dioxide, PGMA, BPA, and poly(SPMAK), respectively, within the model. Igor Pro 4.0.9.1 (Wavemetrics, Oswego, OR) software program was used to apply the Cauchy model to obtain the dry layer thickness from the measured values of Ψ and Δ and the specified refractive indices.
2.4.2 ATR-FTIR
Fourier-transform infrared spectroscopy (FTIR) reflectance experiments were performed using a Thermo Scientific Nicolet 550 Magna-IR Spectrometer with a diamond ATR crystal. Omnic ESP version 6.1a software processed all measurements, using an automatic signal gain, 16 scans and a resolution of 4.0 cm−1. A background scan was collected immediately after each measurement. An ATR correction was applied to all spectra, and baselines were consistently corrected as needed.
2.4.3 Confocal microscopy
Samples for confocal imaging were prepared from membranes that had been loaded with lysozyme protein. Loading was done by passing protein solution through a bed of stacked membranes using an ÄKTA Purifier (GE Healthcare, Waukesha, WI) in the same manner as the dynamic protein binding experiments in Section 2.5.2. Membranes were dialyzed from buffer B into a 0.1X PBS buffer (pH 8) to remove dye-reactive amines from solution while maintaining the same pH and nearly the same ionic strength. Each 16 mm membrane was added to a solution comprising 200 μL of dye solution (FITC in anhydrous DMSO, 10 mg/mL) in PBS buffer (2000 μL) and incubated at 22 °C on a shaker bath for 1 h to allow the dye to react with bound lysozyme. Excess dye was removed by thoroughly rinsing the membrane with PBS buffer and then soaking it in PBS buffer for 1 h. Rinsed samples were placed on glass slides that contained 1–2 drops of VECTASHIELD® aqueous mounting medium (refractive index 1.44) and then covered with a cover glass. A poly(SPMAK) modified membrane with no protein served as a control, and underwent the same dying procedure.
Images were obtained using a Nikon Ti-Eclipse C1si confocal laser scanning microscope. All samples were first analyzed in reflectance mode, which facilitates proper focusing and positioning of the z-axis to correspond with the membrane surface. Samples were then analyzed in fluorescence mode with an argon laser excitation light source (488 nm) under consistent power settings and a Nikon CFI Plan Apochromat 60× TIRF oil immersion objective lens. NIS Elements and TiE EZ-C1 software programs were used to obtain and process images. Lateral x-y scans were performed 5 μm below the membrane surface on both the top and bottom membrane adsorbers within the 5-membrane chromatography stack. Digital images were 795 × 795 pixels, over a 512 × 512 μm area, acquired with an average of four scans.
2.5 Membrane performance testing
2.5.1 Direct-flow flux measurements
Constant-pressure direct-flow flux measurements were performed using distilled deionized water and a 50 mL stirred ultrafiltration cell (model 8050, EMD Millipore) stirring at 300 ± 50 rpm. Each 47 mm diameter membrane was cut to match the filtration cell diameter. The membrane was supported by Whatman 114 filter paper. Measurements were made at three constant transmembrane pressures (3, 6, 9 psi) applied from an air cylinder. The permeate mass was measured and recorded for a defined filtration time. Four measurements at each pressure were made in order of increasing pressure: 3, 6, 9 psi, and then repeated in order of decreasing pressure to check for compaction that may occur at higher pressures. Data reported are averages of the measurements taken at each applied pressure. No correction was made to account for the system resistance, as it represents ≤3% of the total flow resistance and is not significant within the uncertainty of the permeability measurements.
Constant-flux measurements were performed using distilled deionized water and an ÄKTA Purifier. A set of five (16 mm diameter) membranes was loaded into a Mustang Coin® unit (Pall Corporation, Port Washington, NY) and placed as a column in the ÄKTA Purifier. Volumetric flow was varied from 1.28 mL/min (50 cm/h) to 13.47 mL/min (530 cm/h). System pressure was recorded by the ÄKTA Purifier. The pressure-flow rate relationship was evaluated under these conditions, which are representative of the flow velocities using packed-bed columns.
2.5.2 Protein binding capacity measurements
Dynamic Protein Binding. Membranes were soaked in binding buffer B for 5 min before use. Five membranes of identical pore size and degree of modification were loaded into a Mustang Coin® module. A filter paper (Whatman 5) was placed on each side of the stack. The column was inserted in the ÄKTA Purifier. After an initial system equilibration with buffer B, approximately 10 column volumes (CV) of buffer B were pumped through the column, followed by a 10 mL injection of protein solution (3 mg/mL lysozyme in buffer B, filtered with Whatman 0.1 μm PTFE syringe filter). Unbound protein was washed from the column using 7 CV of buffer B, followed by a step change to 20 CV of the buffer E to elute the bound protein. Between each run, the column was regenerated with 2 CV of buffer E2, followed by re-equilibration with buffer B before the subsequent run. Binding capacities for each membrane were obtained at flow rates ranging from 1.0 mL/min (39 cm/h) to 7.7 mL/min (300 cm/h). Data were recorded and processed by Unicorn 5.1 software (GE Healthcare, Bio-sciences).
Protein breakthrough curves were recorded using UV absorbance at 280 nm. To determine the breakthrough profile under non-binding conditions, the protein in 0.3 M KOH solution was pumped through a modified membrane stack. Caustic solutions commonly are used to regenerate ion-exchange columns. Under these conditions, lysozyme has a net negative charge that minimizes Coulombic interactions. If present, any protein that binds under these conditions via hydrophobic interactions would delay breakthrough, and yield a larger void volume measurement. Thus, calculated dynamic binding capacity values are conservative. Comparing the breakthrough curve obtained under binding conditions to the breakthrough curve obtained during non-binding conditions allows for the calculation of the dynamic binding capacity. The area between the curves was measured at the point of 10% breakthrough (i.e., C/C0 = 0.10), consistent with the point where protein loading typically would be stopped.
Static Protein Binding. Modified membranes were equilibrated in buffer B and then placed in 40 mL jars (I-Chem short, wide-mouth, Fisher Scientific) containing 20 mL of lysozyme solution at varying concentrations in buffer B. The jars were placed on a shaker bath (50 rpm, 22 °C) for 24 h, which was determined by experiment to be enough time to reach equilibrium. A calibration curve between UV absorbance and concentration was used to measure the final concentration, and a mass balance (accounting for the mass of pure B initially in the membrane) was used to determine the total mass of adsorbed protein per volume membrane (mg/mL). After measurement, membranes were submerged in buffer E2 for 1 min, followed by buffer E overnight, and then equilibrated in buffer B in preparation for the next static binding experiment.
3. Results and discussion
3.1 Graft-from surface modification using ATRP
The choice of catalyst, solvent, and temperature strongly influences the polymer produced by atom transfer radical polymerization [32]. A Cu(I)Cl/HMTETA catalyst complex was selected to balance activity versus potential for copper disproportionation [27]. To further reduce the risk of disproportionation, dimethyl sulfoxide was used as the solvent, which has been shown to be an effective solvent for the copper-mediated ATRP of methacrylates at ambient temperatures [33]. 3-Sulfopropyl methacrylate, potassium salt was used to prevent deactivation of the catalyst by complexation between the amine ligand and an acid monomer. To facilitate dissolution of the monomer salt, we utilized the method employed by Xu et al. [29] in their work on solution-phase synthesis of SPMAK bottle brush polymers, which used a crown ether to coordinate with the potassium cation.
3.1.1 Silicon wafer surface modification
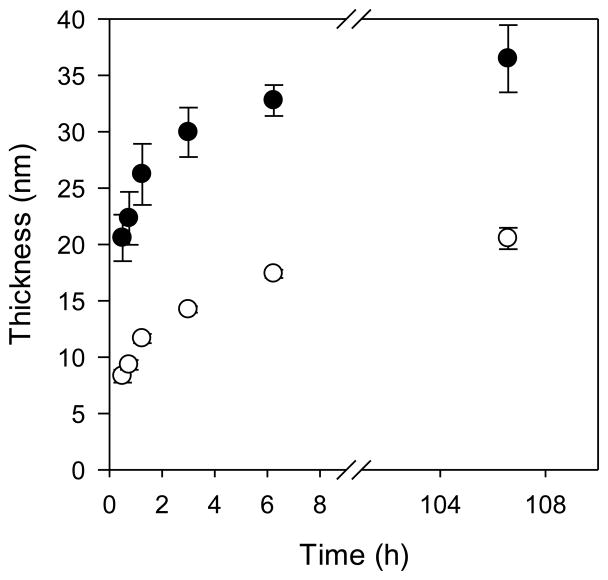
Silicon surfaces, coated with PGMA and activated with a BPA initiator, were used as model surfaces for growing poly(SPMAK). Polymerization times ranged from 0.5 to 106 h. The purpose of these experiments was to measure the polymer dry layer thickness over time and to use these measurements to inform the choice of reaction time and reaction conditions for the polymerization from membrane surfaces.
Figure 1 shows dry layer thicknesses as a function of polymerization time. The formulation containing the deactivator Cu(II)Cl2 was used in an effort to yield controlled polymerization and achieve high degrees of polymerization. As expected, the formulation that contained Cu(II) slowed the chain growth; however, it did not improve control (evidenced by a non-linear relationship between thickness and time) and resulted in lower dry layer thicknesses (i.e., lower degrees of polymerization). Because higher degrees of polymerization correlate with higher binding capacities, a 24 h polymerization time was selected using the Cu(I)Cl catalyst system, targeting a dry layer polymer thickness of 35 nm. More work can be done to optimize polymer formulation, but this was outside the scope of this initial study.
Figure 1.
Poly(SPMAK) growth from functionalized silicon wafers using two different catalyst formulations: (●) Cu(I)Cl at 1.6 mM and (○) Cu(I)Cl:Cu(II)Cl2 with concentrations of 1.6 mM:0.3 mM. Data are the average of four measurements from one wafer chip, with error bars as the standard deviation.
3.1.2 Membrane surface modification
It has been demonstrated that surface-initiated ATRP can be used to modify membranes to create effective anion-exchange adsorbers for use in membrane chromatography [14]. The work presented here applies this method with a specialized formulation to prepare high-performance cation-exchange membrane adsorbers by grafting SPMAK monomer from the surface of RC membranes. Nominal membrane pore diameter and polymerization time were changed to investigate the effects of each variable on membrane performance. Membranes of three pore sizes (0.2, 0.45, 1.0 μm) were modified for comparison. Attenuated total reflectance Fourier-transform infrared (ATR-FTIR) was used to confirm membrane surface modification. Flux/pressure measurements and static and dynamic binding capacity measurements were used to evaluate membrane performance. Confocal laser scanning microscopy (CLSM) was employed to image the interior of lysozyme-loaded membrane stacks.
3.2 ATR FTIR
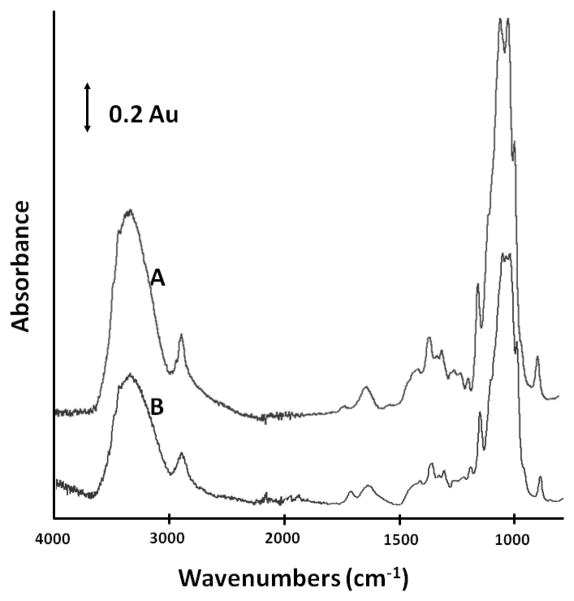
Figure 2 shows the ATR-FTIR spectra of unmodified and poly(SPMAK)-modified RC membranes. In spectrum B for the poly(SPMAK)-modified membrane, a more pronounced peak is observed at 1700 cm−1, which represents the C=O of the methacrylate within the polymer. The diminished peak at 3300 cm−1 is attributed to the reduced number of -OH groups on the membrane surface compared to the unmodified membrane (A). This reduction is due to the conversion of hydroxyl groups to alkoxy linkages at the base of the polymer chains, as well as the obstruction of the cellulose surface by the layer of grafted polymer. The peak assignments for stretching sulfonate bonds (S=O, asym: 1350 cm−1, sym: 1175 cm−1; S-O 1000-750 cm−1) occur within the characteristic bands of cellulose, and thus are not resolved.
Figure 2.
ATR-FTIR spectra of regenerated cellulose (A) base membrane with no modification and (B) membrane modified with SPMAK for 24 h.
3.3 Performance of modified membranes
Static (a.k.a. equilibrium) protein binding capacities, relationships between flow rate and dynamic binding capacities, and membrane permeabilities were measured. As improvements in one metric may present a decline in another, it is necessary to analyze all of these metrics to gain understanding of the overall performance of these newly developed cation-exchange membrane adsorbers.
The optimal range for lysozyme to bind with negatively charged groups occurs between a pH of 6–9 [34], making the selection of pH 8 appropriate for binding capacity measurements. The isoelectric point of lysozyme is 11; thus, the protein is charged positively [35]. The pKa of SPMAK is below 3, meaning the polymer is charged negatively at the pH of buffer B, enabling charge interactions between the protein and polyelectrolyte chains [36].
3.3.1 Static binding capacities
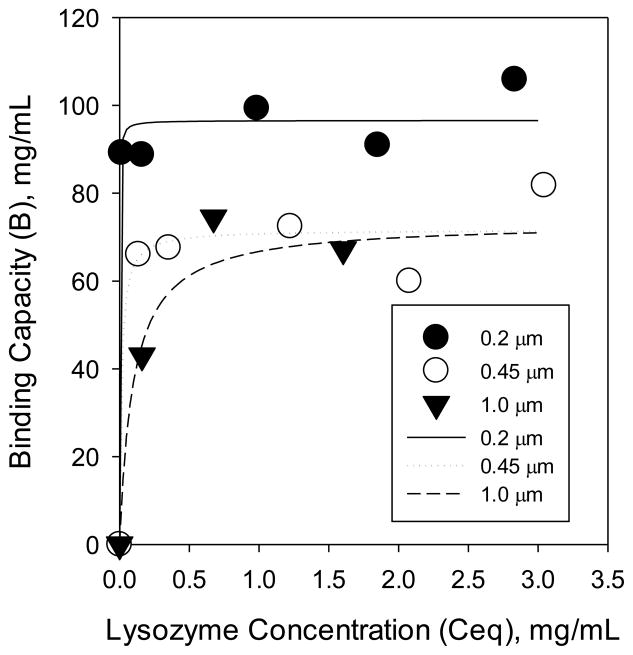
Static binding capacity measurements reveal how the membrane pore size affects equilibrium protein binding. Our hypothesis was that membranes with different nominal pore sizes should have different binding capacities for the same polymerization time as a result of different surface area per volume. Specifically, we hypothesized that with decreasing pore size, the surface area to volume of the membranes would increase, resulting in more initiation sites, and, thus, more chains for protein binding. We measured the maximum capacity of lysozyme adsorbed by the modified membranes. Figure 3 shows lysozyme adsorption isotherms for 0.2, 0.45, and 1.0 μm membranes, modified with poly(SPMAK) using a 24 h polymerization. Symbols represent experimental data and curves represent fits to the Langmuir adsorption isotherm model. While the mechanism for ‘adsorption’ really is ion exchange, the Langmuir isotherm works well because the system is buffered to maintain a constant pH. As is common for ion-exchange adsorbers, a steep adsorption isotherm is observed. The tested membranes appear to have a similar binding constant (K) but different levels of maximum binding capacity (Bmax): Bmax_0.2μm = 97 ± 3 mg/mL, Bmax_0.45μm = 72 ± 5 mg/mL, Bmax_1.0μm = 79 ± 8 mg/mL.
Figure 3.
Adsorption isotherms at 25 °C for lysozyme on 1.0, 0.45, and 0.2 μm poly(SPMAK)-modified membranes. Equilibrium concentrations were measured at 24 h.
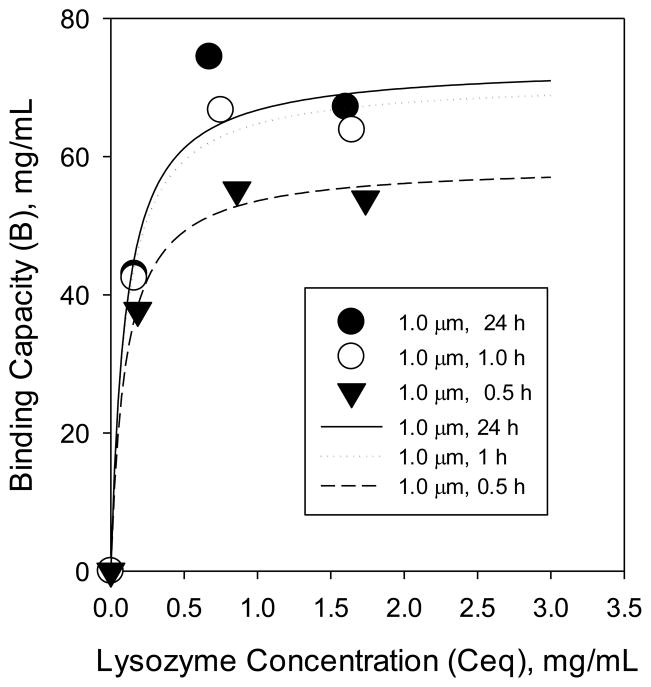
Figure 4 shows the effect of polymerization time on static capacity using the 1.0 μm membrane. Longer reaction times, and thus, higher degrees of polymerization yield higher maximum binding capacities (Bmax): Bmax_1.0μm_0.5h = 59 ± 2 mg/mL, Bmax_1.0μm_1.0h = 71 ± 4 mg/mL, Bmax_1.0μm_24h = 79 ± 8 mg/mL. The non-linear relationship between polymerization time and static capacity mimics the non-linear relationship between polymerization time and nanolayer thickness from the silicon substrate work. The proportionality of polymer chain length to binding capacity is consistent with earlier works [22,23].
Figure 4.
Adsorption isotherms at 25 °C for lysozyme on 1.0 μm membranes with various degrees of polymerization. Equilibrium concentrations were measured at 24 h.
3.3.2 Dynamic binding capacities
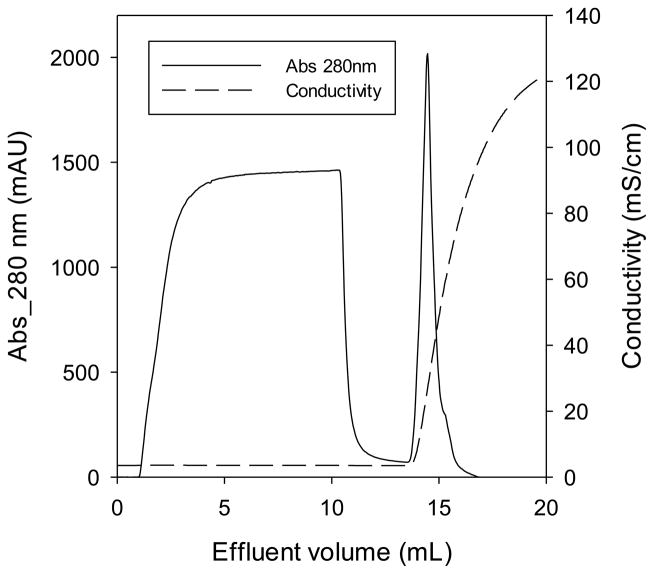
Figure 5 shows a representative chromatogram. After loading the column into the ÄKTA Purifier, binding buffer B was pumped through the system to equilibrate the column. After equilibration, a 50 mL Superloop (GE Healthcare) was used to deliver 10 mL of 3 mg/mL protein solution. Data collection began at the time of injection. The initial baseline absorbance reading indicates that protein is binding to the column. As the membrane bed capacity is reached under dynamic conditions, the unbound protein begins to break through the column, illustrated by the initial increase in absorbance on the chromatogram. After rinsing the column, a step change was made to elution buffer E. The increase in ionic strength caused the charge interactions between protein and column to be screened, causing the protein to release from the column, evidenced by the elution peak starting at about 14 mL. The volume at the point of 10% breakthrough (Vbreak) was used in Equation 1 to estimate dynamic binding capacity:
| (1) |
where q is the dynamic binding capacity (mg/mL), C0 is the concentration of protein in solution (mg/mL), Vdead is the system dead volume (mL), and CV is the column volume (mL). The dynamic binding capacities were analyzed with regards to flow rate and pore size, and are discussed in the following sections.
Figure 5.
Typical chromatogram for a dynamic protein binding capacity measurement using poly(SPMAK)-modified membranes. The chromatogram was obtained using 1.0 μm average pore diameter membranes (bed height: 350 μm; bed volume: 0.070 mL; flow rate: 1 mL/min; buffer B: 50 mM Tris, pH = 8; buffer E: 1 M KCl in 50 mM Tris, pH = 8).
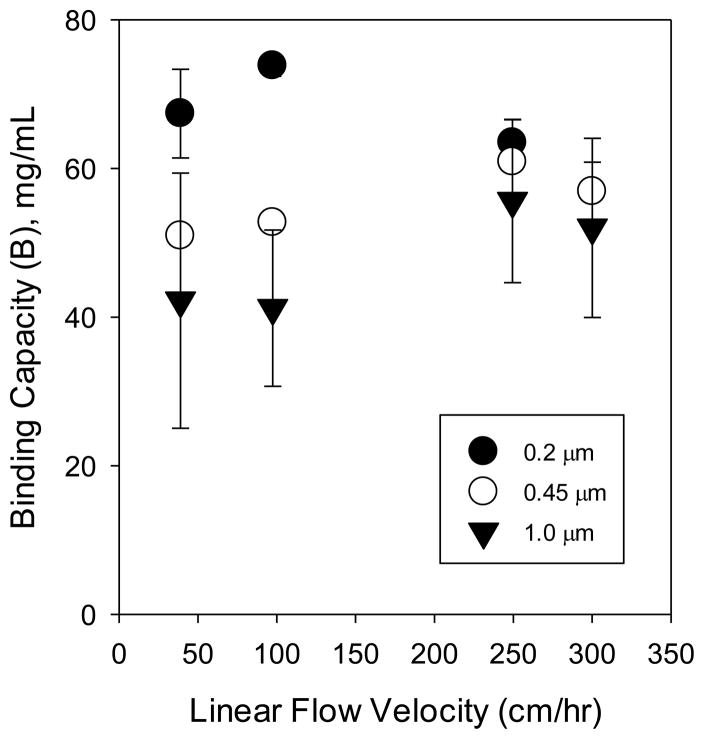
Each membrane column was tested at four flow rates. Figure 6 presents the results, which show that dynamic binding capacities were constant within the measurement uncertainty over the range of flow rates examined. Studies on the mass transfer properties of membrane adsorbers have shown that diffusion does not govern the transport of protein molecules to pore channels within the membrane [13,37], including studies of ion-exchange membrane adsorbers of 1.0 μm pore size after modification with polymer chains [23]. Thus, it is expected that the flow rate should not govern the dynamic binding capacities. However, it is recognized that the geometric properties of columns can create a non-uniform flow distribution at the inlet, giving the effect of an increased dynamic binding capacity as flow rates are increased at low velocities. This phenomenon has been described previously [23]. Non-uniform flow distribution at low velocity may also partly explain the larger error bars at low velocity. At a high enough flow velocity, the characteristic time required for film diffusion will become larger than the residence time for flow through the column, and a decline will be observed in dynamic binding capacity. This trend is not observable within the error of our measurements over the range of flow rates studied.
Figure 6.
Dynamic binding capacities of 0.2, 0.45, and 1.0 μm membranes, modified with poly(SPMAK) using a 24 h polymerization time with a Cu(I)Cl/HMTETA catalyst complex. Values were obtained based on 10% breakthrough. Error bars represent the standard deviation of calculated values using data from 2 to 4 measurements.
Breakthrough curves exhibited the typical S-shape characteristic of favorable binding within a packed bed. As expected, dynamic binding capacities were lower than static binding capacities. Among the factors that impact the difference between dynamic and static capacities are chromatodiffusion, a broad pore-size distribution, and load-dependent binding kinetics. A broad pore-size distribution leads to inefficient utilization of the membrane because pores of different sizes have different solute residence times and capacities. The result is that breakthrough curves broaden as pore-size distributions broaden [38]. These effects may be different for membranes of different nominal pore sizes, which may lead to the relative differences that we see between dynamic and equilibrium capacities observed for the membranes of different pore sizes.
Throughout the dynamic binding capacity experiments, each membrane stack was loaded, cleaned and washed at least 7 times. There was no observed decline in dynamic binding capacity throughout the experiments, indicating there was no apparent degradation of the adsorptive material in this study.
3.3.3 Distribution of bound protein
Confocal laser scanning microscopy was used to visualize the distribution of bound protein within the membrane stack. The objective of this experiment was to determine whether or not protein binding occurs uniformly throughout the membrane stack during dynamic loading. Lysozyme-loaded membranes were removed from the module and contacted with FITC dye to fluorescently label adsorbed protein. Staining was done after protein loading, because there is evidence that the binding affinities of labeled proteins can be different than those of non-labeled proteins [39,40] due to their difference in net charge.
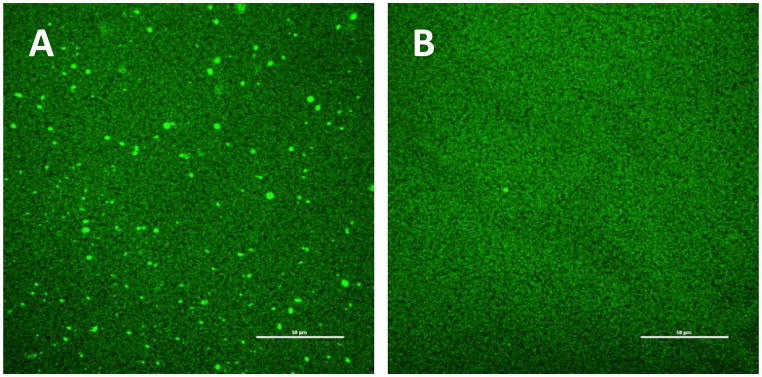
Measurements were done with a stack of 0.45 μm membranes. Figure 7 shows the top and bottom membrane within the five-membrane stack after loading fully. From the top membrane image, it appears that some protein aggregates were present even after prefiltering the protein solution through a 0.1 μm PTFE prefilter, and that these were captured by the first membrane in the stack. The intensity of the FITC-tagged protein is consistent on the top and bottom membranes, indicating that binding occurs uniformly throughout the column.
Figure 7.
Confocal images of the top (A) and bottom (B) membranes (0.45 μm) from a five-membrane stack, fully loaded under flow-through conditions with 3 mg/mL lysozyme and stained with FITC. The scale bar represents 50 μm.
3.3.4 Direct-flow flux measurements
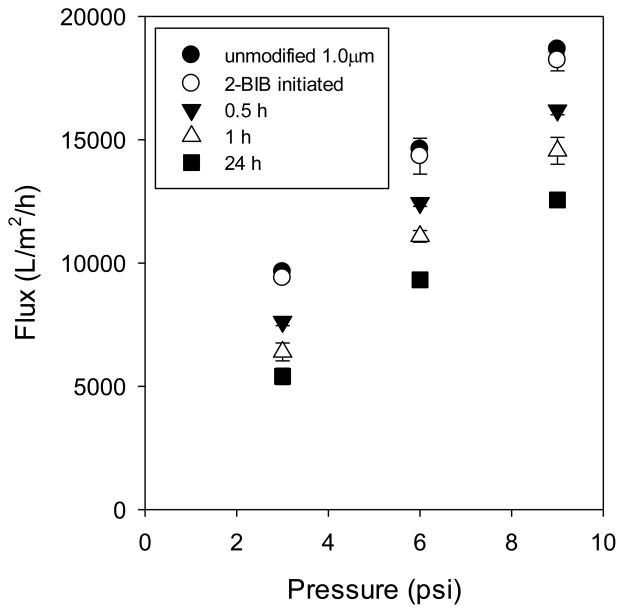
Figure 8 shows constant-pressure flux measurements for the 1.0 μm membranes modified under various conditions (unmodified, initiator-activated, polymer-modified using reaction times of 0.5, 1.0 and 24 h). A linear increase in flux is observed as the pressure is increased. This profile is expected in the absence of membrane fouling using distilled deionized water with no compaction. There appears to be little to no compaction occurring over the range of pressure studied, as there is no hysteresis in the flow measurements. Symbols represent averages of all data collected before and after the highest pressure was applied, with error bars representing the standard deviation.
Figure 8.
Direct flow flux data for 1.0 μm membranes: base membrane; initiator-modified; polymer-modified using 0.5 h, 1 h, 24 h polymerization times. Points represent averages of 4 to 8 measurements, with error bars representing the standard deviation. Low pressure measurements were done before and after the highest pressure (9 psi) was applied.
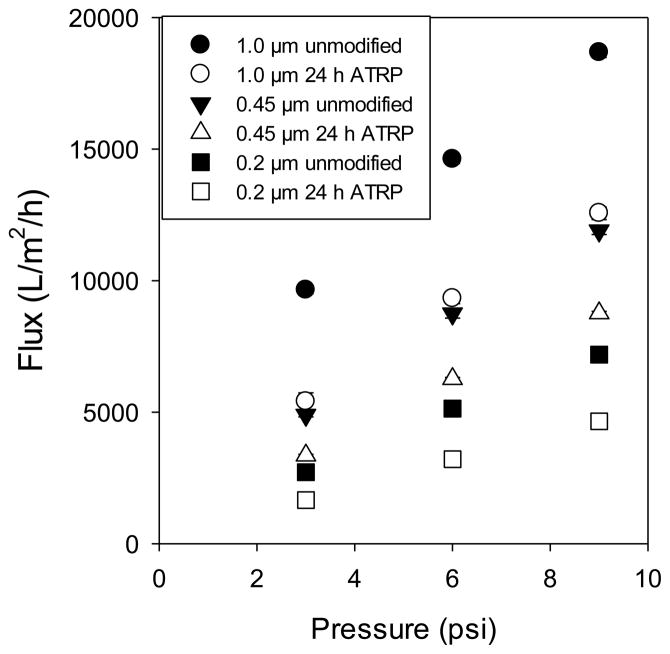
Figure 9 compares direct-flow flux data for all membranes following 24 h modification with poly(SPMAK). The difference in permeability for the different membrane substrates is observed. The pure water flux retention (i.e., the quotient of poly(SPMAK) membrane flux to base membrane flux) over an average of all tested pressures is 63 ± 2%, 71 ± 3%, and 62 ± 6% for the 0.2, 0.45, and 1.0 μm membranes, respectively. Reduced flux is attributed to polymer chains reducing the effective pore diameter. If the membranes are modeled as having uniform cylindrical pores and the dry-layer poly(SPMAK) thickness measurements are applied, the cross-sectional surface area of the pores is reduced to 45%, 73%, and 87% of the original area for the 0.2, 0.45, and 1.0 μm membranes, respectively. Under the tested conditions, the polymer chains are expected to be swollen and extending beyond the dry layer thickness. The observed flux decline is reasonable according to this simple model. Curiously, however, the reduction in permeability is nearly constant for membranes with different pore sizes. One possible reason is that there may be a lower rate of polymerization within smaller pores. This trend has been observed and quantified by our group in a previous publication [41]. While the flux declines appreciably for the modified membranes, they still retain the permeability of macroporous materials.
Figure 9.
Pure water flux measurements for unmodified base membrane and the poly(SPMAK)-modified membrane after 24 h reaction.
Constant-pressure measurements of membrane permeability taken with the direct-flow cell were compared with values from constant-flux experiments using membrane stacks within the ÄKTA Purifier. The percent difference between the permeability obtained from the constant-pressure and the constant-flux permeability measurements is 5%. This result indicates that the direct flow measurements are suitable for understanding how these membranes operate in a separation column.
Together with the observed differences in dynamic binding capacity for these membranes, characteristics can be selected to achieve the desired operating and production requirements. In other words, equipped with membranes with a range of pore sizes and polymer degrees of polymerization enables one to design the separation system with a specific aim, such as reducing pressure drop, or maximizing binding capacity. Because lowering the cost of therapeutics is the ultimate goal, we strive to maximize productivity (mg product/mL/min). Therefore, in addition to capacity and volumetric flow, we must compare the total number of column volumes processed per time.
3.3.5 Analysis of volumetric productivity
The metric of productivity is extremely important in evaluating processing technologies and comparisons can be made in terms of volumetric processing rates as well as mass of product produced per volume adsorbing material per time. Thus, volumetric throughput (CV/min) and dynamic binding capacity (mg/mL) are used as the bases for this comparison. Table 1 shows the volumetric throughput (CV/min), residence time (min), and productivity (mg lysozyme/mL/min) for select conditions of these cation-exchange membranes and the Capto S resin column, a current commercial product. Solution conditions (pH, ionic strength, protein concentration) were chosen to match those used by the manufacturer in evaluating Capto S performance. Upon personal correspondence with GE Healthcare Life Science, technical support group at Piscataway, we later discovered that the conditions reported in the product literature [42] were incorrect and should have been reported as 30 mM sodium phosphate buffer at pH 6.8 (as reported in a separate GE document [43] with lysozyme concentration of 4 mg/mL. Fortunately, the results are still comparable as the protein and buffer concentrations are similar, and both pH values are well below the pI of lysozyme where the protein remains positively charged. Furthermore, our use of a lower protein concentration of 3 mg/mL yields more conservative productivity values for our membranes. Even at low linear flow velocities, membrane adsorbers offer higher volumetric throughput and residence times that are 100-fold less than commercial resin columns. The productivity, representing the mass protein that can bind per volume adsorbing material per time, is another way to compare experimental results with commercial products. Productivity is calculated according to Equation 2
Table 1.
Productivity comparison for cation-exchange membranes and commercial Capto S resin column (Capto S, Capto Q, Capto ViralQ, Capto DEAE, 2011).
| Separation Medium | Superficial velocity (cm/h) | Throughput (CV/min) | Residence time (min) | Dynamic binding capacity (mg/mL) | Productivity (mg/mL/min) |
|---|---|---|---|---|---|
| 1.0 μm RC poly(SPMAK) | 300 | 100 | 0.01 | 52 ± 12 | 330 ± 80 |
| 0.45 μm RC poly(SPMAK) | 300 | 100 | 0.01 | 57 ± 1 | 310 ± 10 |
| 0.2 μm RC poly(SPMAK) | 300 | 110 | 0.01 | 57 ± 4 | 310 ± 30 |
| Capto S (GE Healthcare) | 600 | 1.0 | 1 | 120 | 4 |
| (2) |
where tbreak is the time it takes between protein injection and the point of 10% breakthrough. Under the best tested conditions, these cation-exchange membranes achieved a productivity of over 300 mg lysozyme/mL/min. According to product literature for the Capto S resin [42], the best conditions facilitate a productivity of 4 mg/mL/min. Detailed calculations for resin column productivity using Equation 2 are given in Supplementary Material. Dynamic binding capacity is important when considering the number of cycles needed to process a volume of feed solution. However, from a productivity standpoint, differences in dynamic binding capacity do not impact productivity nearly as significantly as differences in residence times. Given their very low residence times and comparable dynamic binding capacities, membranes present a clear advantage in productivity over resin columns.
By evaluating protein binding capacity, permeability, and productivity of membrane adsorbers with different nominal pore sizes, we can better select materials to meet a specific target objective, whether that is to reduce the number of processing cycles or maximize the productivity for a single-cycle operation, or other.
4. Conclusions
Cation-exchange membranes with high dynamic binding capacities and high productivity were developed for protein capture using an organic solvent-based ATRP method in which the potassium ion of the charged monomer was coordinated with a crown ether to improve solubility. Macroporous membranes with nominal pore size ≤1 μm hold potential for protein capture steps, where high protein binding capacities are needed to realize single-cycle processing of very large scale batch sizes at high-productivity.
Supplementary Material
Highlights.
A unique ATRP formulation is described to fabricate cation-exchange membranes
Direct comparison of performance data is made to a commercial cation-exchange resin
Modified membranes have unprecedented productivity of 300 mg lysozyme/mL/min
Acknowledgments
Funding for this work was provided by the National Science Foundation under award CBET-0651231 and the National Institutes of Health under award 1 R15 GM094676-01. Additional support for JRR and EH came from the Advanced Functional Membranes Research Experiences for Undergraduates program at Clemson University. Funding for the REU program was provided by the National Science Foundation under award EEC-1061524. We thank Kimberly Ivey of the Clemson University School of Materials Science and Engineering for assistance using the microbalance and FTIR equipment. We thank Dr. Igor Luzinov for providing access to dip-coating equipment and supplying PGMA. The authors acknowledge the Jordan Hall Imaging Facility, Department of Biological Sciences, Clemson University, for use of the Nikon confocal scanning laser microscope during this work. We thank Dr. Terri Bruce and Milagro Marroquin for assistance with the CLSM experiments.
Footnotes
Publisher's Disclaimer: This is a PDF file of an unedited manuscript that has been accepted for publication. As a service to our customers we are providing this early version of the manuscript. The manuscript will undergo copyediting, typesetting, and review of the resulting proof before it is published in its final citable form. Please note that during the production process errors may be discovered which could affect the content, and all legal disclaimers that apply to the journal pertain.
References
- 1.Hiller A. Fast growth foreseen in protein therapeutics. GEN. 2009;29:153–155. [Google Scholar]
- 2.Goodman M. Market watch: sales of biologics to show robust growth through to 2013. Nat Rev Drug Discov. 2009;8:837–837. doi: 10.1038/nrd3040. [DOI] [PubMed] [Google Scholar]
- 3.Kelley B. Very large scale monoclonal antibody purification: the case for conventional unit operations. Biotechnol Prog. 2007;23:995–1008. doi: 10.1021/bp070117s. [DOI] [PubMed] [Google Scholar]
- 4.Han X, Hewig A, Vedantham G. Antibody Expression and Production. In: Al-Rubeai M, editor. Chapter 14: Recovery and Purification of Antibody. Vol. 7 Springer Verlag; New York: 2011. [Google Scholar]
- 5.Follman DK, Fahrner RL. Factorial screening of antibody purification processes using three chromatography steps without protein A. J Chromatogr A. 2004;1024:79–85. doi: 10.1016/j.chroma.2003.10.060. [DOI] [PubMed] [Google Scholar]
- 6.Grzeskowiak JK, Tscheliessnig A, Toh PC, Chusainow J, Lee YY, Wong N, Jungbauer A. Two-dimensional fluorescence difference gel electrophoresis for comparison of affinity and non-affinity based downstream processing of recombinant monoclonal antibody. J Chromatogr A. 2009;1216:4902–4912. doi: 10.1016/j.chroma.2009.04.014. [DOI] [PubMed] [Google Scholar]
- 7.Gagnon P. Technology Trends in Antibody Purification. J Chromatogr A. 2011;1221:57–70. doi: 10.1016/j.chroma.2011.10.034. [DOI] [PubMed] [Google Scholar]
- 8.van Reis R, Zydney A. Bioprocess membrane technology. J Membr Sci. 2007;297:16–50. [Google Scholar]
- 9.Kuczewski M, Schirmer E, Lain B, Zarbis-Papastoitsis G. A single-use purification process for the production of a monoclonal antibody produced in a PER. C6 human cell line. Biotechnol J. 2011;6:56–65. doi: 10.1002/biot.201000292. [DOI] [PubMed] [Google Scholar]
- 10.Etzel M, Riordan W. Membrane chromatography: Analysis of breakthrough curves and viral clearance. In: Shukla A, Etzel M, Gadam S, editors. Process Scale Bioseparations for the Biopharmaceutical Industry. Taylor & Francis; Boca Raton, FL: 2006. [Google Scholar]
- 11.Thömmes J, Etzel M. Alternatives to chromatographic separations. Biotechnol Prog. 2007;23:42–45. doi: 10.1021/bp0603661. [DOI] [PubMed] [Google Scholar]
- 12.Gebauer KH, Thömmes J, Kula MR. Plasma protein fractionation with advanced membrane adsorbents. Biotechnol Bioeng. 1997;54:181–189. doi: 10.1002/(SICI)1097-0290(19970420)54:2<181::AID-BIT9>3.0.CO;2-H. [DOI] [PubMed] [Google Scholar]
- 13.Roper DK, Lightfoot EN. Separation of biomolecules using adsorptive membranes. J Chromatogr A. 1995;702:3–26. [Google Scholar]
- 14.Bhut BV, Christensen KA, Husson SM. Membrane chromatography: Protein purification from E. coli lysate using newly designed and commercial anion-exchange stationary phases. J Chromatogr A. 2010;1217:4946–4957. doi: 10.1016/j.chroma.2010.05.049. [DOI] [PubMed] [Google Scholar]
- 15.Wang J, Faber R, Ulbricht M. Influence of pore structure and architecture of photo-grafted functional layers on separation performance of cellulose-based macroporous membrane adsorbers. J Chromatogr A. 2009;1216:6490–6501. doi: 10.1016/j.chroma.2009.07.042. [DOI] [PubMed] [Google Scholar]
- 16.Ulbricht M, Yang H. Porous polypropylene membranes with different carboxyl polymer brush layers for reversible protein binding via surface-initiated graft copolymerization. Chem Mater. 2005;17:2622–2631. [Google Scholar]
- 17.Bhut BV, Weaver J, Carter AR, Wickramasinghe SR, Husson SM. The role of polymer nanolayer architecture on the separation performance of anion-exchange membrane adsorbers: I. Protein separations. Biotechnol Bioeng. 2011;11:2645–2653. doi: 10.1002/bit.23221. [DOI] [PubMed] [Google Scholar]
- 18.Bhut BV, Weaver J, Carter AR, Wickramasinghe SR, Husson SM. The role of polymer nanolayer architecture on the separation performance of anion-exchange membrane adsorbers: Part II. DNA and virus separations. Biotechnol Bioeng. 2011;11:2654–2660. doi: 10.1002/bit.23222. [DOI] [PubMed] [Google Scholar]
- 19.Bruening ML, Dotzauer DM, Jain P, Ouyang L, Baker GL. Creation of functional membranes using polyelectrolyte multilayers and polymer brushes. Langmuir. 2008;24:7663–7673. doi: 10.1021/la800179z. [DOI] [PubMed] [Google Scholar]
- 20.Bhut BV, Conrad K, Husson SM. Preparation of high-performance membrane adsorbers by surface-initiated AGET ATRP in the presence of dissolved oxygen and low catalyst concentration. J Membr Sci. 2012;390–391:43–47. [Google Scholar]
- 21.Singh N, Wang J, Ulbricht M, Wickramasinghe SR, Husson SM. Surface-initiated atom transfer radical polymerization: a new method for preparation of polymeric membrane adsorbers. J Membr Sci. 2008;309:64–72. [Google Scholar]
- 22.Bhut BV, Wickramasinghe SR, Husson SM. Preparation of high-capacity, weak anion-exchange membranes for protein separations using surface-initiated atom transfer radical polymerization. J Membr Sci. 2008;325:176–183. [Google Scholar]
- 23.Bhut BV, Husson SM. Dramatic performance improvement of weak anion-exchange membranes for chromatographic bioseparations. J Membr Sci. 2009;337:215–223. [Google Scholar]
- 24.Jain P, Vyas MK, Geiger JH, Baker GL, Bruening ML. Protein purification with polymeric affinity membranes containing functionalized poly(acid) brushes. Biomacromolecules. 2010;11:1019–1026. doi: 10.1021/bm9014792. [DOI] [PMC free article] [PubMed] [Google Scholar]
- 25.Menkhaus TJ, Varadaraju H, Zhang L, Schneiderman S, Bjustrom S, Liu L, Fong H. Electrospun nanofiber membranes surface functionalized with 3-dimensional nanolayers as an innovative adsorption medium with ultra-high capacity and throughput. Chem Commun. 2010;46:3720–3722. doi: 10.1039/c001802c. [DOI] [PubMed] [Google Scholar]
- 26.Anuraj N, Bhattacharjee S, Geiger JH, Baker GL, Bruening ML. An all-aqueous route to polymer brush-modified membranes with remarkable permeabilities and protein capture rates. J Membr Sci. 2012;389:117–125. doi: 10.1016/j.memsci.2011.10.022. [DOI] [PMC free article] [PubMed] [Google Scholar]
- 27.Tsarevsky NV, Matyjaszewski K. “Green” atom transfer radical polymerization: from process design to preparation of well-defined environmentally friendly polymeric materials. Chem Rev. 2007;107:2270–2299. doi: 10.1021/cr050947p. [DOI] [PubMed] [Google Scholar]
- 28.Sankhe AY, Husson SM, Kilbey SM., II Direct polymerization of surface-tethered polyelectrolyte layers in aqueous solution via surface-confined atom transfer radical polymerization. J Poly Sci A1. 2007;45:566–575. [Google Scholar]
- 29.Xu Y, Walther A, Müller AHE. Direct synthesis of poly(potassium 3-sulfopropyl methacrylate) cylindrical polymer brushes via ATRP using a supramolecular complex with crown ether. Macromol Rapid Comm. 2010;31:1462–1466. doi: 10.1002/marc.201000157. [DOI] [PubMed] [Google Scholar]
- 30.Samadi A, Husson SM, Liu Y, Luzinov I, Kilbey SM., II Low-temperature growth of thick polystyrene brushes via ATRP. Macromol Rapid Comm. 2005;26:1829–1834. [Google Scholar]
- 31.Wandera D, Wickramasinghe SR, Husson SM. Modification and characterization of ultrafiltration membranes for treatment of produced water. J Membr Sci. 2011;373:178–188. [Google Scholar]
- 32.Matyjaszewski K, Xia J. Atom transfer radical polymerization. Chem Rev. 2001;101:2921–2990. doi: 10.1021/cr940534g. [DOI] [PubMed] [Google Scholar]
- 33.Monge S, Darcos V, Haddleton DM. Effect of DMSO used as solvent in copper mediated living radical polymerization. J Poly Sci A1. 2004;42:6299–6308. [Google Scholar]
- 34.Davies RC, Neuberger A, Wilson BM. The dependence of lysozyme activity on pH and ionic strength. BBA – Protein Struct M. 1969;178:294–305. doi: 10.1016/0005-2744(69)90397-0. [DOI] [PubMed] [Google Scholar]
- 35.van der Veen M, Norde W, Stuart MC. Electrostatic interactions in protein adsorption probed by comparing lysozyme and succinylated lysozyme. Colloid Surf B. 2004;35:33–40. doi: 10.1016/j.colsurfb.2004.02.005. [DOI] [PubMed] [Google Scholar]
- 36.Page LAG, Bednarek MB DuPont Co., USA. US Patent 5,708,095. Graft copolymers containing sulfonate and phosphonate groups having particular utility as pigmented ink dispersants. 1998 Jan 13;
- 37.Sarfert FT, Etzel MR. Mass transfer limitations in protein separations using ion-exchange membranes. J Chromatogr A. 1997;764:3–20. doi: 10.1016/s0021-9673(96)00894-1. [DOI] [PubMed] [Google Scholar]
- 38.Liu H-C, Fried JR. Breakthrough of lysozyme through an affinity membrane of cellulose-Cibacron Blue. AIChE J. 1994;40:40–49. [Google Scholar]
- 39.Russell SM, Carta G. Multicomponent protein adsorption in supported cationic polyacrylamide hydrogels. AIChE J. 2005;51:2469–2480. [Google Scholar]
- 40.Teske CA, Schroeder M, Simon R, Hubbuch J. Protein-labeling effects in confocal laser scanning microscopy. J Phys Chem B. 2005;109:13811–13817. doi: 10.1021/jp050713+. [DOI] [PubMed] [Google Scholar]
- 41.Singh N, Husson SM, Zdyrko B, Luzinov I. Surface modification of microporous PVDF membranes by ATRP. J Membr Sci. 2005;262:81–90. [Google Scholar]
- 42.Capto S, Capto Q, Capto ViralQ, Capto DEAE; Data File 11-0025-76 AE. GE Healthcare; Uppsala, Sweden: Jun, 2007. [Google Scholar]
- 43.HiScreen™ Capto™ Q, HiScreen Capto S, HiScreen Capto DEAE; Instructions 28-9339-62 AE. GE Healthcare Life Sciences; Uppsala, Sweden: Apr, 2012. [Google Scholar]
Associated Data
This section collects any data citations, data availability statements, or supplementary materials included in this article.


