

Abstract
We investigate three important areas related to the clinical use of LVM (LVM): accuracy of assessments by echocardiography and cardiac magnetic resonance (CMR), the ability to predict cardiovascular outcomes, and the comparative value of different indexing methods. The recommended formula for echocardiographic estimation of LVM uses linear measurements and is based on the assumption of the left ventricle as a prolate ellipsoid of revolution. CMR permits a modeling of the left ventricle free of cardiac geometric assumptions or acoustic window dependency, showing better accuracy and reproducibility. However, echocardiography has lower cost, easier availability, and better tolerability. From the Medline database, 26 longitudinal echocardiographic studies and 5 CMR studies, investigating LVM or LV hypertrophy as predictors of death or major cardiovascular outcomes, were identified. LVM and LV hypertrophy were reliable cardiovascular risk predictors using both modalities. However, no study directly compared the methods for the ability to predict events, agreement in hypertrophy classification, or performance in cardiovascular risk reclassification. Indexing LVM to BSA was the earliest normalization process used, but it seems to underestimate the prevalence of hypertrophy in obese and overweight subjects. Dividing LVM by height to 1.7 or 2.7 as allometric powers are the most promising normalization methods in terms of practicality and usefulness from a clinical ans scientific standpoints for scaling myocardial mass to body size. The measurement of LVM, calculation of LVMi, and classification for LVH should be standardized by scientific societies across measurement techniques and adopted by clinicians in risk stratification and therapeutic decision.
Keywords: LVM, LVH, cardiovascular events, cardiac magnetic resonance, echocardiography
Introduction
Left ventricular mass (LVM) is an independent risk factor for prediction of cardiovascular events. However, the best way to incorporate LVM into clinical decision-making algorithms has not been established.1 Even in a range usually considered normal for healthy adults, LVM is positively related to systolic blood pressure, body mass index (BMI), and coronary calcium score by cardiac computed tomography.2,3 Elevation in myocardial mass may not be an inevitable consequence of aging, but better predicted by blood pressure, diabetes status, tobacco use, and body weight over time.4–8 Values of myocardial mass have also been shown to be associated with previous aneurysm of the abdominal aorta, subscapular skinfold thickness, left atrial size, resting heart rate, and physical activity.5,7,9–11 Increase in LVM, as related to cardiac remodelling, can be consequent to both an adaptive and a maladaptive process.12 The absence of an identifiable, pathologic turning point for cardiac remodelling assessment from adaptive to maladaptive creates a challenge to the definition of normal LVM.
The distribution of LVM values is wide in a healthy population, with distinct patterns according to gender and ethnicity. Moreover, absolute values of myocardial mass are limited by not taking into account physiologic variations related to body size. To adjust for these particularities, indexing LVM for anthropometry allows comparisons among different individuals. Several methods have been suggested for the normalization of LVM values–usually involving height, weight, or both. Indexing is also important because it affects who will be classified as having left ventricular hypertrophy (LVH.1,13–19
Echocardiography and cardiac magnetic resonance (CMR) are the best-documented imaging modalities used to assess myocardial mass. In both cases, scientific societies have elaborated guidelines discussing appropriate technical procedures, validation aspects, and clinical indications.20,21 Accurate quantification of cardiac dimensions is crucial for distinguishing disease states from normal variants.22 LVM is calculated using different algorithms for each modality and gives different average values for LVM with different degrees of accuracy.1
Assessment of LVM in epidemiologic studies has shown prognostic value.1 The importance of LVM and hypertrophy for clinical purposes is best evidenced for hypertensive populations. LVH is recognized by current guidelines as target-organ damage that influences the prognosis in hypertensive populations. However, recommendations for incorporation of LVM or LVH into hypertension treatment algorithms vary in different guidelines.23–25 This partly explains why on a daily basis the clinical use of LVM measurements has not been firmly established—although extensively used as a surrogate endpoint in clinical trials.20,26
In this review, we investigate three important points related to clinical use of LVM measurements: (1) comparison of LVM assessment by echocardiography and CMR, (2) outcomes prediction power of LVM, and (3) the different normalization methods used to index LVM. Our aim is to evaluate the strength of the evidence regarding the use of LVM measurements in clinical practice, as a predictor of events and as a therapeutic target.
LVM assessment by Echocardiography and by CMR
Echocardiography
Although LVM may be assessed using two-dimensional (2D) or three-dimensional (3D) echocardiography, M-mode was the first non-invasive imaging technique developed and remains the recommended method.20,27 Whether using M-mode, 2D, or 3D measurements, LVM estimation by echocardiography is based on subtraction of the left ventricular cavity volume from the volume enclosed by the correspondent epicardium to obtain the myocardial volume, then multiplying by the myocardial density (taken to be 1.05 g/ml).20 At the present time, the lack of long-term follow-up information using 2D or 3D echocardiography estimations of LVM as event predictors limits further discussion in this review.
In patients without major cardiac geometry distortions, the American Society of Echocardiography (ASE) recommends a formula to estimate LVM from linear dimensions based on the assumption of the left ventricle as a prolate ellipsoid of revolution (Figure 1). Linear measurements of inter-ventricular septum wall thickness (IVST), as well as left ventricular internal diameter (LVID) and posterior wall thickness (PWT), should be done from the parasternal acoustic window in end diastole at the level of the LV minor axis (mitral valve leaflet tips) using 2D-targeted M-mode or directly from 2D images.20 Although wall dimensions are used to assess LVM by echocardiography, regional increase in wall thickness seen in hypertrophic cardiomyopathy is a specific disease and will not be addressed in this review.
Figure 1. Principles for the assessment of LVM by echocardiography, as recommended by the American Society of Cardiology (ASE).20 Images from ‘c)’ to ‘e)’ refer to a schematic representation of the steps for the estimation of left ventricular myocardial volume, as initially proposed by Devereux et al.28 LVM is then calculated multiplying the myocardial volume by the specific gravity of myocardium (1.05 g).

a) A prolate ellipsoid of revolution, or prolate spheroid, is a three-dimensional figure formed by revolving an ellipse about its major axes. The ASE-recommended formula assumes that the left ventricle has a prolate ellipsoid of revolution shape, with minor radii that are half the major radius.
b) Schematic representation of the linear measurements for the assessment of LVM by echocardiography (para-esternal view), according to the ASE recommendations. 1-interventricular septum thickness (IVST); 2- Left ventricular internal dimension (LVID); 3- posterior wall thickness (PWT).
c) Calculation for the total left ventricular volume (VolumeT).
d) Calculation for the left ventricular internal cavity volume (VolumeC).
e) Calculation for the left ventricular myocardial volume (VolumeM).
f) The current ASE-recommended formula for the assessment of LVM. It is based in the initial concepts, but includes correction factors derived from regression analysis.20,35
The first challenge to echocardiographic assessment of LVM is the correct identification of interfaces between the cardiac blood pool and the endocardium, as well as between the epicardium and pericardium. The correct M-mode reference beam orientation perpendicular to the septum can also be challenging. Poor acoustic windows and operator experience are also major concerns for echocardiography measurements. The LVM algorithm is performed cubing values of the primary linear measurements, which therefore magnifies measurement errors.
The need to calculate myocardial volume cubing linear dimensions—due to the geometric assumption of the prolate ellipsoid—is the major limitation for LVM estimated by M-mode echocardiography as related to accuracy and reproducibility. 28–31 The Prospective Randomized Enalapril Study Evaluating Regression of Ventricular Enlargement (PRESERVE) assessed intrapatient reliability (inter-scan reproducibility) of echocardiographic LVM measurements, repeating echocardiograms in 183 hypertensive subjects with LVH. The intraclass correlation coefficient (ICC) for the linear measurements was 0.87 for LVID, 0.85 for IVST, and 0.83 for PWT.32 Bottini et al. also assessed inter-scan reproducibility, repeating echocardiograms in 22 hypertensive subjects, and reported an average mean difference of 0.3 g between exams, with 95% limits of agreement from −96.3 g to 96.9 g.33 The same authors also had two readers independently assess24 echocardiography images, finding mean differences (95% limits of agreement) of 1.83g (−48.8, 52.5).33 Intrareader reproducibility for LVM by echocardiography was evaluated in 735 children of HIV-infected mothers in the prospective P(2)C(2) HIV study. Echocardiograms were analyzed in 10 clinical sites and then reassessed at a central facility. The internal LVID showed the highest agreement (ICC = 0.97), but lower correlation was found for PWT (ICC = 0.65) and IVST (ICC = 0.50).34 Also for intra-reader reproducibility, 21 subjects were assessed by Missouris et al., showing mean coefficient of variation (95% CI) of 6.1% (3.9, 8.3).29 Using 20 hypertensive male subjects, Spratt at el. investigated echocardiography inter-reader reproducibility and found mean differences (95% limits of agreement) for LVM/BSA between 4.5 g/m2 (−24.9, 33.9) and 6.4 g/m2 (−23.0, 35.8) for harmonic and fundamental imaging, respectively.35
The ASE-recommended algorithm is based on the formula first described by Devereux et al. in 1977, adding modifications.20,27,36,37 Due to the ability to improve definition of pericardial and endocardial borders, Harmonic Imaging (HI) replaced Fundamental Imaging (FI) in clinical practice. In the past, FI was limited to a fixed frequency for output and receiving (usually ~2.5 mHz), but the advent of HI allowed the emission of low frequency ultrasound for good penetration and the reception of signal two octaves higher. 38 When assessed by M-mode echocardiography, HI shows higher values for LVM compared to the Fundamental but seems to correlate better to CMR measures.30,35,38,39
Cardiac Magnetic Resonance
LVM evaluation by CMR permits a 3D high-resolution modeling of the left ventricle free of cardiac geometric assumptions, contrast infusion, acoustic window dependency, or ionizing radiation. Both short-axis and long-axis techniques are highly accurate for quantification of LVM.40 The best documented technique, however, uses a set of contiguous short-axis slices covering the entire left ventricle from the atrio-ventricular ring down to the apex, acquired from a cine sequence. A combination of body matrix/torso radio-frequency (RF) coils is used for the acquisition, using a 2D cardiac-gated pulse sequence. Ideally, images are acquired at resting lung volume. Myocardial volume is the area occupied between the endocardial and epicardial border multiplied by the inter-slice distance. By convention, LV mass is measured at end-diastole. Similar to echocardiography, LVM is the product of this volume and the density of the myocardium (Figure 2).
Figure 2. Images from cardiac magnetic resonance (CMR) of two patients with Chagas cardiomyopathy. Case 1 has preserved cardiac geometry, but case 2 shows left ventricular remodeling. The usual assessment of LVM (LVM) by CMR does not require cardiac geometry assumptions, in opposition to linear measurements used in echocardiography. (Courtesy of Dr. Gustavo Volpe).
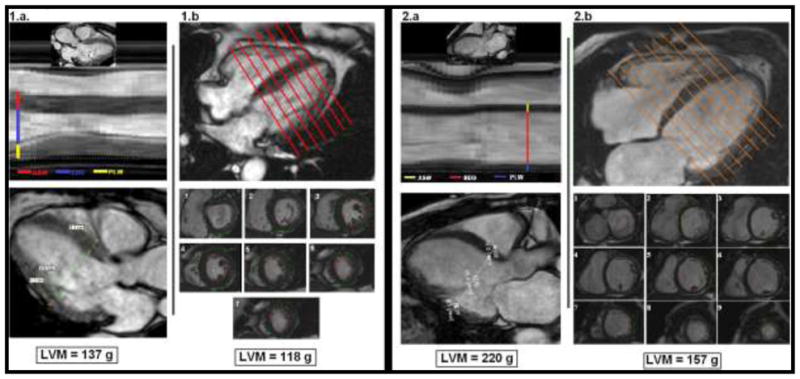
For 1.a and 2.a - CMR-derived images representing usual echocardiography views for linear measurements assessing LVM. ASW corresponds to interventricular septal thickness; EDD corresponds to left ventricular internal dimension; and PLW corresponds to posterior wall thickness. At the bottom, the ASE-recommended formula was used to calculate LVM (see figure 1 for full description).
For 1.b and 2.b - Usual CMR assessment for LVM, using contiguous short-axis slices covering the entire left ventricle from the atrio-ventricular ring to the apex (1 to 9). The estimated LVM is displayed at the bottom.
Early controversies were related to contour differences in left ventricular quantification by CMR, with small studies favoring inclusion of papillary muscles in the calculation of myocardial mass.41–43 In fact, the measurement technique significantly influences the estimation of LVM.44 However, the Multi-Ethnic Study of Atherosclerosis (MESA) enrolled the largest population with CMR assessment and showed better reproducibility when papillary muscles were excluded.45
Technical developments in CMR image acquisition and post-processing influence LVM measurements. Black-blood techniques were previously used to assess LVM by CMR, moving to cine bright-blood techniques. More recently, steady-state free precession (SSFP) has replaced fast gradient-echo (GRE) sequences as the preferable CMR cine bright-blood technique. Compared to GRE techniques, SSFP sequences have substantially higher signal-to-noise and contrast-to-noise ratios and shorter acquisition times.46 SSFP sequences improve homogeneity of the blood pool signal and definition of the endocardial border throughout the cardiac cycle, improving the performance of automatic and manual delineation of contours for assessment of LVM.47 Studies comparing SSFP and GRE for calculation of LVM demonstrated a lower mass measured by the SSFP sequence, but both methods demonstrated good reproducibility.47,48
In healthy participants, LVM assessed by CMR shows susceptibility to interobserver variation.49 Using 9 normal young volunteers, Missouris et al. found CMR intra-reader reproducibility between LVM estimations of 0.5% with 95% limits of agreement of ±11%.29 Bottini et al. assessed intra-reader reproducibility in a population of 34 hypertensive subjects, finding mean differences (95% limits of agreement) of 0.32g (−20.1, 21.7).33 Gandy et al. showed that intra-reader reproducibility of LVM measurements by CMR are dependent upon the clinical cardiac condition under investigation, with intra-observer coefficients of repeatability of 4.6g for healthy volunteers, 6.7g for post-myocardial infarct patients, 8.3g in patients with congestive heart failure, and 9.8g in patients with LVH.50 Moreover, Bellenger et al. investigated 15 healthy adult volunteers and 15 patients with chronic stable heart failure that underwent two CMR scans 7 days apart, with correlation coefficient for the assessment of LVM of 0.99 and inter-scan average difference (95% limits of agreement) of 0.7g (−6.3; 9.7) and 0.7g (−11.9; 13.3) for normal and heart failure patients, respectively.51
In fact, among the evaluations of left ventricular volumes, mass, and function by CMR, LVM appears to be the least reproducible and most variable parameter.44 This is because LV mass is derived from the difference of two volumes (total left ventricular volume and end diastolic volume). Although gradually less significant over time, additional important limitations for wide clinical use of CMR include the following: elevated operational cost, time to acquire and analyze cine data, breath-hold dependency, hazards associated with ferromagnetic metal devices, and issues related to claustrophobia in susceptible patients.
Echocardiography vs. CMR
Although CMR and echocardiographic LVM measurements show high correlation, absolute values of LVM differ between these techniques (Figure 2).29,30 The difference among estimates by echocardiography and CMR indicates that the two methods cannot be used interchangeably in the assessment of LVM.33 Echocardiography is less expensive and has superior versatility, acceptability, and availability compared to CMR. These are practical issues that support clinical use of LVM assessed by echocardiography as an outcome predictor, as recommended by the most recent American Heart Association (AHA) statement on cardiovascular risk assessment.52
However, LVM determined by CMR is more accurate and precise than that provided by M-mode echocardiography.33 Interstudy reproducibility of CMR-derived parameters for LVM is also superior to 2D echocardiography for normal, dilated, and hypertrophic hearts.53 In fact, research studies using this method require substantially smaller sample size to assess outcome measures.51,53 The variability of echocardiography for evaluation of serial LVM changes has generated concerns.54 The previously reported probability of a true biological change in observed/predicted LVM over time was maximized for a single-reader difference greater than 22%.55 Three-dimensional echocardiography improves accuracy and reproducibility compared to CMR, but is strongly dependent on equipment and technical conditions such as acoustic window quality.56–61
LVM as a predictor of events
Longitudinal studies present in the MEDLINE database that investigated LVM, LVMi, or LVH assessed by echocardiography or CMR as predictors of death or major cardiovascular outcomes were included in this analysis. The following criteria were applied to select articles: (1) echocardiographic studies using the American Society of Echocardiography recommendations for chamber quantifications by M-mode technique, 20,37 (2) survival analysis studies reporting Hazard Ratio and 95% Confidence Interval (CI), and (3) reports from multivariate analyses adjusted for at least two other traditional risk factors. In each study, analysis adjusted for the highest number of traditional cardiovascular risk factors was included. Analyses using covariates derived from other graphic/imaging diagnostic methods such as EKG, ejection fraction, and LV volumes were excluded. Analyses which included pooled LVM data were excluded unless a classification of hypertrophy was clearly defined. For each study, we describe the mean follow-up time.
We included 26 longitudinal echocardiographic studies (Table 1) in our review. From those, 11 reported non-normalized LVM or LVMi as predictors of clinical outcomes (Figure 4); 12 reported LVH (Figure 5); 8 reported serial changes in LVM or LVH status over time (Figure 6). We included 5 studies for LVM assessed by CMR (Table 2). All CMR studies reported LVMi as outcome predictor; 2 also reported non-normalized LVM; and 1 additionally evaluated LVH. In the echocardiography group, a remarkable predominance of studies was oriented toward investigating hypertensive populations. For the CMR group, 4 of the 5 studies were based on participants from the Multiethnic Study of Atherosclerosis (MESA), a population free from known cardiovascular disease at inclusion, using different outcomes and diverse methods for indexing LVM. Tables 1 and 2 also show the vast number of different LVH definitions used in these studies.
Table 1.
Longitudinal studies using Echocardiography to estimate LVM as predictor of clinical outcomes
| Author/Year | Population | n | Mean Follow-up | Hypertrophy definition (LVMi) | |
|---|---|---|---|---|---|
| Levy91 | 1990 | FHS, >40 yrs, no CVD | 3,220 | 4 years | >2 SD in reference group |
| Ghali66 | 1992 | CCHDR; cardiac cath for presumed CAD, EF>45%, | 785 | 4 years | > 131g/m2 for men; > 100g/m2 for women |
| Foley96 | 1995 | 6 months survivors from ESRD therapy | 433 | 41 months | > 100 g/m2 in females, > 131 g/m2 in males |
| Liao98 | 1995 | African-Americans underwent cath for presumed CAD | 1,089 | 5 years | >131 g/m2 in men; >100 g/m2 in women |
| Muiesan68 | 1995 | Uncomplicated hypertensive patients | 151 | 10 years | LVMi > 134g/m2 for men; > 110g/m2 for women |
| Muiesan103 | 1998 | Brescia Study; uncomplicated hypertensive patients | 151 | 10 years | > 97th percentile partition of LVMi |
| Verdecchia67 | 1998 | PIUMA; essential hypertensive before therapy, average 48.2years | 430 | 1217 patient- years | >125 g/m2 |
| Quiñones64 | 2000 | SOLVD; CHF patients | 1,172 | 1 year | not used in analysis |
| Sundström92 | 2001 | men at age 70, living in Sweden (Uppsala) | 475 | 5.2 years | ≥150 g/m2 |
| Verdecchia93 | 2001 | MAVI; hypertensive, no CVD, age ≥50 | 1,033 | 3 years | LVM/BSA >125 g/m2 and LVM/height2.7 >51.0 g/m2.7 |
| Verdecchia94 | 2001 | PIUMA; untreated hypertensive without CVD | 2,363 | 5 years | >125 g/m2 |
| Zoccalli77 | 2001 | CREED; ESRD on dialysis | 254 | 29 months | > 97.5th percentile in reference |
| de Simone65 | 2002 | MAVI; hypertensive, age ≥50, no CVD or type 1 diabetes | 1,019 | 35 months | >28% excess in relation to reference population |
| Tsang100 | 2003 | age 65 years, without CVD, from USA (Minnesota) | 1,160 | 3.8 years | LVM/height ≥120 g/m |
| Okin99 | 2004 | SHS; American Indians, age 59 +/−8 years | 2,193 | 3.1 years | > 104 g/m2 in women; 116g/m2 in men |
| Zoccali105 | 2004 | CREED; ESRD on dialysis | 161 | 29 months | Not used |
| Devereux102 | 2004 | LIFE; aged 55 to 80 years, with essential hypertension and EKG showing LVH, during treatment | 941 | 4.6 years | >116 g/m2 in men; > 104 g/m2 in women |
| de Simone75 | 2005 | MAVI; hypertensive, age ≥50, no CVD | 1,019 | 35 months | >95th percentiles of sex-specific normal distributions or prognosis |
| de Simone76 | 2005 | SHS; American Indians, 47 – 80 years, no CVD | 2,400 | 86 months | >95th percentiles of sex-specific distribution a reference sample for each index |
| Eguchi63 | 2007 | uncomplicated hypertensive Japanese | 400 | 63 months | ≥110 g/m2 in women; ≥134 g/m2 in men |
| Muiesan69 | 2007 | Uncomplicated hypertensive patients | 436 | 60 months | > 28% above the predicted based on a reference sample |
| Pierdomenico104 | 2008 | hypertension and LVH by echocardiography, aged 52 ± 10 years | 387 | 2 years | LVMi >50 g/m2.7 in men; >47 g/m2.7 in women |
| de Simone90 | 2008 | CHS; no MI, AFib, or HF | 2,078 | 10 years | > 28% above the predicted based on a reference sample |
| Verma95 | 2008 | VALIANT; CHF post-MI patients | 603 | 24.7 months | > 115 g/m2 for men; > 95 g/m2 for women |
| Yasuno101 | 2009 | CASE-J; high-risk Japanese hypertensive | 1,447 | 3.3 years | >=125 g/m 2 |
| Lai97 | 2011 | CCC; ≥35 years Chinese subjects, without previous cardiovascular events | 2,604 | 14.4 years | cut-off value of 105 g/m2 (highest Youden’s index) |
CAD – coronary artery disease; CHD – congestive heart failure; MI - myocardial infarction; ESRD - end-stage renal disease; FHS - Framingham Heart Study; CV death - cardiovascular death; CVD – cardiovascular disease; CHF - congestive heart failure; TIA - transient ischemic attack; CCHDR - Cook Count Heart Disease Registry; CRV - coronary revascularization; PIUMA - The Progetto Ipertensione Umbria Monitoraggio Ambulatoriale; UHC - University Hospital of Catanzaro; CHS - Cardiovascular Health Study; SOLVD - Studies of Left Ventricular Dysfunction; MAVI - The Massa Ventricolare sinistra nell’Ipertensione study; CREED - the Cardiovascular Risk Extended Evaluation in Dialysis study; POAD – peripheral occlusive arterial disease; AFib - atrial fibrillation; LIFE - Losartan Intervention For Endpoint Reduction in Hypertension study; IHD - Ischemic heart disease; LVH – LVH; AFib - atrial fibrillation; VALIANT – the valsartan in acute myocardial infarction study; CASE-J - Candesartan Antihypertensive Survival Evaluation in Japan CCC - Chin-Shan Community Cardiovascular Cohort Study.
Figure 4. Hazards Ratios and 95% Confidence Interval for longitudinal studies using Echocardiography to estimate LVM or LVMi as predictor of clinical outcomes.

composite 1 - fatal and nonfatal cardiovascular events, including sudden death and other cardiovascular deaths, myocardial infarction, stroke, heart failure requiring hospitalization, renal failure requiring dialysis, documented angina, transient ischemic attack, or peripheral occlusive arterial disease verified by angiography; Composite 2 - CV death, Ischemic heart disease, CHF, End-stage renal disease, peripheral arterial disease, and stroke; Composite 2 - coronary heart disease, congestive heart failure, stroke or transient ischemic attack and intermittent claudication; Composite 4 - new-onset coronary artery disease, stroke, transient cerebral ischemic attack, symptomatic aortoiliac occlusive disease verified at angiography, thrombotic occlusion of a retinal artery documented at fluoroangiography, progressive heart failure requiring hospitalization, and renal failure requiring dialysis; composite 5 - fatal and nonfatal MI, sudden cardiac death, fatal and nonfatal stroke, other cardiovascular deaths, all-cause death, severe heart failure requiring hospitalization and severe renal failure requiring dialysis; TIA - Transient ischemic attack; Composite 6 - end point of death from cardiovascular causes, reinfarction, heart failure, stroke, or resuscitation after cardiac arrest
Figure 5.

Hazards Ratios and 95% Confidence Interval for longitudinal studies using Echocardiography to estimate LVH as predictor of clinical outcomes.
Composite 1 - fatal or nonfatal myocardial infarction, sudden death, fatal or nonfatal stroke, other cardiovascular deaths, severe heart failure requiring hospitalization, severe renal failure requiring dialysis, documented angina, transient ischemic attack, and peripheral occlusive arterial disease verified by angiography; HF – heart failure; MI-indep – myocardial infarct independent; CAD – coronary artery disease; CHD - coronary heart disease; Composite 2: Fatal/nonfatal coronary heart disease, stroke, congestive heart failure, other cardiovascular disease. Composite 3 - myocardial infarction (MI), coronary revascularization, atrial fibrillation (AF), congestive heart failure (CHF), transient ischemic attack (TIA), stroke, or cardiovascular death; TIA - Transient ischemic attack; Composite 4 - sudden death, which is unexpected death that occurs within 24 h without external causes; cerebrovascular events including stroke or transient ischemic attack; cardiac events including heart failure, angina pectoris, or acute myocardial infarction; renal events including sCr more than or equal to 4.0 mg/dl, doubling of the sCr (however, sCr 2.0 mg/dl is not regarded as an event), or end-stage renal disease; and vascular events including dissecting aortic aneurysm or arteriosclerotic occlusion of a peripheral artery.
LVHa – hypertrophy defined by non indexed LVM; LVHb– hypertrophy defined by LVM indexed by BSA; LVHc– hypertrophy defined by LVM indexed by BSA1.5; LVHd – hypertrophy defined by LVM indexed by height; LVHe– hypertrophy defined by LVM indexed by height2.7; LVHf– hypertrophy defined by LVM indexed by height2.13. LVHa to LVHf refer to the whole population included in the study.
Figure 6.

Hazards Ratios and 95% Confidence Interval for longitudinal studies using Echocardiography to estimate LVM and LVH status serial changes as predictor of clinical outcomes.
infarction, and stroke; composite 2 - stroke, MI, angina, HF; composite 3 - sudden death, fatal and nonfatal stroke, transient cerebral ischemic attack, fatal and nonfatal myocardial infarction, new-onset angina requiring hospitalization, progressive heart failure requiring hospitalization, coronary artery bypass or angioplasty, carotid endarterectomy, and renal failure requiring dialysis; composite 4 - fatal and non-fatal myocardial infarction, coronary revascularization, heart failure requiring hospitalization, and fatal and non-fatal stroke; composite 5 - new-onset coronary artery disease, stroke, transient cerebral ischemic attack, symptomatic aortoiliac occlusive disease verified at angiography, thrombotic occlusion of a retinal artery documented at fluoroangiography, progressive heart failure requiring hospitalization, and renal failure requiring dialysis; composite 6 - of sudden death, cerebrovascular events, heart failure, angina pectoris, acute myocardial infarction, renal events or end-stage renal disease, and vascular events; composite 7 - electrocardiographic-documented anginal episodes and myocardial infarction, heart failure, electrocardiographic-documented arrhythmia, transient ischemic attacks, stroke, and other thrombotic events) and death after the second echocardiogram.
† decrease of 6.6g/m2.7; ‡ reference: persistence of LVH after 1 Year; ¥ after 1 year; § 1 g/m2.7/month increase in an average of 18 months after baseline.
Table 2.
Longitudinal studies using CMR to estimate LVM as predictor of clinical outcomes
| Publication | Population | n | Mean Follow-up | Hypertrophy definition (LVMi) |
|---|---|---|---|---|
| Bluemke62, 2008 | MESA | 4,968 | 4 years | not used in analysis |
| Krittayaphong88, 2009 | Known/suspected CAD referred to CMR | 2,194 | 926 days | Not used in analysis |
| Brumback18, 2010 | MESA | 5,004 | 4,1 years | Not used in analysis |
| Chirinos19, 2010 | MESA | 5,004 | 4.8 years | > 95th perc in the reference sample |
| Jain89, 2011 | MESA | 4,965 | 5.8 years | not used in analysis |
LVMi – LVM index; CAD – coronary artery disease; CHF – Congestive heart failure; MI - myocardial infarction; MESA (Multiethnic Study of Atherosclerosis ) - white, black, Hispanic, and Chinese adults free of overt cardiovascular disease, aged 45 to 84 years from 6 US communities; CMR – cardiac magnetic resonance.
In Figure 3, the Hazard Ratios and 95% CI for the CMR group of studies are displayed according to the method used to index LVM, hypertrophy classification, and predicted outcomes. The 5 longitudinal CMR studies provide hazard ratios from 33 models. A direct comparison of events predictors is difficult due to the use of different clinical endpoints. Regardless of which method is used for normalization of LVM, however, most models demonstrated significant ability to predict events. For LVMi, the overall hazard ratio ranged from 1.0 (95% CI 0.9 –1.1) for prediction of coronary heart disease62 to 2.2 (95% CI 1.4 – 3.4) for prediction of a combined endpoint, including coronary heart disease or stroke.18
Figure 3.

Hazards Ratios and 95% Confidence Interval for longitudinal studies using CMR to estimate LVM as predictor of clinical outcomes.
Model 1 - LV mass divided by 42.5 x (height in meters)1.88 for women, and LV mass divided by 51.4 x (height in meters)1.88 for men; Model 2 - 6.82 x (height in meters)0.561 x (weight in kilograms)0.608 for women, and 8.17 x (height in meters)0.561 x (weight in kilograms)0.608 for men; MACE: cardiac death or nonfatal myocardial infarction or hospitalization due to heart failure or unstable angina, or life-threatening ventricular arrhythmia; CHD – coronary artery disease; LVMi – LVM index; HF – heart failure; BSA – body surface area; CVE – cardiovascular events; LVH – LVH; CV – cardiovascular; MI – myocardial infarct; HF – heart failure.
Hazard ratios for the ability to predict events reported for LVM and LVMi in the echocardiography studies are shown in Figure 4, along with the mode of indexing and endpoint definitions. The 11 studies reported hazard ratios from 33 models. The hazard ratios ranged from 1.0 (95% CI 0.99 – 1.02) for LVM indexed by body-surface area (BSA) among subjects with diabetes—predicting a combined endpoint of cardiovascular death, ischemic heart disease, heart failure, end-stage renal disease, peripheral arterial disease, and stroke63—to 2.8 (95% CI 1.6 – 4.7) for LVM predicting all-cause deaths among patients with heart failure.64
The ability to predict events according to myocardial hypertrophy status by echocardiography is displayed in Figure 5. From the 10 included studies, 30 hazard ratios were reported. The hazard ratios ranged from 1.01 (95% CI 1.0 – 1.02) for inappropriate LVM (>28% of excess, obtained by dividing LVM by predicted values based in a reference sample), predicting a composite endpoint65 (see ‘composite 1’ in Figure 5 legend for full description) to 4.14 (95% CI 1.8 – 9.7) for LVH in patients without coronary artery disease, predicting all-cause mortality.66 Few studies are comparable, however, due to methodological differences. The majority of the studies report significant power to predict events for LVM, for LVMi, and for hypertrophy.
We assessed the ability to predict cardiovascular events by changes in LVMi or LVH classification over time using only echocardiography. Hazard ratios for serial changes in LVM or LVH status are displayed in Figure 6, with predicted outcome and mode of normalization. A total of 23 hazard ratios were reported in the 8 studies providing information on LVM and LVH status changes. In summary, the risk gradually increased according to LVM at baseline, with an increasing LVM or hypertrophy grading. When LV mass regressed after treatment, the hazard ratio was favorable, predicting an extensive composite endpoint (HR 0.18, 95% CI 0.05 – 0.7)67 (see ‘composite 5’ in Figure 6 legend for full description). A maintained LVH status, however, significantly predicted a different composite endpoint (HR 3.52, 95% CI 2.5 – 4.6)68 (see ‘composite 2’ in Figure 6 legend for full description).
Indexing process
During the review process, we assessed several criteria used to normalize LVM. Figures 3, 4, and 6 display the wide variety of methods used to calculate LVMi. Heart size scales with the size of the body.22 Several different methods have been suggested for indexing LVM to anthropometric measures usually based on height and/or weight, but the optimal way to normalize myocardial mass has not been established.20 Alternatively, procedures where measured LVM is indexed by dividing by expected LV mass (based on a reference population free of major cardiovascular risk factors) have also been proposed, adding complexity to the calculation of LVMi. The most commonly used formula for computing BSA—the Dubois and Dubois regression (BSA = 0.007184 x weight(Kg)0.425 x height [cm]0.725)—is based on an assessment of nine cadaveric subjects reported in a 1916 publication, and its validity has been questioned.18,22,69
Indexing LVM to BSA was the first normalization process used, but it seems to underestimate the prevalence of LVH in obese as well as in overweight hypertensive patients.17 Conversely, the prevalence of hypertrophy is higher in obese individuals for height-based indices that do not account for weight in overweight individuals.18 The purpose of indexing LVM for height with an allometric exponent is to attempt to approximate lean body mass and to possibly adjust for the impact of growth during childhood.70 Compared to LVM/BSA and LVM/height, indexation of LVM by height2.7 appears to adjust better for the relations between height and LVM in hypertensive, obese individuals and to reduce the variability among normal subjects, providing a more sensitive cut off for LVH.70,71 Comparing LVM indexed by BSA and height,2.7 LVM/height2.7 has a better performance as a unique criteria to detect LVH prevalence in obese subjects.72 Also, in acromegaly, LVM indexed for height2.7 appears to be the most appropriate method to identify LVH—particularly in patients who are also overweight.73
Using a population of hypertensive subjects with low prevalence of obesity, de Simone et al. 74 (Table 1) compared indexing methods for LVM assessed by echocardiography as predictors of cardiovascular events. After adjustment for age and gender, indexing by height, height2.7, or height2.13 performed as well as BSA as outcome predictors (Figure 4). de Simone also investigated American Indians free of cardiovascular disease, but with high prevalence of obesity (Table 1). 75 Adjusted for age and gender, the presence of LVH identified by LVM normalized by height2.7 and height2.13 was associated with a higher proportion of outcomes than was LVH detected using LVM normalized by BSA (Figure 4). In a cohort of patients undergoing dialysis (Table 1), more subjects were classified with LVH by LVM/height2.7 compared to LVM/BSA.76 In this population, LVH classified either by normalization to BSA or height2.7 predicted total and cardiovascular mortality. However, LVM/height2.7 demonstrated better predictive ability compared to LVM/BSA (Figure 4).
For LVM assessed by CMR, two studies used MESA15 participants to compare indexing methods in their ability to predict clinical events (Table 2).18,19 Chirinos et al19 initially included MESA CMR data and echocardiography data from the Asklepios Study77 to compare LVM indexed by BSA, height, height1.7, or height2.7 in relation to the LVH classification. The authors conclude that indexation by height1.7 would provide the best description of the relationship between LVM and body size in both echocardiography and CMR assessments. However, only the white and Chinese participants from MESA and white European subjects from the Asklepios Study were included in the analyses for the allometric exponent comparisons. In this study, survival analysis to establish the best indexation procedure was shown only for the MESA population. LVH defined by LVM/height1.7 was reported to be related to all cardiovascular events, to hard cardiovascular events, and to all-cause mortality. Normalization by either height2.7 or BSA, however, failed to predict all-cause mortality (Figure 1).19 Also using MESA participants, Brumback et al18 investigated LVM indexed by BSA, height2, height2.7, and two other allometric indices (Percent-predicted LV mass based on height and gender; and Percent-predicted LV mass based on height, weight, and gender). The study found higher prevalence of hypertrophy for indices that do not account for weight, but no significant difference was detected between indices for the outcomes prediction ability.18
Gaps in knowledge
An increase in LVM is the most important component of cardiac remodeling, resulting from a not totally clear balance between cardiac stressors and compensatory mechanisms.12,28,78 However, the exact point when the increase of myocardial mass turns from an adaptation process to pathology is unknown. Obesity may be related to both adaptive and pathologic increases in LVM. Future studies should address if indexing methods can not only adjust for body size, but also account for adaptive changes in the obese and if it influences clinical decision making.
The appropriate consideration of body size in the evaluation of cardiovascular structure affects recognition and treatment of cardiovascular disease states in pediatric and adult patients.22 The best approach seems to be normalization of LVM by height to some allometric power, specifying cut-off values of normality according to gender and ethnicity. When considering the definition of the appropriate height allometric exponent, the current literature still has important gaps in knowledge. Although height1.7 seems to be promising to establish the best description for the relation between myocardial mass and body size, there are still strong limitations related to the cut-off definitions and to the reduced longitudinal data available—especially for echocardiographic assessment of LVM. In this regard, most of the longitudinal scientific evidence is still related to normalization by height2.7.
A reduction in intervertebral disk diameter occurs with aging, possibly accounting for artifactual individual changes over time in indexed parameters. Cumulative height loss from age 30 to 70 years may decrease approximately 3 cm of the original height for men and 5 cm for women.79 It affects the calculation of BSA, but should have higher impact on methods adjusted uniquely to height to an allometric power. However, the implications on LVMi of height changes related to aging are still unknown.
The majority of longitudinal studies assessing CMR-derived LVM predicting outcomes are from the MESA Study (Table 2). Although addressing a large multiethnic population, the MESA results should be tested in other populations to assess how universal are these findings. There are also unclear aspects related to the assessment of LVM by CMR regarding the left ventricular basal slices. Including or not including a more basal slice can be a major source of variability in the final LVM calculation, but this issue is not properly addressed in the literature. Based in the experience with the MESA Study, a slice by slice analysis considering base when myocardium is present in more than 50% of the short-axis circumference appears to be appropriate. MESA also set the normality range for functional CMR and showed clinical event prediction for LVM assessed by resonance.15,19,62 However, these assessments were done with the GRE technique. The fact that GRE has been replaced by SSFP urges the necessity of new standard cut-off values for normality that account for technical differences.
Although CMR showed better performance than echocardiography for accuracy and precision in LVM evaluation,33 no direct comparison of the two methods has been performed for the ability to predict clinical events, the agreement for hypertrophy classification, or the cardiovascular risk reclassification. It is unknown how concordant CMR and echocardiography are regarding hypertrophy classification—especially when different indexing methods are considered. Additionally, there is a lack of knowledge regarding the risk reclassification for LVM when compared to traditional risk assessments.52,80
We showed that LVM assessed by echocardiography has a good event prediction power, but shows major limitations related to the need of cardiac geometric assumptions. Therefore, the ASE-recommended formula should be reported in all echocardiograms performed in patients without major left ventricular remodelling. To improve accuracy and reproducibility across laboratories, strict quality control recommendations should be enforced. In this regard, the Intersocietal Accreditation Commission for Echocardiography requires the measurement of IVST, PWT, and LVID by 2D or M-mode imaging, but has no special recommendation for LVM assessment.81
The currently preferable method for LVM assessment by CMR is based in the scientific evidence collected by the MESA Study, leading to the short-axis evaluation, with exclusion of papillary muscle. In addition, to include basal slides when myocardium is present in more than 50% of the short-axis circumference would be consistent with the MESA protocol. The Intersocietal Accreditation Commission for Magnetic resonance has not any specific recommendation on LVM as criteria for quality control.82 Recommendations on standard reports and quality assessment should be consented by scientific societies.
Indexing LVM by height to the allometric power of 1.7 or 2.7 has shown the best relation to body size and events prediction. However, the references for normality are unclear. Cut-off values endorsed by the ASE are based on FI technique and are not standardized for different ethnicities. Moreover, CMR has mostly of the longitudinal scientific evidence on LVM based only on the MESA cohort of participants using GRE sequences. Standard recommendations on indexing and cut-points for hypertrophy across imaging modalities urge to match current technologies used in daily practice.
The National Heart Lung and Blood Institute’s Fourth Report on the Diagnosis, Evaluation, and Treatment of High Blood Pressure in Children and Adolescents recognizes LVH as the most prominent clinical evidence of target-organ damage caused by hypertension in children and adolescents. The guidelines incorporate LVM measurement in the evaluation algorithm, recommending intensification of antihypertensive management if there is presence of LVH. However, the role of periodic echocardiographic determination of LVMi is restricted to patients who have established LVH.24 The Eighth Report of the Joint National Committee on Prevention, Detection, Evaluation, and Treatment of High Blood Pressure (JNC-8) is expected to be released in 2012. 85 The previous edition also lists LVH as target-organ damage for the heart and an independent risk factor. Aggressive blood pressure management is described as a strategy for LVH regression. However, echocardiography is not included among the routines or even in the optional tests and procedures.25 The European Society of Cardiology Guidelines for management of arterial hypertension uses LVH as criteria of subclinical organ damage influencing prognosis. In this context, echocardiography is recommended during diagnostic evaluation for more precise stratification of overall risk and for checking the status of organ damage during follow-up visits. In a therapeutic view, effects of different drugs on LVM and LVH are discussed. However, LVMi variation is not stated among therapeutic goals.23
The way clinicians see LVM in their practice may reflect the scientific recommendations from medical societies so far. An important issue related to LVM is its restricted clinical use in daily practice in contrast to measurements of cardiac systolic function.20 In a multicenter survey performed in Italy, hypertension accounted for approximately 30 percent of echocardiographic examinations in outpatient hospitals or academic echocardiography labs.83 However, a large majority of echocardiographic examinations routinely performed on hypertensive patients did not report qualifying data on LVM, and usually the results were not indexed to anthropometric variables.83,84 New scientific statements should be consented and enforced, highlighting the role of LVM and LVH in clinical practice.
Conclusion
In the assessment of LVM, no superiority between echocardiography and CMR may be stated at this time, due to the absence of studies directly comparing the methods. Assessed by both echocardiography and CMR, LVM and LVH are reliable cardiovascular event predictors. LVM assessed by echocardiography is more practical on a clinical basis. CMR would be preferable for research and specific clinical conditions requiring higher accuracy and reproducibility. Dividing LVM by height to some allometric power is the most promising indexing method for scaling myocardial mass to body size. The measurement of LVM and a definition of LVH based on outcomes should be agreed upon by scientific societies considering all available techniques.
Acknowledgments
Funding Sources
Dr. Armstrong was funded by Universidade Federal do Vale do São Francisco (UNIVASF).
Abbreviations and Acronyms
- 2D
two-dimensional
- 3D
three-dimensional
- AHA
American Heart Association
- ASE
American Society of Echocardiography
- BSA
body-surface area
- CMR
cardiac magnetic resonance
- FI
Fundamental Imaging
- GRE
gradient-echo
- HI
harmonic imaging
- ICC
intraclass correlation coefficient
- IR GRE
inversion recovery gradient-echo
- IVST
interventricular septum thickness
- JNC-8
Eighth Report of the Joint National Committee on Prevention, Detection, Evaluation, and Treatment of High Blood Pressure
- LVID
Left ventricular internal dimension
- LVH
LVH
- LVM
LVM
- LVMi
LVM index
- MESA
Multi-Ethnic Study of Atherosclerosis
- NSF
nephrogenic systemic fibrosis
- PRESERVE
Prospective Randomized Enalapril Study Evaluating Regression of Ventricular Enlargement
- PWT
posterior wall thickness
- RF
radio-frequency
- SSFP
steady-state free precession
Footnotes
Potential Conflict of Interest
The authors have no competing interests in this study.
Contributor Information
Anderson C. Armstrong, Email: aarmst10@jhmi.edu, Johns Hopkins University/Division of Cardiology, Universidade Federal do Vale do São Francisco/School of Medicine, 600 N. Wolfe Street, Blalock 524D1, Baltimore, MD 21287.
Samuel Gidding, Email: sgidding@nemours.org, Nemours Cardiac Center/Alfred I. duPont Hospital for Children, 1600 Rockland Road, Wilmington, DE 19899.
Ola Gjesdal, Email: ola.gjesdal@online.no, Johns Hopkins University/Division of Cardiology, Johns Hopkins University/Division of Cardiology, 600 N. Wolfe Street, Blalock 524D1, Baltimore, MD 21287.
Colin Wu, Email: wuc@nhlbi.nih.gov, National Heart, Lung, and Blood Institute, NIH / Office of Biostatistics Research, 6701 Rockledge Drive, MSC 7938, Bethesda, MD 20892-7938, USA.
David A Bluemke, Email: bluemked@cc.nih.gov, National Institute of Health/Radiology and Imaging Sciences, 10 Center Drive, MSC 1074, Bethesda, Maryland 20892-1074.
João A. Lima, Email: jlima@jhmi.edu, Johns Hopkins University/Division of Cardiology, 600 N. Wolfe Street, Blalock 524D1, Baltimore, MD 21287.
References
- 1.Gidding SS. Controversies in the assessment of left ventricular mass. Hypertension. 2010;56:26–8. doi: 10.1161/HYPERTENSIONAHA.110.153346. [DOI] [PubMed] [Google Scholar]
- 2.Lorber R, Gidding SS, Daviglus ML, Colangelo LA, Liu K, Gardin JM. Influence of systolic blood pressure and body mass index on left ventricular structure in healthy African-American and white young adults: the CARDIA study. J Am Coll Cardiol. 2003;41:955–60. doi: 10.1016/s0735-1097(03)00052-4. [DOI] [PubMed] [Google Scholar]
- 3.Truong QA, Toepker M, Mahabadi AA, et al. Relation of left ventricular mass and concentric remodeling to extent of coronary artery disease by computed tomography in patients without left ventricular hypertrophy: ROMICAT study. J Hypertens. 2009;27:2472–82. doi: 10.1097/HJH.0b013e328331054a. [DOI] [PMC free article] [PubMed] [Google Scholar]
- 4.Dannenberg AL, Levy D, Garrison RJ. Impact of age on echocardiographic left ventricular mass in a healthy population (the Framingham Study) Am J Cardiol. 1989;64:1066–8. doi: 10.1016/0002-9149(89)90816-3. [DOI] [PubMed] [Google Scholar]
- 5.Gardin JM, Siscovick D, Anton-Culver H, et al. Sex, age, and disease affect echocardiographic left ventricular mass and systolic function in the free-living elderly. The Cardiovascular Health Study. Circulation. 1995;91:1739–48. doi: 10.1161/01.cir.91.6.1739. [DOI] [PubMed] [Google Scholar]
- 6.Gardin JM, Brunner D, Schreiner PJ, et al. Demographics and correlates of five-year change in echocardiographic left ventricular mass in young black and white adult men and women: the Coronary Artery Risk Development in Young Adults (CARDIA) study. J Am Coll Cardiol. 2002;40:529–35. doi: 10.1016/s0735-1097(02)01973-3. [DOI] [PubMed] [Google Scholar]
- 7.Gidding SS, Carnethon MR, Daniels S, et al. Low cardiovascular risk is associated with favorable left ventricular mass, left ventricular relative wall thickness, and left atrial size: the CARDIA study. J Am Soc Echocardiogr. 2010;23:816–22. doi: 10.1016/j.echo.2010.05.023. [DOI] [PMC free article] [PubMed] [Google Scholar]
- 8.Lieb W, Xanthakis V, Sullivan LM, et al. Longitudinal tracking of left ventricular mass over the adult life course: clinical correlates of short- and long-term change in the framingham offspring study. Circulation. 2009;119:3085–92. doi: 10.1161/CIRCULATIONAHA.108.824243. [DOI] [PMC free article] [PubMed] [Google Scholar]
- 9.Heckbert SR, Post W, Pearson GD, et al. Traditional cardiovascular risk factors in relation to left ventricular mass, volume, and systolic function by cardiac magnetic resonance imaging: the Multiethnic Study of Atherosclerosis. J Am Coll Cardiol. 2006;48:2285–92. doi: 10.1016/j.jacc.2006.03.072. [DOI] [PMC free article] [PubMed] [Google Scholar]
- 10.Meijs MF, Vergouwe Y, Cramer MJ, et al. A prediction model for left ventricular mass in patients at high cardiovascular risk. Eur J Cardiovasc Prev Rehabil. 2010;17:621–7. doi: 10.1097/HJR.0b013e328332d4bc. [DOI] [PubMed] [Google Scholar]
- 11.Tsioufis C, Taxiarchou E, Syrseloudis D, et al. Left ventricular mass but not geometry determines left atrial size in the early stages of hypertension. J Hum Hypertens. 2009;23:674–9. doi: 10.1038/jhh.2009.13. [DOI] [PubMed] [Google Scholar]
- 12.Cohn JN, Ferrari R, Sharpe N. Cardiac remodeling--concepts and clinical implications: a consensus paper from an international forum on cardiac remodeling. Behalf of an International Forum on Cardiac Remodeling. J Am Coll Cardiol. 2000;35:569–82. doi: 10.1016/s0735-1097(99)00630-0. [DOI] [PubMed] [Google Scholar]
- 13.Wong RC, Yip JW, Gupta A, Yang H, Ling LH. Echocardiographic left ventricular mass in a multiethnic Southeast Asian population: proposed new gender and age-specific norms. Echocardiography. 2008;25:805–11. doi: 10.1111/j.1540-8175.2008.00709.x. [DOI] [PubMed] [Google Scholar]
- 14.Rodriguez CJ, Diez-Roux AV, Moran A, et al. Left ventricular mass and ventricular remodeling among Hispanic subgroups compared with non-Hispanic blacks and whites: MESA (Multi-ethnic Study of Atherosclerosis) J Am Coll Cardiol. 2010;55:234–42. doi: 10.1016/j.jacc.2009.08.046. [DOI] [PMC free article] [PubMed] [Google Scholar]
- 15.Natori S, Lai S, Finn JP, et al. Cardiovascular function in multi-ethnic study of atherosclerosis: normal values by age, sex, and ethnicity. AJR Am J Roentgenol. 2006;186:S357–65. doi: 10.2214/AJR.04.1868. [DOI] [PubMed] [Google Scholar]
- 16.Lorenz CH, Walker ES, Morgan VL, Klein SS, Graham TP., Jr Normal human right and left ventricular mass, systolic function, and gender differences by cine magnetic resonance imaging. J Cardiovasc Magn Reson. 1999;1:7–21. doi: 10.3109/10976649909080829. [DOI] [PubMed] [Google Scholar]
- 17.Cuspidi C, Meani S, Negri F, et al. Indexation of left ventricular mass to body surface area and height to allometric power of 2.7: is the difference limited to obese hypertensives? J Hum Hypertens. 2009;23:728–34. doi: 10.1038/jhh.2009.16. [DOI] [PubMed] [Google Scholar]
- 18.Brumback LC, Kronmal R, Heckbert SR, et al. Body size adjustments for left ventricular mass by cardiovascular magnetic resonance and their impact on left ventricular hypertrophy classification. Int J Cardiovasc Imaging. 2010;26:459–68. doi: 10.1007/s10554-010-9584-5. [DOI] [PMC free article] [PubMed] [Google Scholar]
- 19.Chirinos JA, Segers P, De Buyzere ML, et al. Left ventricular mass: allometric scaling, normative values, effect of obesity, and prognostic performance. Hypertension. 2010;56:91–8. doi: 10.1161/HYPERTENSIONAHA.110.150250. [DOI] [PMC free article] [PubMed] [Google Scholar]
- 20.Lang RM, Bierig M, Devereux RB, et al. Recommendations for chamber quantification: a report from the American Society of Echocardiography’s Guidelines and Standards Committee and the Chamber Quantification Writing Group, developed in conjunction with the European Association of Echocardiography, a branch of the European Society of Cardiology. J Am Soc Echocardiogr. 2005;18:1440–63. doi: 10.1016/j.echo.2005.10.005. [DOI] [PubMed] [Google Scholar]
- 21.Hendel RC, Patel MR, Kramer CM, et al. ACCF/ACR/SCCT/SCMR/ASNC/NASCI/SCAI/SIR 2006 appropriateness criteria for cardiac computed tomography and cardiac magnetic resonance imaging: a report of the American College of Cardiology Foundation Quality Strategic Directions Committee Appropriateness Criteria Working Group, American College of Radiology, Society of Cardiovascular Computed Tomography, Society for Cardiovascular Magnetic Resonance, American Society of Nuclear Cardiology, North American Society for Cardiac Imaging, Society for Cardiovascular Angiography and Interventions, and Society of Interventional Radiology. J Am Coll Cardiol. 2006;48:1475–97. doi: 10.1016/j.jacc.2006.07.003. [DOI] [PubMed] [Google Scholar]
- 22.Dewey FE, Rosenthal D, Murphy DJ, Jr, Froelicher VF, Ashley EA. Does size matter?. Clinical applications of scaling cardiac size and function for body size. Circulation. 2008;117:2279–87. doi: 10.1161/CIRCULATIONAHA.107.736785. [DOI] [PubMed] [Google Scholar]
- 23.Mancia G, De Backer G, Dominiczak A, et al. 2007 Guidelines for the management of arterial hypertension: The Task Force for the Management of Arterial Hypertension of the European Society of Hypertension (ESH) and of the European Society of Cardiology (ESC) Eur Heart J. 2007;28:1462–536. doi: 10.1093/eurheartj/ehm236. [DOI] [PubMed] [Google Scholar]
- 24.The fourth report on the diagnosis, evaluation, and treatment of high blood pressure in children and adolescents. Pediatrics. 2004;114:555–76. [PubMed] [Google Scholar]
- 25.Chobanian AV, Bakris GL, Black HR, et al. The Seventh Report of the Joint National Committee on Prevention, Detection, Evaluation, and Treatment of High Blood Pressure: the JNC 7 report. JAMA. 2003;289:2560–72. doi: 10.1001/jama.289.19.2560. [DOI] [PubMed] [Google Scholar]
- 26.Cuspidi C, Esposito A, Negri F, et al. Studies on left ventricular hypertrophy regression in arterial hypertension: a clear message for the clinician? Am J Hypertens. 2008;21:458–63. doi: 10.1038/ajh.2007.85. [DOI] [PubMed] [Google Scholar]
- 27.Devereux RB, Reichek N. Echocardiographic determination of left ventricular mass in man. Anatomic validation of the method. Circulation. 1977;55:613–8. doi: 10.1161/01.cir.55.4.613. [DOI] [PubMed] [Google Scholar]
- 28.Chinali M, Aurigemma GP. Refining patterns of left ventricular hypertrophy using cardiac MRI: “brother, can you spare a paradigm?”. Circ Cardiovasc Imaging. 2010;3:129–31. doi: 10.1161/CIRCIMAGING.110.944959. [DOI] [PubMed] [Google Scholar]
- 29.Missouris CG, Forbat SM, Singer DR, Markandu ND, Underwood R, MacGregor GA. Echocardiography overestimates left ventricular mass: a comparative study with magnetic resonance imaging in patients with hypertension. J Hypertens. 1996;14:1005–10. [PubMed] [Google Scholar]
- 30.Alfakih K, Bloomer T, Bainbridge S, et al. A comparison of left ventricular mass between two-dimensional echocardiography, using fundamental and tissue harmonic imaging, and cardiac MRI in patients with hypertension. Eur J Radiol. 2004;52:103–9. doi: 10.1016/j.ejrad.2003.09.015. [DOI] [PubMed] [Google Scholar]
- 31.Perdrix L, Mansencal N, Cocheteux B, et al. How to calculate left ventricular mass in routine practice?. An echocardiographic versus cardiac magnetic resonance study. Arch Cardiovasc Dis. 2011;104:343–51. doi: 10.1016/j.acvd.2011.04.003. [DOI] [PubMed] [Google Scholar]
- 32.Palmieri V, Dahlof B, DeQuattro V, et al. Reliability of echocardiographic assessment of left ventricular structure and function: the PRESERVE study. Prospective Randomized Study Evaluating Regression of Ventricular Enlargement. J Am Coll Cardiol. 1999;34:1625–32. doi: 10.1016/s0735-1097(99)00396-4. [DOI] [PubMed] [Google Scholar]
- 33.Bottini PB, Carr AA, Prisant LM, Flickinger FW, Allison JD, Gottdiener JS. Magnetic resonance imaging compared to echocardiography to assess left ventricular mass in the hypertensive patient. Am J Hypertens. 1995;8:221–8. doi: 10.1016/0895-7061(94)00178-E. [DOI] [PubMed] [Google Scholar]
- 34.Lipshultz SE, Easley KA, Orav EJ, et al. Reliability of multicenter pediatric echocardiographic measurements of left ventricular structure and function: the prospective P(2)C(2) HIV study. Circulation. 2001;104:310–6. doi: 10.1161/01.cir.104.3.310. [DOI] [PMC free article] [PubMed] [Google Scholar]
- 35.Spratt JC, Leslie SJ, White A, Fenn L, Turnbull C, Northridge DB. Harmonic imaging improves estimation of left ventricular mass. Int J Cardiovasc Imaging. 2004;20:107–11. doi: 10.1023/b:caim.0000014047.59389.1f. [DOI] [PubMed] [Google Scholar]
- 36.Devereux RB, Alonso DR, Lutas EM, et al. Echocardiographic assessment of left ventricular hypertrophy: comparison to necropsy findings. Am J Cardiol. 1986;57:450–8. doi: 10.1016/0002-9149(86)90771-x. [DOI] [PubMed] [Google Scholar]
- 37.Schiller NB, Shah PM, Crawford M, et al. Recommendations for quantitation of the left ventricle by two-dimensional echocardiography. American Society of Echocardiography Committee on Standards, Subcommittee on Quantitation of Two-Dimensional Echocardiograms. J Am Soc Echocardiogr. 1989;2:358–67. doi: 10.1016/s0894-7317(89)80014-8. [DOI] [PubMed] [Google Scholar]
- 38.McGavigan AD, Dunn FG, Goodfield NE. Secondary harmonic imaging overestimates left ventricular mass compared to fundamental echocardiography. Eur J Echocardiogr. 2003;4:178–81. doi: 10.1016/s1525-2167(02)00164-6. [DOI] [PubMed] [Google Scholar]
- 39.de Las Fuentes L, Spence KE, Davila-Roman VG, Waggoner AD. Are normative values for LV geometry and mass based on fundamental imaging valid with use of harmonic imaging? J Am Soc Echocardiogr. 2010;23:1317–22. doi: 10.1016/j.echo.2010.08.014. [DOI] [PMC free article] [PubMed] [Google Scholar]
- 40.Childs H, Ma L, Ma M, et al. Comparison of long and short axis quantification of left ventricular volume parameters by cardiovascular magnetic resonance, with ex-vivo validation. J Cardiovasc Magn Reson. 2011;13:40. doi: 10.1186/1532-429X-13-40. [DOI] [PMC free article] [PubMed] [Google Scholar]
- 41.Janik M, Cham MD, Ross MI, et al. Effects of papillary muscles and trabeculae on left ventricular quantification: increased impact of methodological variability in patients with left ventricular hypertrophy. J Hypertens. 2008;26:1677–85. doi: 10.1097/HJH.0b013e328302ca14. [DOI] [PubMed] [Google Scholar]
- 42.Kirschbaum S, Aben JP, Baks T, et al. Accurate automatic papillary muscle identification for quantitative left ventricle mass measurements in cardiac magnetic resonance imaging. Acad Radiol. 2008;15:1227–33. doi: 10.1016/j.acra.2008.04.014. [DOI] [PubMed] [Google Scholar]
- 43.Han Y, Osborn EA, Maron MS, Manning WJ, Yeon SB. Impact of papillary and trabecular muscles on quantitative analyses of cardiac function in hypertrophic cardiomyopathy. J Magn Reson Imaging. 2009;30:1197–202. doi: 10.1002/jmri.21958. [DOI] [PubMed] [Google Scholar]
- 44.Steen H, Nasir K, Flynn E, et al. Is magnetic resonance imaging the ‘reference standard’ for cardiac functional assessment? Factors influencing measurement of left ventricular mass and volumes. Clin Res Cardiol. 2007;96:743–51. doi: 10.1007/s00392-007-0556-2. [DOI] [PubMed] [Google Scholar]
- 45.Vogel-Claussen J, Finn JP, Gomes AS, et al. Left ventricular papillary muscle mass: relationship to left ventricular mass and volumes by magnetic resonance imaging. J Comput Assist Tomogr. 2006;30:426–32. doi: 10.1097/00004728-200605000-00013. [DOI] [PubMed] [Google Scholar]
- 46.Barkhausen J, Ruehm SG, Goyen M, Buck T, Laub G, Debatin JF. MR evaluation of ventricular function: true fast imaging with steady-state precession versus fast low-angle shot cine MR imaging: feasibility study. Radiology. 2001;219:264–9. doi: 10.1148/radiology.219.1.r01ap12264. [DOI] [PubMed] [Google Scholar]
- 47.Plein S, Bloomer TN, Ridgway JP, Jones TR, Bainbridge GJ, Sivananthan MU. Steady-state free precession magnetic resonance imaging of the heart: comparison with segmented k-space gradient-echo imaging. J Magn Reson Imaging. 2001;14:230–6. doi: 10.1002/jmri.1178. [DOI] [PubMed] [Google Scholar]
- 48.Moon JC, Lorenz CH, Francis JM, Smith GC, Pennell DJ. Breath-hold FLASH and FISP cardiovascular MR imaging: left ventricular volume differences and reproducibility. Radiology. 2002;223:789–97. doi: 10.1148/radiol.2233011181. [DOI] [PubMed] [Google Scholar]
- 49.Gandy SJ, Waugh SA, Nicholas RS, Simpson HJ, Milne W, Houston JG. Comparison of the reproducibility of quantitative cardiac left ventricular assessments in healthy volunteers using different MRI scanners: a multicenter simulation. J Magn Reson Imaging. 2008;28:359–65. doi: 10.1002/jmri.21401. [DOI] [PubMed] [Google Scholar]
- 50.Gandy SJ, Waugh SA, Nicholas RS, Rajendra N, Martin P, Houston JG. MRI comparison of quantitative left ventricular structure, function and measurement reproducibility in patient cohorts with a range of clinically distinct cardiac conditions. Int J Cardiovasc Imaging. 2008;24:627–32. doi: 10.1007/s10554-008-9293-5. [DOI] [PubMed] [Google Scholar]
- 51.Bellenger NG, Davies LC, Francis JM, Coats AJ, Pennell DJ. Reduction in sample size for studies of remodeling in heart failure by the use of cardiovascular magnetic resonance. J Cardiovasc Magn Reson. 2000;2:271–8. doi: 10.3109/10976640009148691. [DOI] [PubMed] [Google Scholar]
- 52.Hlatky MA, Greenland P, Arnett DK, et al. Criteria for evaluation of novel markers of cardiovascular risk: a scientific statement from the American Heart Association. Circulation. 2009;119:2408–16. doi: 10.1161/CIRCULATIONAHA.109.192278. [DOI] [PMC free article] [PubMed] [Google Scholar]
- 53.Grothues F, Smith GC, Moon JC, et al. Comparison of interstudy reproducibility of cardiovascular magnetic resonance with two-dimensional echocardiography in normal subjects and in patients with heart failure or left ventricular hypertrophy. Am J Cardiol. 2002;90:29–34. doi: 10.1016/s0002-9149(02)02381-0. [DOI] [PubMed] [Google Scholar]
- 54.Rajappan K, Bellenger NG, Melina G, et al. Assessment of left ventricular mass regression after aortic valve replacement--cardiovascular magnetic resonance versus M-mode echocardiography. Eur J Cardiothorac Surg. 2003;24:59–65. doi: 10.1016/s1010-7940(03)00183-0. [DOI] [PubMed] [Google Scholar]
- 55.Muiesan ML, de Simone G, Ganau A, et al. Inappropriate left ventricular mass: Reliability and limitations of echocardiographic measurement for risk stratification and follow-up in single patients. J Hypertens. 2006;24:2293–8. doi: 10.1097/01.hjh.0000249709.44016.15. [DOI] [PubMed] [Google Scholar]
- 56.Soliman OI, Kirschbaum SW, van Dalen BM, et al. Accuracy and reproducibility of quantitation of left ventricular function by real-time three-dimensional echocardiography versus cardiac magnetic resonance. Am J Cardiol. 2008;102:778–83. doi: 10.1016/j.amjcard.2008.04.062. [DOI] [PubMed] [Google Scholar]
- 57.Qi X, Cogar B, Hsiung MC, et al. Live/real time three-dimensional transthoracic echocardiographic assessment of left ventricular volumes, ejection fraction, and mass compared with magnetic resonance imaging. Echocardiography. 2007;24:166–73. doi: 10.1111/j.1540-8175.2006.00428.x. [DOI] [PubMed] [Google Scholar]
- 58.Takeuchi M, Nishikage T, Mor-Avi V, et al. Measurement of left ventricular mass by real-time three-dimensional echocardiography: validation against magnetic resonance and comparison with two-dimensional and m-mode measurements. J Am Soc Echocardiogr. 2008;21:1001–5. doi: 10.1016/j.echo.2008.07.008. [DOI] [PubMed] [Google Scholar]
- 59.Chuang ML, Salton CJ, Hibberd MG, Manning WJ, Douglas PS. Relation between number of component views and accuracy of left ventricular mass determined by three-dimensional echocardiography. Am J Cardiol. 2007;99:1321–4. doi: 10.1016/j.amjcard.2006.12.045. [DOI] [PubMed] [Google Scholar]
- 60.Sugeng L, Mor-Avi V, Weinert L, et al. Quantitative assessment of left ventricular size and function: side-by-side comparison of real-time three-dimensional echocardiography and computed tomography with magnetic resonance reference. Circulation. 2006;114:654–61. doi: 10.1161/CIRCULATIONAHA.106.626143. [DOI] [PubMed] [Google Scholar]
- 61.Chuang ML, Beaudin RA, Riley MF, et al. Three-dimensional echocardiographic measurement of left ventricular mass: comparison with magnetic resonance imaging and two-dimensional echocardiographic determinations in man. Int J Card Imaging. 2000;16:347–57. doi: 10.1023/a:1026540809758. [DOI] [PubMed] [Google Scholar]
- 62.Bluemke DA, Kronmal RA, Lima JA, et al. The relationship of left ventricular mass and geometry to incident cardiovascular events: the MESA (Multi-Ethnic Study of Atherosclerosis) study. J Am Coll Cardiol. 2008;52:2148–55. doi: 10.1016/j.jacc.2008.09.014. [DOI] [PMC free article] [PubMed] [Google Scholar]
- 63.Eguchi K, Ishikawa J, Hoshide S, et al. Differential impact of left ventricular mass and relative wall thickness on cardiovascular prognosis in diabetic and nondiabetic hypertensive subjects. Am Heart J. 2007;154:79 e9–15. doi: 10.1016/j.ahj.2007.04.021. [DOI] [PubMed] [Google Scholar]
- 64.Quinones MA, Greenberg BH, Kopelen HA, et al. Echocardiographic predictors of clinical outcome in patients with left ventricular dysfunction enrolled in the SOLVD registry and trials: significance of left ventricular hypertrophy. Studies of Left Ventricular Dysfunction. J Am Coll Cardiol. 2000;35:1237–44. doi: 10.1016/s0735-1097(00)00511-8. [DOI] [PubMed] [Google Scholar]
- 65.de Simone G, Verdecchia P, Pede S, Gorini M, Maggioni AP. Prognosis of inappropriate left ventricular mass in hypertension: the MAVI Study. Hypertension. 2002;40:470–6. doi: 10.1161/01.hyp.0000034740.99323.8a. [DOI] [PubMed] [Google Scholar]
- 66.Ghali JK, Liao Y, Simmons B, Castaner A, Cao G, Cooper RS. The prognostic role of left ventricular hypertrophy in patients with or without coronary artery disease. Ann Intern Med. 1992;117:831–6. doi: 10.7326/0003-4819-117-10-831. [DOI] [PubMed] [Google Scholar]
- 67.Verdecchia P, Schillaci G, Borgioni C, et al. Prognostic significance of serial changes in left ventricular mass in essential hypertension. Circulation. 1998;97:48–54. doi: 10.1161/01.cir.97.1.48. [DOI] [PubMed] [Google Scholar]
- 68.Muiesan ML, Salvetti M, Rizzoni D, Castellano M, Donato F, Agabiti-Rosei E. Association of change in left ventricular mass with prognosis during long-term antihypertensive treatment. J Hypertens. 1995;13:1091–5. doi: 10.1097/00004872-199510000-00003. [DOI] [PubMed] [Google Scholar]
- 69.DuBois D, DuBois EF. A formula to estimate the approximate surface area if height and weight be known. 1916. Nutrition. 1989;5:303–11. discussion 12–3. [PubMed] [Google Scholar]
- 70.de Simone G, Daniels SR, Devereux RB, et al. Left ventricular mass and body size in normotensive children and adults: assessment of allometric relations and impact of overweight. J Am Coll Cardiol. 1992;20:1251–60. doi: 10.1016/0735-1097(92)90385-z. [DOI] [PubMed] [Google Scholar]
- 71.Gosse P, Jullien V, Jarnier P, Lemetayer P, Clementy J. Echocardiographic definition of left ventricular hypertrophy in the hypertensive: which method of indexation of left ventricular mass? J Hum Hypertens. 1999;13:505–9. doi: 10.1038/sj.jhh.1000885. [DOI] [PubMed] [Google Scholar]
- 72.Wachtell K, Bella JN, Liebson PR, et al. Impact of different partition values on prevalences of left ventricular hypertrophy and concentric geometry in a large hypertensive population : the LIFE study. Hypertension. 2000;35:6–12. doi: 10.1161/01.hyp.35.1.6. [DOI] [PubMed] [Google Scholar]
- 73.Vitale G, Galderisi M, Pivonello R, et al. Prevalence and determinants of left ventricular hypertrophy in acromegaly: impact of different methods of indexing left ventricular mass. Clin Endocrinol (Oxf) 2004;60:343–9. doi: 10.1111/j.1365-2265.2004.01985.x. [DOI] [PubMed] [Google Scholar]
- 74.de Simone G, Devereux RB, Maggioni AP, Gorini M, de Divitiis O, Verdecchia P. Different normalizations for body size and population attributable risk of left ventricular hypertrophy: the MAVI study. Am J Hypertens. 2005;18:1288–93. doi: 10.1016/j.amjhyper.2005.05.027. [DOI] [PubMed] [Google Scholar]
- 75.de Simone G, Kizer JR, Chinali M, et al. Normalization for body size and population-attributable risk of left ventricular hypertrophy: the Strong Heart Study. Am J Hypertens. 2005;18:191–6. doi: 10.1016/j.amjhyper.2004.08.032. [DOI] [PubMed] [Google Scholar]
- 76.Zoccali C, Benedetto FA, Mallamaci F, et al. Prognostic impact of the indexation of left ventricular mass in patients undergoing dialysis. J Am Soc Nephrol. 2001;12:2768–74. doi: 10.1681/ASN.V12122768. [DOI] [PubMed] [Google Scholar]
- 77.Rietzschel ER, De Buyzere ML, Bekaert S, et al. Rationale, design, methods and baseline characteristics of the Asklepios Study. Eur J Cardiovasc Prev Rehabil. 2007;14:179–91. doi: 10.1097/HJR.0b013e328012c380. [DOI] [PubMed] [Google Scholar]
- 78.Gjesdal O, Bluemke DA, Lima JA. Cardiac remodeling at the population level--risk factors, screening, and outcomes. Nat Rev Cardiol. 2011;8:673–85. doi: 10.1038/nrcardio.2011.154. [DOI] [PubMed] [Google Scholar]
- 79.Sorkin JD, Muller DC, Andres R. Longitudinal change in height of men and women: implications for interpretation of the body mass index: the Baltimore Longitudinal Study of Aging. Am J Epidemiol. 1999;150:969–77. doi: 10.1093/oxfordjournals.aje.a010106. [DOI] [PubMed] [Google Scholar]
- 80.Pencina MJ, D’Agostino RB, Sr, D’Agostino RB, Jr, Vasan RS. Evaluating the added predictive ability of a new marker: from area under the ROC curve to reclassification and beyond. Stat Med. 2008;27:157–72. doi: 10.1002/sim.2929. discussion 207–12. [DOI] [PubMed] [Google Scholar]
- 81.ICAEL STANDARDS FOR ACCREDITATION IN ADULT ECHOCARDIOGRAPHY TESTING. Intersocietal Accreditation Commission Echocardiography; 2010. http://www.icael.org/echo/seeking/echo_standards.htm. [Google Scholar]
- 82.IAC STANDARDS FOR MRI (ICAMRL) ACCREDITATION. Intersocietal Accreditation Commission for Magnetic Resonance. 2010. [Google Scholar]
- 83.Cuspidi C, Negri F, Giudici V, et al. Echocardiography in clinical practice: the burden of arterial hypertension. A multicenter Italian survey. J Hum Hypertens. 2010;24:395–402. doi: 10.1038/jhh.2009.78. [DOI] [PubMed] [Google Scholar]
- 84.Cuspidi C, Valerio C, Sala C, et al. The Hyper-Pract Study : a multicentre survey on the accuracy of the echocardiographic assessment of hypertensive left ventricular hypertrophy in clinical practice. Blood Press. 2008;17:124–8. doi: 10.1080/08037050802059209. [DOI] [PubMed] [Google Scholar]
- 85.The Eighth Report of the Joint National Committee on Prevention, Detection, Evaluation, and Treatment of High Blood Pressure (JNC 8) National Heart, Lung, and Blood Institute; 2011. [Accessed 08/30/2011, 2011]. at http://www.nhlbi.nih.gov/guidelines/hypertension/jnc8/index.htm. [Google Scholar]