

Abstract
Plasma membrane derived vesicles are used as a model system for the biochemical and biophysical investigations of membrane proteins and membrane organization. The most widely used vesiculation procedure relies on formaldehyde and dithiothreitol (DTT), but these active chemicals may introduce artifacts in the experimental results. Here we describe a procedure to vesiculate Chinese hamster ovary (CHO) cells, widely used for the expression of recombinant proteins, using a hypertonic vesiculation buffer containing chloride salts and no formaldehyde or DTT. We characterize the size distribution of the produced vesicles. We also show that these vesicles can be used for the biophysical characterization of interactions between membrane proteins.
Introduction
The activity of many membrane proteins is regulated by interactions with partners in the plasma membrane, and thus membrane protein interactions play a critical role in cell life and in disease 1,2. Studies of membrane protein interactions need to be performed in a native-like membrane environment in order to give accurate results 3,4. However, the membrane of live cells is not suitable for quantitative biophysical characterization due to its heterogeneity. On the other hand, model lipid systems containing purified membrane proteins are challenging to produce as the expression levels of membrane proteins are generally low and they often misfold during purification and reconstitution. Plasma membrane-derived vesicles, defined as micron sized, cytoplasm-filled spheres of membrane released by live cells, are an alternative model system for the studies of membrane proteins because they mimic the molecular structure and composition of the native cell membrane and exhibit a homogenous distribution of proteins due to the lack of a cytoskeleton 5-8.
We have used such plasma membrane derived vesicles to study the interactions between receptor tyrosine kinases (RTKs), membrane proteins which conduct biochemical signals via lateral dimerization 9,10. RTK dimerization in the vesicles is analyzed using Förster resonance energy transfer (FRET) and a methodology which yields quantitative information about dimerization propensities 11-13. For the FRET experiments, RTKs are tagged with fluorescent proteins that act either as a donor or an acceptor. Images of vesicle cross-sections are obtained and then analyzed to determine the donor and acceptor concentrations and the FRET efficiency, which are needed to calculate association constants and association free energies 11,12.
The vesicles used in our previous FRET experiments were produced by incubating cells with a vesiculation buffer containing formaldehyde and DTT, following the procedure of Scott et al. 6-8 (see Table 1). This vesiculation method is usually the method of choice for researchers, as it quickly produces many large vesicles (5 to 25 μm in size). However, the presence of formaldehyde and DTT in the system is undesirable: DTT is a reducing agent, and formaldehyde may induce membrane protein cross-linking, thereby affecting the measured level of interactions 14.
Table 1.
Vesiculation buffer recipes
Cohen et al. developed a vesiculation method that uses a hypotonic wash, followed by incubation with a “salt cocktail” osmotic buffer with the composition shown in Table 1 15. This osmotic buffer does not rupture the cells, but stresses them so they produce vesicles 15. However, this method is only effective for the highly adherent cancer cell line A431. The A431 line is an epidermoid carcinoma cell line that expresses very high levels of Epidermal Growth Factor Receptor (EGFR). It is highly sensitive to mitogenic stimuli, and is usually avoided in studies of recombinant proteins. On the other hand, cells that are widely used for the expression of recombinant proteins, such as the Chinese hamster ovary (CHO) cell line, quickly detach in the osmotic salt cocktail buffer and the vesicles cannot be purified prior to imaging.
Here we describe a new vesiculation method that uses an osmotic buffer to produce vesicles from live CHO cells without causing cell detachment. This vesiculation method relies on chloride salts and eliminates the use of formaldehyde and DTT, works in a cell line that readily over-expresses proteins, and allows easy separation of the vesicles from cell debris.
To assess whether membrane protein interactions can be studied in the vesicles produced via the new method, we characterized the dimerization of the membrane protein Fibroblast Growth Factor Receptor 3 (FGFR3). FGFR3 is an RTK that is known to form dimers in the cell membrane and to play an important role in the development of the skeletal system 16-18. Here, experiments were performed using a truncated form of the protein containing the extracellular and transmembrane domains linked to fluorescent proteins. The dimerization of this protein construct has been characterized in vesicles produced with formaldehyde and DTT 13, such that the results can be directly compared.
Here, we i) describe the vesiculation method, ii) characterize the vesicles obtained, iii) investigate the interactions of FGFR3, and iv) compare vesicles produced using the new method with those produced using the established formaldehyde/DTT vesiculation method. The results presented here show that the newly developed method of producing cell-derived vesicles is a useful tool for studies of membrane protein interactions using FRET-based detection techniques.
Materials and Methods
Cell Culture
Chinese hamster ovary (CHO) cells were cultured in Dulbecco’s modified Eagle medium supplemented with 10% fetal bovine serum (HyClone SH30070.3), 1 mM nonessential amino acids, 1.8 g/L D-glucose, and 1.5 g/L sodium bicarbonate. The cells were cultured in T25 tissue culture flasks and passed every other day.
Buffers
The hypotonic rinse buffer was phosphate-buffered saline (PBS), a solution of 1.06 mM KH2PO4, 2.97 mM Na2HPO4, and 155 mM NaCl, which was diluted to 30% using deionized water. The vesiculation buffer was a solution of 200 mM NaCl, 5 mM KCl, 0.5 mM MgCl2, and 0.75 mM CaCl2, buffered at pH 8.5 by 100 mM bicine.
Vesiculation Protocol
CHO cells were plated into a 6-well plate. For experiments with untransfected cells, the optimal seeding density was 5 × 10⁴ cells per well. These cells were grown for 36 hours before beginning the vesiculation process. For experiments with transfected cells, the optimal seeding density was 2 × 10⁴ cells per well. The cells were grown for 24 hours after seeding and then transfected with plasmids coding for the protein of interest linked to either eYFP or mCherry using FuGene HD. The cells were grown for an additional 24 hours before vesiculation.
To perform the vesiculation, each well was rinsed with 1 mL of 30% PBS and cells were incubated at room temperature for 1 minute. This rinse was performed two times. Then, 1 mL of the vesiculation buffer was added to each well and the plate was incubated for 13 hours at 37°C.
Vesicle Size Characterization
The vesicles were transferred from the 6-well plate to a Lab-Tek™ II (Nunc, Thermo Scientific) four-chambered cover slide. Transmission images of the vesicles were obtained using a Nikon Eclipse confocal laser scanning microscope with a 20x objective. To obtain a size distribution of vesicles, these images were processed using the NIS-Elements Basic Research software to manually measure vesicle diameter. The vesicle diameters were binned using MATLAB (bin size = 2 μm) to obtain a size distribution of vesicles.
Plasmid Construction
The plasmids were engineered as described previously 13. Briefly, the construct, consisting of the extracellular (EC) and transmembrane (TM) domains of FGFR3, (GGS)5 as a 15 amino acid linker, and a fluorescent protein, was cloned between the HindIII and XbaI multicloning sites of the plasmid pcDNA3.1(+).
Image Acquisition and Analysis
The vesicles were transferred from the 6-well plate to a Lab-Tek™ II (Nunc, Thermo Scientific) four-chambered cover slip. Images of vesicles were collected using a Nikon Eclipse confocal laser scanning microscope with a 60x water immersion objective and were analyzed using the Quantitative Imaging FRET (QI-FRET) method, as described previously 11. Three images (scans) were collected for each vesicle. The “donor scan” used a 488 nm excitation and collected intensity over the range of 500-530 nm. The “FRET scan” used a 488 nm excitation and collected intensity over the range of 565-615 nm. The “acceptor scan” used a 543 nm excitation and the intensity was collected with a 650 nm long pass filter. A MATLAB program developed in the lab identified a vesicle and verified that it appears in all three channels and that it is “empty”, i.e. the intensity of the membrane is much greater than the intensities of four random pixels within the vesicle. Then the program identified the boundaries of the membrane. The pixel intensities across the membrane were fitted with a Gaussian function, and the background fluorescence was modeled with an error function. Integration of the three Gaussian functions yielded the three intensities per unit membrane area 12: (from the donor scan), from the FRET scan), and (from the acceptor scan). From these intensities the dimeric fractions were calculated and averaged within bins of size 5 × 10⁻⁴ receptors/nm2 as described in detail elsewhere 12
Statistical Analysis
To determine if there is a difference between this data set (#1) and a previous one (#2), a Chi Squared value was calculated for each bin according to:
| (1) |
Here, Average1,i and Average2,i are the average dimeric fractions in each bin, i, from the two data sets. SE1,i and SE2,i are the standard errors, used to calculate the standard error for each bin, SEi, according to:
| (2) |
The p values for pairwise comparisons were calculated from the Chi Squared values, and the cut-off for significance (p = 0.0045) was calculated using the Bonferroni correction 19. The total reduced Chi Square was calculated as:
| (3) |
where df is the number of degrees of freedom. The p-values for the calculated reduced Chi Squared values were determined using a Chi Squared table 19.
Results
The chloride salts vesiculation procedure
The Chinese Hamster Ovary (CHO) cell line is widely used for expression and for studies of recombinant proteins, including membrane proteins. Vesicles are easily produced from CHO cells using the formaldehyde/DTT method, as previously reported 11,12. Vesicles also form if the salt cocktail osmotic buffer 15 is used (data not shown). However, CHO cells detach from the substrate in this osmotic buffer, and vesicles cannot be separated from cells and the cell debris, which complicates image acquisition and image processing. We therefore sought to develop a procedure which does not use formaldehyde or DTT, and does not induce CHO cell detachment.
Vesiculation and cell detachment are both part of the apoptotic response of the cell to the vesiculation buffer, and the key was to identify a useful vesiculation buffer that induces vesiculation prior to cell detachment. As many details in the progression of the vesiculation-related apoptotic response are unknown, we searched for an appropriate vesiculation buffer using a trial and error approach. A general strategy was to incorporate Ca2+, known to be important for cell-substrate binding and for cell-cell adhesion 20-24, while avoiding the precipitation of the salts in the buffer. We tested more than 30 different vesiculation recipes, until we found a recipe that successfully vesiculated CHO cells. In Supplemental Information, we show a table with 27 different recipes; only one of them did not cause cell detachment and induced vesicle production. However, we also observed that the pH, adjusted during buffer preparation, was not sustained during the vesiculation experiment. We therefore explored different buffering options and established that bicine is the optimal one.
In the new procedure, cells are rinsed twice with 30% PBS in deionized water, a hypotonic buffer which induces cell swelling. Then cells are vesiculated using a hypertonic solution of 200 mM NaCl, 5 mM KCl, 0.5 mM MgCl2, and 0.75 mM CaCl2, buffered at pH 8.5 by 100 mM bicine. This buffer does not lead to the detachment of CHO cells from the substrate such that vesicles can be easily separated from the cells by pipetting the vesiculation solution into a chambered glass slide. A transmission image of the vesicles is shown in Figure 1.
Figure 1.
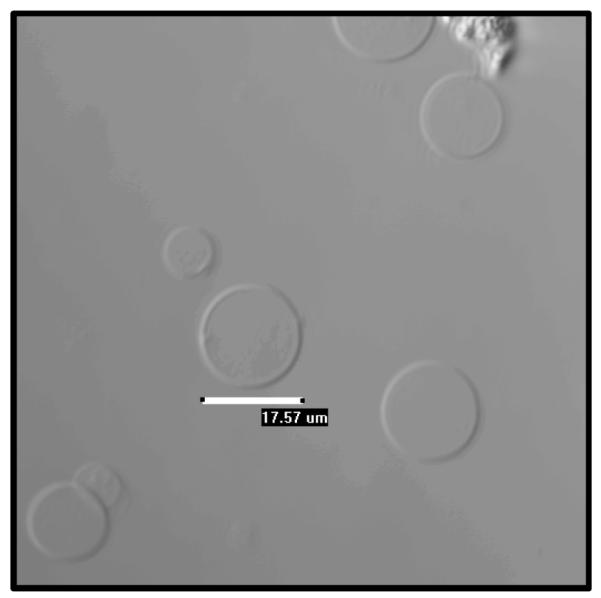
A transmission image of vesicles produced via the chloride salt vesiculation method. The image was obtained using a Nikon Eclipse confocal laser scanning microscope with a 20x objective.
Vesicle Size Characterization
Vesicle size was determined for vesicles produced from untransfected cells as described in Materials and Methods. Figure 2 is a histogram of vesicle diameters. We measured the diameter of 220 vesicles and found an average diameter of 17.2 μm with a standard deviation of 4.4 μm .
Figure 2.

Vesicle size distribution. A histogram showing the distribution of vesicle diameter for 220 vesicles. Average vesicle diameter is 17.2 μm with a standard deviation of 4.4 μm.
Membrane Protein Interactions
To investigate if these vesicles can be used for characterization of membrane protein interactions, we characterized the dimerization of an FGFR3 truncated construct that we have previously studied in vesicles produced via the formaldehyde/DTT method 13. The FGFR3 construct contained (i) the FGFR3 extracellular (EC) domain, (ii) the FGFR3 transmembrane (TM) domain, (iii) a 15 amino acid (GGS)5 linker and, (iv) a fluorescent protein, either mCherry or eYFP (a FRET pair). The plasmid design for this construct is described in detail in 13.
Plasmids encoding the eYFP and mCherry versions of this FGFR3 construct were co-transfected in CHO cells as described in Materials and Methods. After overnight cell growth, cells were vesiculated using the chloride salts vesiculation procedure described above. After the completion of the vesiculation process, the vesicles were transferred to four-chambered slides and imaged. Images were acquired with a Nikon C1 laser scanning confocal microscope using a 60x water immersion objective as described in detail in 11,12. Three different images, donor, FRET, and acceptor, were acquired for each vesicle as outlined in Materials and Methods. The three images for one such vesicle are shown in Figure 3. The images were recognized by a Matlab code and the intensities across the bilayer were then determined for each channel as described 12. The fluorescence in Figure 3 is located on the membrane as expected for membrane proteins. The fluorescence of the vesicles appears uniform (as opposed to the typical heterogeneous fluorescence of cellular membranes, not shown), suggesting that the protein distribution in the vesicle is homogeneous. Such homogeneous distribution can be expected because the vesicles lack cytoskeleton 11,12. Overall, the vesicles produced using the chloride salt osmotic buffer are practically indistinguishable in the confocal microscope from vesicles produced with the formaldehyde/DTT buffer.
Figure 3.

One vesicle co-expressing FGFR3 constructs tagged with eYFP (donor) and mCherry (acceptor), imaged in three different scans: donor (ex: 488 nm, em: 500-530 nm), FRET (ex:488nm, em: 565-615 nm) and acceptor (ex: 543nm, em: 650 nm long-pass) scans. Vesicle size is 15.6 μm in diameter.
Here we will not describe the QI-FRET method in detail as detailed protocols and discussions are already published 11-13. Briefly, the goal of the QI-FRET data processing is to determine (1) the FRET efficiency, (2) the donor concentration, and (3) the acceptor concentration in each vesicle.
Figure 4 shows a plot of the measured FRET as a function of acceptor concentration. Each point corresponds to one of the ~200 vesicles which we imaged in five independent experiments. The data from the five independent experiments were indistinguishable (not shown). The dimeric fraction was calculated for each vesicle, and the results were averaged within bins of width = 5 × 10⁻⁴ molecules/nm2. A two-state model describing monomer-dimer equilibrium was fitted to all dimeric fractions prior to binning using a non-linear least-square regression fit as described in 12, 25. Figure 5 shows the binned dimeric fraction as a function of total protein concentration and the least-square regression fit to all the data. We see that the experimental data are well described by the dimerization model. This fit yields a value for the dimerization constant K, which is then used to calculate the free energy of dimer formation according to ΔG = −RT ln(K). The calculation gave ΔG = −3.0 ± 0.1 kcal/mol (error is for a 95% confidence interval).
Figure 4.

FRET vs acceptor concentration. The black circles are the FRET efficiencies determined with the QI-FRET method for each of the ~ 200 vesicles imaged.
Figure 5.

Dimeric fraction vs total protein concentration. The dimeric fractions were obtained from FRET efficiencies shown in Figure 4. The data was fitted to a two-state dimerization model using a non-linear least-square regression. Dimeric fractions were averaged within 5 × 10⁻⁴ receptors/nm2–wide bins of total protein concentration (dimeric fraction ± standard error versus total protein concentration ± standard deviation is shown).
Discussion
The most widely used method to produce plasma membrane derived vesicles is the one introduced by Scott 40 years ago 5-8. It uses DTT and formaldehyde as vesiculants. Such vesicles have been used in the past for studies of lipid domain formation in the plasma membrane and for biochemical investigations of the IgE receptor 26-28. We have used them to characterize the thermodynamics of dimerization of two membrane proteins, GpA and FGFR3, using FRET-based detection 12,13. Yet, there are concerns about the formaldehyde/DTT vesiculation method, because of the possibility for non-specific cross-linking by the formaldehyde and the possibility for reduction of the native disulfides by DTT 14.
Different approaches have been used to address the above concerns. One is the addition of N-ethyl maleimide, which reacts with sulfhydryls on cysteine side chains to block them and prevent cross-linking 29,30. We have used high concentration of glycine after the start of vesiculation, a procedure aimed at quenching the formaldehyde 13,31. Yet, it has not been possible to assess the effects of formaldehyde and DTT, as well as glycine and other treatments, on the behavior of the membrane proteins in the vesicles.
Here we describe a new vesiculation method which utilizes an osmotic chloride salt buffer to produce vesicles from CHO cells. First, the cells are subjected to a hypotonic rinse buffer, which causes them to swell. Then, they are incubated in a salt solution for an extended period of time. The osmotic pressure stresses the cells such that they release vesicles into solution without causing substantial cell detachment. The lack of cell detachment is critical, as it is very challenging to separate the vesicles from cell debris if cell detachment occurs, making it impossible to image the vesicles and process the images in an efficient manner.
The diameter of the vesicles produced in the new chloride salt buffer did not vary significantly from day to day, with vesicle diameters consistently falling between 12 and 21 μm. The vesicle sizes were very similar to those of vesicles produced using the formaldehyde/DTT method, which have been shown to vary between 5 and 25 μm 12.
Here we characterized the dimerization of FGFR3 in the vesicles produced with the new osmotic chloride salt method. The dimerization free energy for FGFR3 measured here is −3.0 ± 0.1 kcal/mol. This result is similar to previous measurements for the dimerization of the same protein in the vesicles produced via the formaldehyde/DTT method, ΔG = −3.3 ± 0.1 kcal/mol 13. Since there appears to be a 0.3 kcal/mole difference, we asked if this difference is statistically significant. To address this question, we first re-binned the previously published dimeric fractions in the same way as done in this study, and we performed a Chi Squared Analysis, as described in Materials and Methods. The binned dimeric fractions are compared in Figure 6, and only 1 of the 11 bins shows a statistically significant difference, and only barely when the Bonferroni correction is used (p ~ 0.01, labeled “*”). The overall p value for the complete curves indicates that the difference is not statistically significant, p ~ 0.1, with the cut-off being 0.05. This analysis suggests that the two vesiculation methods produce similar model membrane vesicles, and that the measured protein interactions depend only on the physical-chemical characteristics of the cellular membrane environment and not on the method of vesicle production. Thus, it appears that the formaldehyde/DTT procedure and glycine quenching that we have used in the past produces an adequate cellular membrane model system for studies of membrane protein interactions.
Figure 6.

The dimeric fractions determined here (open circles) are compared to the dimeric fractions measured by Chen at al13 using the formaldehyde/DTT buffer (solid triangles). The dimeric fractions are shown in the center of each bin with their corresponding standard errors. The difference in the two data sets is not statistically significant (see text for details).
A question arises as to whether the newly described protocol is preferable to the formaldehyde/DTT protocol. We believe that both methods can be used, as we see no indication that the formaldehyde/DTT method produces artifacts, as long as glycine is added. In support of this view, there is evidence in the literature that formaldehyde at low concentrations does not induce significant cross-linking of membrane proteins 32. Vesiculation takes longer with the chloride salt method than with the formaldehyde/DTT method (13 hours versus 2 hours). However this is not a large experimental impediment, as vesiculation can take place overnight. It should be noted that the pH is different in the two buffers: 8.5 in the chloride salt vesiculation buffer and 7.4 in the formaldehyde/DTT buffer. Thus, performing measurements in the two different vesiculation buffers gives us the option to study the effect of pH on membrane protein interactions. As the pKa of Cysteine is around 8.0 to 8.5, the comparison of results in vesicles produced using the two methods will allow us to study the effect of cysteine oxidation on the interactions of membrane proteins that have free cysteine residues.
Supplementary Material
Acknowledgements
This work is supported by NIH Grant GM095930. We thank Sarvenaz Sarabipour for many useful discussions.
Reference List
- (1).von Heijne G. J. Mol. Biol. 1999;293:367–379. doi: 10.1006/jmbi.1999.2998. [DOI] [PubMed] [Google Scholar]
- (2).He L, Hristova K. Biochim. Biophys. Acta. 2012;1818:995–1005. doi: 10.1016/j.bbamem.2011.07.044. [DOI] [PMC free article] [PubMed] [Google Scholar]
- (3).MacKenzie KR. Chem. Rev. 2006;106:1931–1977. doi: 10.1021/cr0404388. [DOI] [PubMed] [Google Scholar]
- (4).Hong H, Joh NH, Bowie JU, Tamm LK. Methods Enzymol.: Biothermodynamics,Vol 455, Part A. 2009;455:213–236. doi: 10.1016/S0076-6879(08)04208-0. [DOI] [PubMed] [Google Scholar]
- (5).Hoerl BJ, Scott RE. Virchows Archiv B-Cell Pathology Including Molecular Pathology. 1978;27:335–345. doi: 10.1007/BF02889005. [DOI] [PubMed] [Google Scholar]
- (6).Scott RE. Science. 1976;194:743–745. doi: 10.1126/science.982044. [DOI] [PubMed] [Google Scholar]
- (7).Scott RE, Maercklein PB. J. Cell Sci. 1979;35:245–252. doi: 10.1242/jcs.35.1.245. [DOI] [PubMed] [Google Scholar]
- (8).Scott RE, Perkins RG, Zschunke MA, Hoerl BJ, Maercklein PB. J. Cell Sci. 1979;35:229–243. doi: 10.1242/jcs.35.1.229. [DOI] [PubMed] [Google Scholar]
- (9).Schlessinger J. Cell. 2000;103:211–225. doi: 10.1016/s0092-8674(00)00114-8. [DOI] [PubMed] [Google Scholar]
- (10).Li E, Hristova K. Biochemistry. 2006;45:6241–6251. doi: 10.1021/bi060609y. [DOI] [PMC free article] [PubMed] [Google Scholar]
- (11).Li E, Placone J, Merzlyakov M, Hristova K. Anal. Chem. 2008;80:5976–5985. doi: 10.1021/ac800616u. [DOI] [PubMed] [Google Scholar]
- (12).Chen L, Novicky L, Merzlyakov M, Hristov T, Hristova K. J. Am. Chem. Soc. 2010;132:3628–3635. doi: 10.1021/ja910692u. [DOI] [PMC free article] [PubMed] [Google Scholar]
- (13).Chen L, Placone J, Novicky L, Hristova K. Sci. Signaling. 2010;3:ra86. doi: 10.1126/scisignal.2001195. [DOI] [PMC free article] [PubMed] [Google Scholar]
- (14).Dapson RW. Biotech. Histochem. 2007;82:133–140. doi: 10.1080/10520290701567916. [DOI] [PubMed] [Google Scholar]
- (15).Cohen S, Ushiro H, Stoscheck C, Chinkers M. J. Biol. Chem. 1982;257:1523–1531. [PubMed] [Google Scholar]
- (16).Harada D, Yamanaka Y, Ueda K, Tanaka H, Seino Y. J. Bone Miner. Metab. 2009;27:9–15. doi: 10.1007/s00774-008-0009-7. [DOI] [PubMed] [Google Scholar]
- (17).Vajo Z, Francomano CA, Wilkin DJ. Endocr. Rev. 2000;21:23–39. doi: 10.1210/edrv.21.1.0387. [DOI] [PubMed] [Google Scholar]
- (18).Aviezer D, Golembo M, Yayon A. Curr. Drug Targets. 2003;4:353–365. doi: 10.2174/1389450033490993. [DOI] [PubMed] [Google Scholar]
- (19).Bevington PR. Data reduction and error analysis for the physical sciences. McGraw-Hill Book Company; New York: 1969. pp. 1–336. [Google Scholar]
- (20).Kirchhofer D, Grzesiak J, Pierschbacher MD. J. Biol. Chem. 1991;266:4471–4477. [PubMed] [Google Scholar]
- (21).Weiss L, Blumenson LE. J. Cell. Physiol. 1967;70:23–32. doi: 10.1002/jcp.1040700104. [DOI] [PubMed] [Google Scholar]
- (22).Gumbiner BM. Nat. Rev. Mol. Cell Biol. 2005;6:622–634. doi: 10.1038/nrm1699. [DOI] [PubMed] [Google Scholar]
- (23).Leckband D, Prakasam A. Annu. Rev. Biomed. Eng. 2006;8:259–287. doi: 10.1146/annurev.bioeng.8.061505.095753. [DOI] [PubMed] [Google Scholar]
- (24).Kim SA, Tai CY, Mok LP, Mosser EA, Schuman EM. Proc. Natl. Acad. Sci. U. S. A. 2011;108:9857–9862. doi: 10.1073/pnas.1019003108. [DOI] [PMC free article] [PubMed] [Google Scholar]
- (25).Chen L, Merzlyakov M, Cohen T, Shai Y, Hristova K. Biophys. J. 2009;96:4622–4630. doi: 10.1016/j.bpj.2009.03.004. [DOI] [PMC free article] [PubMed] [Google Scholar]
- (26).Baumgart T, Hammond AT, Sengupta P, Hess ST, Holowka DA, Baird BA, Webb WW. Proc. Natl. Acad. Sci. U. S. A. 2007;104:3165–3170. doi: 10.1073/pnas.0611357104. [DOI] [PMC free article] [PubMed] [Google Scholar]
- (27).Sengupta P, Hammond A, Holowka D, Baird B. Biochim. Biophys. Acta. 2008;1778:20–32. doi: 10.1016/j.bbamem.2007.08.028. [DOI] [PMC free article] [PubMed] [Google Scholar]
- (28).Holowka D, Baird B. Biochemistry. 1983;22:3466–3474. doi: 10.1021/bi00283a025. [DOI] [PubMed] [Google Scholar]
- (29).Levental I, Lingwood D, Grzybek M, Coskun U, Simons K. Proc. Natl. Acad. Sci. U. S. A. 2010;107:22050–22054. doi: 10.1073/pnas.1016184107. [DOI] [PMC free article] [PubMed] [Google Scholar]
- (30).Levental I, Grzybek M, Simons K. Proc. Natl. Acad. Sci. U. S. A. 2011;108:11411–11416. doi: 10.1073/pnas.1105996108. [DOI] [PMC free article] [PubMed] [Google Scholar]
- (31).Vasilescu J, Guo XC, Kast J. Proteomics. 2004;4:3845–3854. doi: 10.1002/pmic.200400856. [DOI] [PubMed] [Google Scholar]
- (32).Klockenbusch C, Kast J. J. Biomed. Biotechnol. 2010 doi: 10.1155/2010/927585. doi:10.1155/2010/927585. [DOI] [PMC free article] [PubMed] [Google Scholar]
Associated Data
This section collects any data citations, data availability statements, or supplementary materials included in this article.