

Abstract
Rigorous calculations are performed to study the effective reduction of the nonlinear excitation volumes when using phase-only masks to condition the pump and Stokes driving fields. Focal volume reduction was achieved using both a multiplicative operation of the excitation fields as well as a subtractive operation. Using a tunable optical bottle beam for the Stokes field, an effective reduction of the width of the excitation volume by a factor of 1.5 can be achieved in the focal plane. Further reduction of the focal volume introduces a rapid growth of sidelobes, which renders such volumes unsuitable for imaging applications. In addition, phase sensitive detection was found to provide information from selective sub-divisions of the engineered coherent anti-Stokes Raman scattering excitation volume. In the case of isolated nanoparticles, an apparent resolution improvement by a factor of 3 is demonstrated, and it is shown that the size of sub-diffraction-limited particles can be accurately determined using phase sensitive detection.
1. INTRODUCTION
Four-wave mixing (FWM) microscopy techniques such as third-harmonic generation (THG) [1–3], coherent anti-Stokes Raman scattering (CARS) [4,5], and stimulated Raman scattering [6,7] have grown in popularity as imaging tools in biology and nanoscience. These techniques share in common the interaction of three laser light fields with the third-order susceptibility of the material in a tightly focused volume, which induces a coherent signal. The resolution and spatial contrast in FWM microscopy are defined by both the size of the focal volume, which is a multiplication of the incident focal fields, and the far-field interference of the coherent radiation emitted by the nonlinear sources in focus. The most common implementation of these FWM techniques involves the use of linearly polarized laser fields with Gaussian beam modes and flat transverse phase fronts, which produce diffraction-limited spots in the focal region of a high numerical aperture objective lens. Using near-infrared laser fields, the typical resolution in FWM microscopy is about 300 nm for a high numerical aperture lens [8].
Besides the size of the focal spot, it is well known that interference of the induced nonlinear radiation is an important factor that determines the spatial contrast in the FWM microscope. In THG microscopy, for instance, the Gouy phase mismatch between the effective driving field and the induced radiation is substantial, introducing a vanishing THG signal in homogenous media while retaining its sensitivity to interfacial structures [9]. Other examples include the different contrast in epi-detected CARS, relative to forward detected CARS, due to the strong phase mismatch in the backward detected direction [10]. Hence, knowledge of the amplitude and phase of the induced polarization within the focal region is required in order to fully describe the imaging properties of the FWM microscope.
The spatial contrast can be altered by controlling the amplitude, phase, and polarization of the incident fields. Whereas phase and amplitude shaping of transverse beam profiles does not fundamentally produce focal volumes smaller than the diffraction limit [11], the use of alternative beam profiles in coherent nonlinear microscopy offers additional mechanisms of signal control and probing capabilities. For instance, the use of radially polarized light and annular stops has been used to improve the imaging properties of the CARS microscope [12]. Beam modes with alternative phase profiles have also been used in CARS to achieve an increased imaging sensitivity to interfaces [13–15]. In addition, the combination of beams with different polarization states and incident fields with transverse phase jumps has been used to compress the focal volume in THG imaging, producing higher resolution images relative to the resolution observed when using conventional transverse beam modes [16].
In this work, we use rigorous calculations to theoretically explore several focus engineering schemes in CARS microscopy that enable novel modes of contrast. So far, focus engineering schemes have been based on shaping the focal volume through the multiplicative interaction of phase-shaped pump and Stokes fields [13–15]. It has been suggested that the multiplicative interaction of alternative beam modes can lead to the synthesis of effective focal volumes that are smaller than what can be achieved when regular fields with flat wavefronts are used [15]. Here, we briefly discuss some examples and implications of multiplicative focal volume control in CARS microscopy. In addition, we introduce a scheme that enables focal volume control through a subtractive interaction of the pump and Stokes fields. This mechanism is unique to the dual color coherent nonlinear interaction and offers additional routes for minimizing the effective volume from which the CARS signal is emitted. Lastly, we discuss the possibility of probing information from select phase domains within the focal volume through CARS interferometry. We show that the latter scheme can be used to determine sizes of particles with sub-diffraction-limited dimensions. We discuss these schemes in the context of FWM imaging of nanostructures based on electronic CARS contrast.
2. THEORETICAL APPROACH
To accurately model the effects of phase and amplitude shaping on the CARS excitation volume, we use a fully vectorial description of the electric field. The focal field profiles of the pump and Stokes input beams in the vicinity (x , y , z) of the focal spot of a high numerical aperture lens can be written in angular spectrum representation as [17]
| (1) |
Here f is the focal length of the lens, λ is the incident wavelength, Einc refers to the incident electric field, and n1 and n2 are the refractive indices of the media before and after the objective lens, respectively. The polar and azimuthal angles are indicated by θ and φ, respectively, and θmax denotes the numerical aperture of the objective lens. Rφ and Rθ are the coordinate transformation matrices that account for refraction at the curved surface of the lens and are written as
| (2) |
| (3) |
This description enables the calculation of the focal field associated with an input field Einc of arbitrary amplitude and phase. For the simulation results presented below, the pump and Stokes wavelengths are taken as 816 and 1064 nm, respectively. The focal volume that is simulated is 1.5 μm × 1.5 μm × 3 μm in (x , y , z), respectively, with a grid size of 25 nm in all three dimensions. All simulations assume a water immersion lens with a numerical aperture of 1.1. The incident electric field Einc at the back aperture of the objective lens is assumed to be uniform in amplitude, while the phase profile is modified by the phase mask. The phase mask patterns used in this work to generate optical bottle beam (OBB) and Hermite– Gaussian10 (HG10) profiles are shown in Fig. 1 and in Fig. 5 below. The focal fields were calculated by numerically solving Eq. (1) using Simpson’s 1/3rd rule.
Fig. 1.

Schematic of the CARS excitation scheme for multiplicative focal volume shaping. The Stokes beam is reflected off the SLM and combined with the pump beam on a dichroic mirror. A typical phase mask pattern to generate an OBB at focus is also shown.
Fig. 5.

Schematic of the CARS excitation scheme for subtractive focal volume shaping. The pump beam is split in two on a 50:50 beam splitter. Ep1 propagates unaltered, whereas Ep2is modulated with a SLM and is phase delayed by π/ 2. The modified pump beams and Stokes beam are combined on a dichroic combiner and sent to the microscope. A typical phase mask pattern to generate HG10 mode is also shown.
The focal fields interact with the material’s third-order nonlinear susceptibility χ(3) to generate a nonlinear polarization in the vicinity of the focus [r ≡ (x , y , z)] [18]:
| (4) |
where ωas = 2ωp - ωS is the CARS emission wavelength, ε0 is the electric permittivity, and χ(3) is a fourth rank tensor. In this work, we will focus on FWM imaging of nanostructures based on the electronic response of the material. Within this framework, we will assume that χ(3) is purely real. The components of the complex nonlinear polarization are spatially dependent because of the effective inter-action volume and the spatial dependence of χ(3) as dictated by the sample. Changing the incident field profiles will thus change the spatial profile of P(3)(ωas, r) through the intrinsic multiplicative interaction of the pump and Stokes fields with the medium.
The nonlinear polarization acts as a source of radiation, which can be modeled by describing the polarization as a collection of dipoles that radiate coherently at ωas. The resulting electric field at a far-field coordinate point R is calculated by integrating the fields from all these dipole emitters [19]:
| (5) |
where k is the magnitude of the wave-vector of the CARS field, and
 is the excitation volume. The far-field optical intensity is obtained by integrating the far-field electric field over the far-field detection area:
| (6) |
Here θdet = 60° is the collection angle defined by the condenser lens, and R is the distance of the far-field detection surface from the focal point.
3. MULTIPLICATIVE FOCAL VOLUME SHAPING
The nonlinear polarization in the focal volume is shaped by the amplitude and phase of the incident pump and Stokes fields. In standard coherent Raman microscopy, the incident fields are usually derived from Gaussian shaped laser beams with a flat transverse phase fronts. Upon focusing, the field distribution of each incident wave is determined by diffraction, resulting in diffraction-limited volumes in the focal region. Coherent Raman interactions being nonlinear processes result in effective excitation volumes smaller than the diffraction-limited volumes of the individual fields. The multiplicative operation at the CARS focal volume can be used to tailor the focal volume profile by separately shaping the beam profiles of the input pump and Stokes. The multiplicative nature of the field interaction in coherent nonlinear microscopy opens up the possibility to generate effective excitation volumes with shapes and sizes beyond what can be achieved in linear optical microscopy. In this section we investigate through simulations the possibility of creating unique CARS excitation profiles.
Annular phase and amplitude shaping generally produces a focal volume characterized by a tighter center lobe and enhanced sidelobes. An example includes Toraldo-type focal fields, which exhibit substantial narrowing of the center lobe with increasingly higher contributions from the sidelobes [20]. The appearance of the sidelobes generally precludes the use of such focal fields for enhancing the resolution of the microscope. In CARS, however, the effect of the sidelobes of one of the excitation fields can be reduced through the multiplicative operation with the second field [15]. To examine this effect, we consider the simplest form of a Toraldo-type field, the so-called OBB [21]. An OBB is formed with an annular phase-only mask with an annular area of inner radius ρ which imparts a π phase shift to the transverse profile of the beam relative to the center core of the beam. By adjusting ρ, focal fields with a center lobe of arbitrary width can be generated at the expense of growing contributions of the sidelobes.
A schematic of the implementation of the CARS excitation scheme considered is shown in Fig. 1. The Stokes beam can be modulated with, for instance, a spatial light modulator (SLM) with concentric 0-π phase pattern as shown in the phase mask profile. The normalized radius ρ of the 0-π phase partitioning is varied, and its effect on the focal CARS excitation profile is studied below. The OBB can be considered as a superposition of Laguerre–Gaussian modes LG00 and LG02 [21]; the variation of phase partition radius redistributes energy between the two LG modes and creates different focal field profiles. Different schemes to generate OBBs using holograms [21], phase masks [22], and adjustable foci with interference of Gaussian beams [23] have been studied.
Figure 2 shows the focal field profiles in the focal plane for pump, Stokes, and the calculated CARS excitation. The pump focal field resembles an Airy disk pattern [see Fig. 2(a)] when the back aperture of the objective is illuminated with a uniform phase front [see Fig. 2(b)]. The Stokes beam is phase modulated using a phase mask with a partition radius ρ = 0.62. In this case, the Stokes field exhibits a weak center lobe and a strong donut-shaped side-lobe [see Fig. 2(c)], with the phase of the strong donut-shaped π out of phase from the weak center lobe [see Fig. 2(d)]. In the CARS excitation profile the center lobe is enhanced, and the strong donut-shaped lobe is somewhat suppressed due to the overlap of the Stokes field with the pump field [see Fig. 2(e)]. The phase profile of the FWM excitation, on the other hand, is identical to the Stokes phase profile [see Fig. 2(f)]. The full width half-maximum (FWHM) of the intensity profile of the central lobe is ~150 nm, which is about half the width of the diffraction-limited nonlinear excitation when regular beam profiles are used.
Fig. 2.
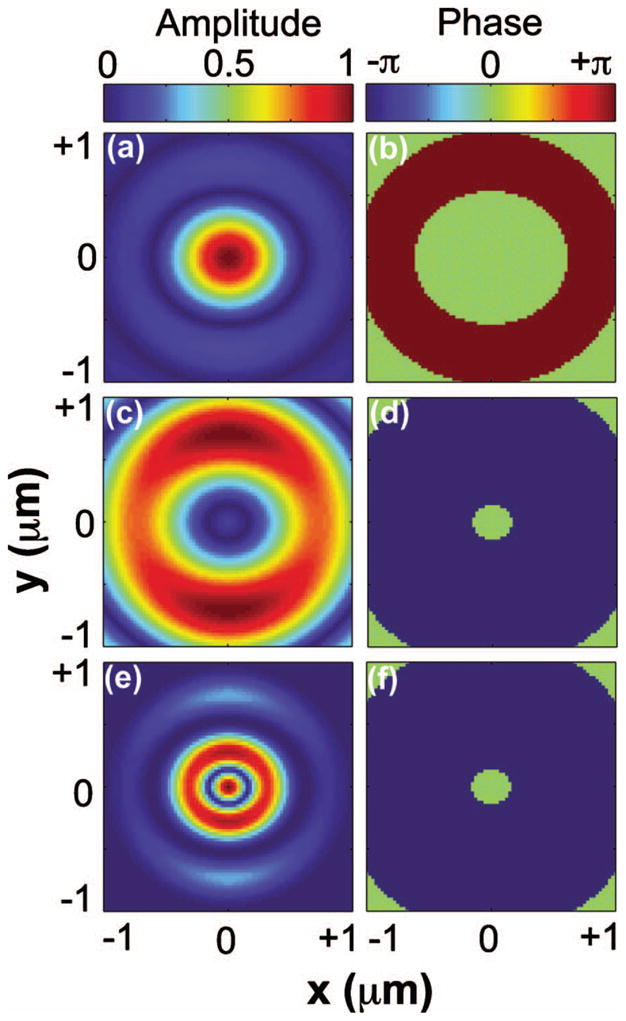
Focal field profiles in the focal plane for (a), (b) pump; (c), (d) Stokes; and (e), (f) CARS excitation. (a), (c), (e) are the amplitude profiles, and (b), (d), (f) are the phase profiles. Input beam profiles of pump and Stokes are assumed to be uniform and OBB with ρ = 0.62, respectively.
Figure 3(a) shows the lateral cross-sections of the CARS excitation volumes along the x direction in the focal plane for several values of ρ. Figure 3(b) shows similar profiles along the y direction. It is evident that as ρ is increased, the width of the center lobe is significantly reduced. Along with the reduction of the center lobe, the sidelobes gain more prominence with increasing values of ρ. To illustrate the relation between the center lobe and the sidelobes, we next vary the phase partition radius ρ of the OBB and study its effect on the CARS excitation profile. Figure 4(a) shows the variation of the center lobe FWHM of the nonlinear excitation volume as the phase partition radius of the stokes OBB profile is varied from 0.6 to 0.635. Although the range of ρ appears narrow, the recent availability of high definition SLM panels with a pixel resolution of 1920 × 1080 would help to achieve fine control of the radius [24]. When compared to the uniform input excitation case (also shown in the figure), the OBB excitation exhibits a center lobe with an adjustable width that is significantly narrower. At ρ = 0.635, a perfect OBB is achieved with a central null surrounded by light intensity in all three dimensions [21]. Note that the lateral width of the CARS excitation volume is slightly wider along the x direction relative to the y direction due to the assumed x polarization of the incident light. The reduction of the center lobe width in this situation comes at the expense of the enhancement of the sidelobe intensity. Figure 4(b) shows the sidelobe to center lobe intensity ratio as the phase partition ratio is varied. The sidelobe intensity grows almost exponentially as the width of the center lobe is reduced. As explained in Fig. 2(f), the center lobe is still π out of phase from the sidelobe until the center lobe pinches to zero, when the phase of the center region becomes uniform across the focal field.
Fig. 3.

Lateral cross-sections of the CARS excitation profiles along (a) x and (b) y directions in the focal plane for different phase partition radii ρ. Blue squares: ρ = 0.60 and red circles: ρ = 0.62. Also shown in black triangles is the uniform input excitation profile for comparison. Solid curves are a guide to the eye.
Fig. 4.

(a) Variation of central-lobe FWHM as a function of phase partition radius ρ of the OBB. (b) Variation of the sidelobe to center lobe intensity ratio as a function of ρ. Blue diamond: along x direction; red circles: along y direction. FWHM with Gaussian input along x and y directions is shown in blue dashed and red dotted lines, respectively, in (a). Solid curves are a guide to the eye.
Such adjustable bottle beam excitations offer interesting possibilities for shaping the focal profile of CARS excitation. The simulations above show that focal volume partitioning of the CARS excitation volume can be achieved. The partitioning of the focal volume comes at the expense of the growth of the sidelobes of the excitation profile. Thus resolution enhancement has to be balanced with the increase in sidelobe intensity which generally interferes with the narrow central lobe in far-field detection schemes. Although partitioning the CARS excitation volume into smaller segments introduces a sharp loss of amplitude in the smallest partitioning, each subdivision of the volume is assigned with a precisely defined phase. Hence, in terms of spatial phase, the focal volume can be partitioned into progressively smaller volumes that are demarcated with clear π phase steps. When using interferometric detection, these smaller focal phase volumes can be used to retrieve size information of particles with sub-diffracted-limited dimensions, as further discussed in Section 5.
It should be noted that the simulations presented above consider only the focal plane. The phase front of the effective CARS excitation volume in regions away from the focal plane is no longer uniform. Nonetheless, in regions close to the focal plane the phase variations are small, and the conclusions drawn from the above simulations still hold. Such focus engineering techniques are thus expected to be very useful for nanostructure imaging on glass substrates, where the objects are confined to a surface plane.
4. SUBTRACTIVE FOCAL VOLUME SHAPING
Although shaping the CARS excitation volume through the multiplicative interaction of the fields with the material gives access to a wide variety of effective focal excitation fields, the multiplicative operation ultimately puts restraints on the attainable size of the focal volume. In this section we show that the dual color coherent Raman process allows for a different kind of mathematical operation with the excitation fields, which expands the palette of achievable shapes and sizes of the CARS excitation volume. In particular, we describe focal volume engineering through an effective subtractive interaction of the CARS excitation profile.
A schematic of the scheme is shown in Fig. 5. The input pump beam, with a uniform amplitude and a flat phase, is directed to an interferometer. After the beam is split into two on a 50:50 beam splitter, one replica of the pulse, Ep2, is reflected off a SLM, whereas the other copy of the pulse, Ep1, propagates through the interferometer unaltered. The transverse phase profile Ep2is modified by the SLM and recombined with the Ep1 field. The phase delay between the two pump fields is set to π/ 2, which ensures that the two fields do not interfere at the combining beam splitter. The two pump beams are subsequently collinearly overlapped with the Stokes beam on a dichroic mirror and sent to the microscope. Upon focusing, the CARS polarization can be written as follows:
| (7) |
Equation (7) shows that the CARS excitation consists of an excitation field formed by Ep1, an excitation field formed by Ep2, and a combination term that depends on both Ep1 and Ep2. Due to the square dependence on the pump field, the π/ 2 phase shift translates into a π phase shift in the CARS excitation. The result is an effective in-phase excitation field that contains the subtractive term in addition to the combination term. The latter term is π/ 2 phase shifted with respect to the other terms, and thus does not interfere with the rest of the in-phase excitation volume. Within the approximation that the electronic response from the nanostructure is purely real, the combination term can be easily discriminated from the other components using interferometric techniques [25,26].
Figure 6 shows the simulation results of the subtractive operation. The incident Ep1 field is assumed to have a uniform amplitude and a flat transverse phase profile, whereas the incident Ep2field is uniform in amplitude with a transverse one-dimensional π step, similar to the phase profile associated with a HG10 beam mode. The HG10 profile is achieved by applying a 0-π phase partition of the beam at the panel of the SLM [13]. The HG10 mode serves here merely as a one-dimensional example to demonstrate the principle of subtractive focal volume engineering, as other phase patterns can be used to achieve more complex excitation volumes. Figures 6(a)–6(d) show the amplitude and phase profile of the different terms that contribute to the in-phase CARS excitation volume. Note that both the in-phase excitation profiles are found to have uniform phase fronts anywhere in the region where the amplitude of the field is significant. Figures 6(e) and 6(f) show the sum of the first two terms shown in Figs. 6(a)–6(d). The two terms are π out of phase; hence the effective excitation volume is formed by subtracting the excitation profiles associated with these terms. The result is a much narrower central lobe along the x direction, in addition to the growth of sidelobes. Note that the sidelobes are π out of phase with the center lobe. Figures 6(g) and 6(h) show the combination term, which preserves the π phase step of the HG01 mode. In what follows, we will examine the shape of this subtractive CARS excitation volume, which we will refer to as the in-phase excitation profile.
Fig. 6.

CARS excitation profiles at the focal plane for (a),(b) ; (c), (d) ; (e), (f) ; and (g), (h) terms. (a), (c), (e), (g) are the amplitude profiles, and (b), (d), (f), the phase profiles. Input beam profiles of pump 1 and Stokes are assumed to be uniform, while pump 2 is HG10 mode.
Since the net in-phase CARS excitation profile is determined by the subtraction operation of the CARS excitation profiles of Ep1 and Ep2, the widths of the central lobe and sidelobes can be varied by adjusting the relative field strengths of the two pump fields. This is illustrated in Fig. 7, in which the intensity of the CARS excitation profile is shown as the intensity ratio |Ep2/ Ep1|2 is varied. The intensity ratio that varied from 1 to 2 results in narrowing of the CARS central lobe from 210 to 160 nm. For comparison, the nonlinear excitation intensity for uniform pump and Stokes inputs is also shown. The increase in |Ep2/ Ep1|2 results in an increase in the sidelobes. The subtractive operation described here can be compared with the multiplicative operation described in Section 3. In the multiplicative operation, the widths and strength of the sidelobes were determined solely by the phase partitioning radius of the phase mask and not by the relative intensities of the incident beams. In contrast, the subtractive operation introduces additional controllability of the excitation volume by adjusting the relative intensity ratio of the two pump beams.
Fig. 7.

Lateral cross-sections of the CARS excitation profiles along x direction for subtractive focal volume shaping for various pump intensity ratios, |Ep2/ Ep1|2. Blue squares: |Ep2/ Ep1|2 = 1 and red circles: |Ep2/ Ep1|2 = 2. Also shown in black triangles is uniform input excitation profile for comparison. Solid curves are a guide to the eye.
A similar subtraction operation can also be implemented in a coherent Stokes Raman scattering (CSRS) scheme. In the analogous CSRS scheme, the Stokes beam is split in ES1 and ES2, where ES1 is dressed with a phase pattern. The resulting in-phase focal volume is of the form . In fact, in the CSRS implementation, the relative reduction of the excitation volume is expected to be more significant than in CARS, because the intrinsically narrower Ep focal field brings about a more effective suppression of the sidelobes.
5. APPLICATIONS OF FOCAL SHAPING
In this section we discuss several implications and tentative applications of the focal volume operations discussed in Sections 3 and 4. These include the effective reduction of the CARS excitation volume for imaging with enhanced resolution, interferometric detection of focal compartments, and size selection of sub-diffraction-limited particles.
A. Effective Reduction of Focal Volume
Reduction of the focal nonlinear excitation volume results in an improvement of the imaging resolution. Similar to the improved resolution achieved in fluorescence microscopy, a higher resolution in FWM microscopy is desirable for resolving structures that remain hidden from view when visualized with regular excitation beams. Unlike fluorescence techniques, however, resolution enhancement based on saturating transitions in molecules is not straightforwardly achieved in CARS microscopy. Saturating two-photon Raman resonances typically involves excitation energies that are detrimental to the sample integrity. Depleting vibrational coherences through direct infrared excitation in combination with Raman sensitive probing has been suggested as a possible route to produce tighter focal volumes in nonlinear Raman microscopy [27]. An alternative scheme based on measuring spatially varying Rabi oscillations has also been proposed [28]. Although resolution as low as 65 nm has been predicted, the need of high power for coherence depletion and the need for specialized energy states in the material for depletion may pose practical challenges for implementation. In this context, techniques for resolution enhancement requiring much lower power levels and more generic imaging conditions would be desirable. The focal volume operations described in this paper are all valid for weak field interactions and are relatively simple to implement. Below we briefly discuss the implications of the multiplicative and subtractive focus engineering operations for CARS imaging with improved resolution.
The multiplication and subtraction operations result in CARS excitation profiles that have a narrower central lobe and an increasing sidelobe strength as the phase mask profile or pump power ratio is varied, respectively. Because CARS is a coherent technique, the presence of sidelobes results in undesirable interference of these contributions with the radiation from the center lobe when detected in the far-field. Thus, a maximum reduction of the center lobe width has to be balanced with the sidelobe strength. The CARS excitation FWHM for the case of uniform pump and Stokes inputs is ~340 nm (see Fig. 4). With the multiplicative CARS scheme, using an OBB this is reduced to ~210 and 150 nm as the OBB parameter ρ is varied from 0.60 to 0.62, respectively (see Fig. 3). At the same time, the sidelobe strengths are ~4% and 65% relative to the central lobe. In the subtractive CARS scheme, the FWHM reduces to ~210 and 160 nm as the |Ep2/ Ep1|2 ratio is fixed at 1 and 2, respectively (see Fig. 7). The increases in the sidelobe strength are ~25% and 125%, respectively. Under the condition of keeping the sidelobes to less than 5% of the central lobe, these focus engineering schemes make it possible to achieve an effective reduction of the excitation FWHM by a factor of 1.5. Further reduction in focal volume leads to a rapid increase in sidelobes, which renders such focal volumes unsuitable for resolution enhancement.
The OBB profiles considered above are achieved with binary 0-π phase masks, which are simple Toraldo-style pupil phase masks [20]. More complex multi-zone annular pupil functions have been extensively studied [29,30] and implemented in confocal microscopy techniques [31,32]. The radius of the multiple phase zones can be carefully chosen to achieve the required central-lobe width, and the number of concentric rings used determines the separation of the center lobe from the sidelobes. In Fig. 8, we show a comparison between the CARS excitation profile created with an OBB excitation volume and an excitation volume formed by using a higher-order Toraldo-style phase mask. The phase mask was set to have four phase zones, with 0-π jumps at positions ρ = 0.2, 0.4, and 0.735. For the same widths of the center lobe, the higher-order phase mask exhibits slightly lower sidelobes, but the overall improvement is marginal. We observe a similar patterns when the ρ values of this phase mask are varied relative to the values used above. Hence, a further significant reduction of the center lobe without introducing substantial sidelobe contributions is not expected when using higher-order Toraldo (phase-only) masks for CARS resolution enhancement.
Fig. 8.

Comparison of x direction profiles of CARS excitation at the focal plane for OBB with ρ = 0.60 (blue circles) and four-zone Toraldo-style phase mask with 0-π phase jumps at ρ = 0.2, 0.4, and 0.735 (red squares). Slight reduction in sidelobe intensity is achieved for identical FWHM of center lobe. Solid curves are a guide to the eye.
B. Interferometric Detection of Focal Compartments
In Sections 3 and 4 we discussed the ability to partition the CARS excitation focal volume into smaller compartments relative to the volume achieved when using uniform illumination. These smaller focal compartments are π phase shifted relative to adjacent parts of the focus and are thus well demarcated. In this subsection, an interferometric scheme to extract information from individual focal phase compartments through far-field detection is considered. Interferometric CARS has been extensively used as a technique to reject the non-resonant electronic background and to selectively detect the vibrationally resonant CARS response [25,33]. In this illustration, the CARS excitation volume is allowed to interfere with a local oscillator field of frequency ωas in the vicinity of the focus. We will assume that the local oscillator (LO) is in-phase with the center lobe and is π out of phase with the sidelobes. Writing the induced CARS field as , the net CARS intensity due to the interference of the induced and LO fields can be written as
| (8) |
where Θ is the phase difference between the induced and LO fields. The cross term is positive when the induced field is in-phase with the LO field and negative when it is out of phase. This concept has been used to demonstrate interferometric switching of the CARS signal in the focal volume [34].
We consider the simple case of a 50 nm cube object as the CARS active medium, which is placed at the focal plane and is scanned along the x direction with a scan step of 50 nm. The LO profile corresponds to the focal field associated with a uniform incident field. The CARS excitation profile is assumed to be amplitude modulated at frequency Ω , and the far-field intensity is detected at this modulation frequency with lock-in detection. In Figs. 9(a) and 9(b) an OBB CARS excitation volume is chosen that exhibits a flat phase region in the center with a diameter of 200 nm. Figure 9(c) displays the simulated lock-in signal (normalized to the LO signal) when the 50 nm object is scanned laterally through focus in the x direction. When the object is in the center, the lock-in signal is positive. Upon scanning away from the center lobe, the phase of the focal volume switches by π, and the lock-in signal turns negative. The lateral width of the registered signal, as defined by the points where the signal switches sign, resembles the width of the center phase region of the excitation volume.
Fig. 9.

Interferometric detection of focal volume compartments of CARS excitation profile with 200 nm diameter of center lobe. (a) and (b) show the amplitude and phase profiles of CARS excitation at the focal plane. (c) Simulated lock-in signal (normalized to LO signal) detected in far-field with a 50 nm object is scanned laterally through focus along x direction.
In Fig. 10, the same experiment is now simulated for a phase mask that gives rise to a flat phase center region with a diameter of 100 nm. The simulated lock-in signal (normalized to LO signal) of the lateral scan, shown in Fig. 10(c), shows a profile similar to the one calculated in Fig. 9(c). However, the scan positions where the lock-in signal changes sign are now found to occur at locations separated by only ~100 nm. This reduced width reflects the reduced width of the center region of the CARS excitation volume. Note that the baseline [solid line in Fig. 10(c)] provides a precisely defined zero reference, which constitutes a clear discrimination between in-phase (positive) and out-of-phase (negative) components. This method effectively removes the contributions from the sidelobes through phase discrimination. When the positive signal is used for imaging the object, the structure is visualized with an apparent resolution of ~100 nm. Hence, while the amplitude profile alone does not provide spatial information below 300 nm, the use of the additional phase information enables a clear spatial demarcation at length scales down to 100 nm.
Fig. 10.

Interferometric detection of focal volume compartments of CARS excitation profile with 100 nm diameter of center lobe. (a) and (b) show the amplitude and phase profiles of CARS excitation at the focal plane. (c) Simulated lock-in signal (normalized to LO signal) detected in far-field with a 50 nm object is scanned laterally through focus along x direction.
The example above shows that the interferometric detection of the CARS excitation phase profile in the far-field can be used to visualize individual structures at an apparent resolution as set by the center-lobe width. Given that the width of the center lobe can be scaled arbitrarily small, nano-sized structures can thus be imaged at their natural length scales with this method. This would provide a more direct form of effective resolution improvement compared to super-resolution methods based on particle localization, which rely on some form of fitting. The calculations discussed above suggest the feasibility of visualizing individual objects with an effective resolution improvement of more than three times relative to conventional CARS imaging. This improvement is more than what is typically obtained by maximizing the optical transfer function of the imaging system. The effective resolution improvement here is achieved by extracting the information provided by both the amplitude and phase of the focal excitation volume, as opposed to using just the amplitude information contained in the focus.
It should be emphasized that the results discussed here deal with only a single isolated particle scanned across the focal volume. The presence of multiple particles or a large homogeneous sample in the focal volume would result in interference of the CARS excitation signals from different segments, which would make it difficult to correctly decode the phase profile. The visualization method discussed here is thus not a general resolution enhancement method for CARS microscopy. Nonetheless, there are numerous problems in nanoscience in which the visualization of isolated nanostructures at their natural length scales can be useful. For instance, CARS excitation schemes have been used to detect the nonlinear response of plasmonic nanostructures [35,36]. A higher resolution would be highly desirable for mapping out the spatial distribution of the surface plasmon polarizability on individual nanostructures. The CARS focal volume partitioning and interferometric detection may help to map out such details.
C. Size Selection of Sub-Diffraction-Limited Particles
The interferometric detection scheme described above allows not only for the visualization of nanostructures with somewhat higher effective resolution, but also for the determination of the size of the object. For a given size of the nano-object positioned at the center of the focal spot, the sign of the lock-in signal depends on the width of the center lobe of the CARS excitation profile. This effect can be understood as follows: assume that the object is positioned in the center of the focal volume, and that it is illuminated with an OBB CARS excitation scheme as discussed in Section 3. Initially, the width of the center lobe is wider than the dimensions of the nanostructure, and the detected interferometric CARS signal is positive. Upon reducing the size of the center lobe, there will be a point when parts of the nanostructure are exposed to the out-of-phase portions of the excitation volume. The out-of-phase contributions will destructively interfere with the in-phase contributions from the center region of the excitation volume. The positive signal is consequently reduced and turns negative upon further narrowing of the center peak. The change form positive to negative signal directly correlates with the size of the object. This process is readily accomplished by rapidly scanning the ρ parameter with the SLM while monitoring the sign of the interferometric CARS signal.
Figure 11 shows the simulation results of the lock-in signals obtained from cube particles with an x diameter varied from 25 to 250 nm. When the full width of the center lobe in the excitation volume is set to 100 nm, all particles with diameters lower than ~120 nm produce a positive signal on the lock-in detector. All particles larger than this diameter produce a negative signal on the detector. When the width of the center lobe is changed to 150 nm, all particles up to ~200 nm yield a positive interferometric CARS signal. These calculations reveal the relationship between the sign of the signal and the size of the particle as shown in the inset of Fig. 11. Hence, the ρ parameter is directly related to the size of the particle. This correlation implies that by scanning ρ on the SLM, the size of the nanoscopic particles can be determined. Note that the key parameter here is the sign reversal of the signal and not the amplitude of the signal. This implies that the measurement is insensitive to amplitude effects such as intrinsic amplitude variations between materials, particle scattering, and laser fluctuations. We also note that, in principle, particle size information can be obtained by comparing the CARS signal detected in the forward direction with the signal in the epi-direction [10]. Nonetheless, such forward-to-epi (F/E) ratio measurements do not provide a single-valued correlation between the F/E ratio and the size of the particle, and are prone to scattering artifacts. In contrast, the focal volume partitioning discussed here provides a direct correlation between the sign of the interferometric CARS signal and the size of the sub-diffraction-limited particle.
Fig. 11.

Lock-in signal (normalized to LO signal) obtained from particles of varying sizes. Two different CARS excitation profiles are considered. Red circles: 100 nm diameter of center lobe; blue squares: 150 nm diameter of center lobe. Solid lines are a guide to the eye. The inset shows the relation between the zero crossing width and the size of the particle.
The reduction of the center lobe is accompanied by a loss of amplitude at the center portions of the focal volume. This naturally leads to a lowering of the signal when the center lobe is tuned progressively smaller. This signal decrease can be offset by tuning the excitation power such that the center lobe remains at a constant amplitude while tuning the ρ parameter on the phase shaper. Note also that because the signal is interferometrically detected with a strong local oscillator, the computed signal at the detector is stronger than the regular (non-interferometric) CARS signal for all particle sizes examined here. Hence, an alternative means to compensate for the amplitude loss of the central lobe is to increase the amplitude of the local oscillator within the window for shot-noise-limited detection.
6. CONCLUSIONS
In this work we have discussed several focal engineering schemes that can be used to achieve an effective reduction of the CARS excitation volume. The nonlinear multiplicative nature of the excitation fields in multicolor coherent Raman microscopy allows for additional routes to shape the focal excitation volume relative to linear microscopic methods. The most direct implementation of focal volume reduction is through phase shaping of one of the excitation fields and achieving reduction of the center lobe of the excitation volume through the multiplicative interaction of the fields with the material’s nonlinear susceptibility. We have studied the simplest form of Toraldo-style phase masks, the so-called optical bottle beam (OBB). A reduction of center lobe by a factor of 1.5 can be achieved without introducing significant sidelobes. Further reduction of the center lobe is associated with the rapid growth of the sidelobes, which renders such volumes unattractive for imaging applications. Higher-order Toraldo-style phase masks can be used to reduce the sidelobes, but the improvement was found to be marginal.
We also examined a focal engineering scheme in which an effective subtraction of the excitation field profiles is achieved. This scheme is unique to the third-order nonlinearity of coherent Raman interactions, and can be used to generate effective excitation volumes with shapes beyond what can be achieved with multiplicative schemes alone. When applied to minimizing the excitation volume, a considerable reduction of the center lobe was achieved at the expense of higher sidelobes.
Beyond the direct resolution enhancement provided by these focal engineering methods, they may also find interesting applications in combination with interferometric detection of the CARS signal. We have found that subdivisions of the focal volume can be selectively detected and assigned with a well-defined phase. The detected subdivisions can be much smaller than the overall volume of the focus. This phase selectivity can be used for rejecting the contributions from the sidelobes by registering only the in-phase contributions from the center lobe, producing an apparent resolution enhancement. Although not suitable for general imaging applications, this form of resolution enhancement can be used to visualize nanostructures directly at their natural length scales. Such an approach does not rely on localization fitting of point source images but provides an actual image of the nanostructure instead. In addition, by registering the phase of the CARS signal, sizes of sub-diffraction-limited particles can be determined by scanning the size of the center lobe of the CARS excitation volume. This size-selective measurement is insensitive to amplitude variations but relies on the reversal of the phase of the optical signal instead.
The rigorous calculations and examples discussed in this work illustrate that focal engineering in CARS in combination with phase sensitive detection gives access to sub-diffraction-limited spatial information within the diffraction-limited focal volume. The use of phase detection provides an additional handle that can help to discriminate between focal compartments with different spatial phases. Since the center compartment, which has a precisely defined phase, can be tuned to an arbitrarily small size, spatial information from volumes much smaller than regular excitation volumes can be attained. These methods are expected to be useful complements to FWM imaging studies of nanostructures.
Acknowledgments
This work is supported by National Science Foundation (NSF) Grant No. CHE-0847097.
References
- 1.Müller M, Squier J, Wilson KR, Brakenhoff GJ. 3D-microscopy of transparent objects using third-harmonic generation. J Microsc. 1998;191:266–274. doi: 10.1046/j.1365-2818.1998.00399.x. [DOI] [PubMed] [Google Scholar]
- 2.Squier J, Müller M, Brakenhoff GJ, Wilson KR. Third harmonic generation microscopy. Opt Express. 1998;3:315–324. doi: 10.1364/oe.3.000315. [DOI] [PubMed] [Google Scholar]
- 3.Yelin D, Silberberg Y. Laser scanning third-harmonic-generation microscopy in biology. Opt Express. 1999;5:169–175. doi: 10.1364/oe.5.000169. [DOI] [PubMed] [Google Scholar]
- 4.Zumbusch A, Holtom G, Xie XS. Vibrational microscopy using coherent anti-Stokes Raman scattering. Phys Rev Lett. 1999;82:4142–4145. [Google Scholar]
- 5.Evans CL, Xie XS. Coherent anti-Stokes Raman scattering microscopy: chemical imaging for biology and medicine. Annu Rev Anal Chem. 2008;1:883–909. doi: 10.1146/annurev.anchem.1.031207.112754. [DOI] [PubMed] [Google Scholar]
- 6.Ploetz E, Laimgruber S, Berner S, Zinth W, Gilch P. Femtosecond stimulated Raman microscopy. Appl Phys B. 2007;87:389–393. [Google Scholar]
- 7.Freudiger CW, Min W, Saar BG, Lu S, Holtom GR, He C, Tsai JC, Kang JX, Xie XS. Label-free biomedical imaging with high sensitivity by stimulated Raman scattering microscopy. Science. 2008;322:1857–1861. doi: 10.1126/science.1165758. [DOI] [PMC free article] [PubMed] [Google Scholar]
- 8.Cheng JX, Xie XS. Coherent anti-Stokes Raman scattering microscopy: instrumentation, theory and applications. J Phys Chem B. 2004;108:827–840. [Google Scholar]
- 9.Cheng JX, Xie XS. Green’s function formulation for third-harmonic generation microscopy. J Opt Soc Am B. 2002;19:1604–1610. [Google Scholar]
- 10.Cheng JX, Volkmer A, Xie XS. Theoretical and experimental characterization of coherent anti-Stokes Raman scattering microscopy. J Opt Soc Am B. 2002;19:1363–1375. [Google Scholar]
- 11.Davis BJ, Karl WC, Swan AK, Unlu MS, Goldberg BB. Capabilities and limitations of pupil-plane filters for superresolution and image enhancement. Opt Express. 2004;12:4150–4156. doi: 10.1364/opex.12.004150. [DOI] [PubMed] [Google Scholar]
- 12.Lin J, Lu F, Wang H, Zheng W, Sheppard CJR, Huang Z. Improved contrast radially polarized coherent anti-Stokes Raman scattering microscopy using annular aperture detection. Appl Phys Lett. 2009;95:133703. [Google Scholar]
- 13.Krishnamachari VV, Potma EO. Focus-engineered coherent anti-Stokes Raman scattering: a numerical investigation. J Opt Soc Am A. 2007;24:1138–1147. doi: 10.1364/josaa.24.001138. [DOI] [PubMed] [Google Scholar]
- 14.Krishnamachari VV, Potma EO. Multi-dimensional differential imaging with Focus engineered CARS microscopy. Vib Spectrosc. 2009;50:10–14. [Google Scholar]
- 15.Beversluis MR, Stranick SJ. Enhanced contrast coherent anti-Stokes Raman scattering microscopy using annular phase masks. Appl Phys Lett. 2008;93:231115. [Google Scholar]
- 16.Masihzadeh O, Schlup P, Bartels RA. Enhanced spatial resolution in third-harmonic microscopy through polarization switching. Opt Lett. 2009;34:1240–1242. doi: 10.1364/ol.34.001240. [DOI] [PubMed] [Google Scholar]
- 17.Richards B, Wolf E. Electromagnetic diffraction in optical systems II: Structure of the image field in an aplanatic system. Proc R Soc London, Ser A. 1959;253:358–379. [Google Scholar]
- 18.Boyd RW. Nonlinear Optics. Academic; 2003. [Google Scholar]
- 19.Novotny L, Hecht B. Principles of Nano-optics. Cambridge University Press; 2006. [Google Scholar]
- 20.Toraldo di Francia G. Nuovo pupille superrisolvente. Atti Fond Giorgio Ronchi. 1952;7:366–372. [Google Scholar]
- 21.Arlt J, Padgett MJ. Generation of a beam with a dark focus surrounded by regions of higher intensity: the optical bottle beam. Opt Lett. 2000;25:191–193. doi: 10.1364/ol.25.000191. [DOI] [PubMed] [Google Scholar]
- 22.Ozeri R, Khaykovich L, Davidson N. Long spin relaxation times in a single-beam blue-detuned optical trap. Phys Rev A. 1999;59:R1750–R1753. [Google Scholar]
- 23.Yelin D, Bouma BE, Tearney GJ. Generating an adjustable three-dimensional dark focus. Opt Lett. 2004;29:661–663. doi: 10.1364/ol.29.000661. [DOI] [PubMed] [Google Scholar]
- 24.Nikolenko V, Watson BO, Araya R, Woodruff A, Peterka DS, Yuste R. SLM microscopy: scanless two-photon imaging and photosimulation with spatial light modulators. Front Neu Circuits. 2008;2:1–14. doi: 10.3389/neuro.04.005.2008. [DOI] [PMC free article] [PubMed] [Google Scholar]
- 25.Potma EO, Evans CL, Xie XS. Heterodyne coherent anti-stokes Raman scattering (CARS) imaging. Opt Lett. 2006;31:241–243. doi: 10.1364/ol.31.000241. [DOI] [PubMed] [Google Scholar]
- 26.Potma EO, Krishnamachari VV. Imaging with Phase Sensitive Narrowband Nonlinear Microscopy. In: Yakovlev V, editor. Biochemical Applications of Nonlinear Optical Spectroscopy. CRC; 2009. [Google Scholar]
- 27.Beeker WP, Groβ P, Lee CJ, Cleff C, Offerhaus HL, Fallnich C, Herek JL, Boller KJ. A route to sub-diffraction-limited CARS microscopy. Opt Express. 2009;17:22632–22638. doi: 10.1364/OE.17.022632. [DOI] [PubMed] [Google Scholar]
- 28.Beeker WP, Lee CJ, Boller KJ, Groβ P, Cleff C, Fallnich C, Offerhaus HL, Herek JL. Spatially dependent Rabi oscillations: An approach to sub-diffraction-limited coherent anti-Stokes Raman scattering microscopy. Phys Rev A. 2010;81:012507. [Google Scholar]
- 29.Cox IJ, Sheppard CJR, Wilson T. Reappraisal of arrays of concentric annuli as superresolving filters. J Opt Soc Am A. 1982;72:1287–1291. [Google Scholar]
- 30.Sales TRM, Morris GM. Diffractive superresolution elements. J Opt Soc Am A. 1997;14:1637–1646. [Google Scholar]
- 31.Hegedus ZS, Safaris V. Superresolving filters in confocally scanned imaging systems. J Opt Soc Am A. 1986;3:1892–1896. [Google Scholar]
- 32.Sheppard CJR, Calvert G, Wheatland M. Focal distribution for superresolving toraldo filters. J Opt Soc Am A. 1998;15:849–856. [Google Scholar]
- 33.Jurna M, Korteik JP, Otto C, Herek JL, Offerhaus HL. Vibrational phase contrast microscopy by use of coherent anti-Stokes Raman scattering. Phys Rev Lett. 2009;103:043905. doi: 10.1103/PhysRevLett.103.043905. [DOI] [PubMed] [Google Scholar]
- 34.Nikolaenko A, Krishnamachari VV, Potma EO. Interferometric switching of coherent anti-Stokes Raman scattering signals in microscopy. Phys Rev A. 2009;79:013823. doi: 10.1103/PhysRevA.79.013823. [DOI] [PMC free article] [PubMed] [Google Scholar]
- 35.Kim H, Taggart DK, Xiang C, Penner RM, Potma EO. Spatial control of coherent anti-Stokes emission with height-modulated gold zig-zag nanowires. Nano Lett. 2008;8:2373–2377. doi: 10.1021/nl801207a. [DOI] [PubMed] [Google Scholar]
- 36.Jung Y, Chen H, Tong L, Cheng JX. Imaging gold nanorods by plasmon-resonance-enhanced four-wave mixing. J Phys Chem C. 2009;113:2657–2663. [Google Scholar]