

A recommendation by San Francisco General Hospital in January 2010 to initiate antiretroviral therapy in all human immunodeficiency virus (HIV)–infected patients led to a rapid increase in HIV RNA suppression among patients with a CD4 cell count of >500 cells/μL after clinic enrollment.
Abstract
Background. On 1 January 2010, a large, publicly funded clinic in San Francisco announced a “universal ART” approach to initiate antiretroviral therapy (ART) in all human immunodeficiency virus (HIV)-infected persons. The effect of changing guidance on real-world patient outcomes has not been evaluated.
Methods. We evaluated untreated adult patients (defined as going >90 days without ART use) visiting clinic from 2001 to 2011. The cumulative incidence of HIV RNA suppression (viral load, <500 copies/mL), stratified by CD4 cell count at entry and calendar dates representing guideline issuance, were estimated using a competing risk framework. A multivariate Poisson-based model identified factors associated with HIV RNA suppression 6 months after clinic entry.
Results. Of 2245 adults, 87% were male, and the median age was 39 years (interquartile range, 33–45 years). In 534 patients entering clinic with a CD4 cell count of >500 cells/µL, the 1-year incidence of HIV RNA suppression was 10.1% (95% confidence interval [CI], 6.6%–14.6%) before 4 April 2005; 9.1% (95% CI, 3.6%–17.4%) from 4 April 2005 to 1 December 2007; 14.1% (95% CI, 7.5%–22.8%) from 1 December 2007 to the universal ART recommendation and 52.8% (95% CI, 38.2%–65.4%) after. After adjustment, the SFGH policy was associated with a 6-fold increase in the probability of HIV RNA suppression 6 months after clinic entry.
Conclusions. Recommendations to initiate ART in all HIV-infected patients increased the rate of HIV RNA suppression for patients enrolling in care with a CD4 cell count of >500 cells/µL and may foreshadow national trends given the March 2012 revision of national treatment guidelines to favor ART initiation for persons with CD4 cell counts of >500 cells/µL.
Over the past 10 years, the CD4 cell count threshold for antiretroviral therapy (ART) initiation has risen steadily. This trend stems from a growing consensus that a lower pretherapy CD4 cell count nadir predicts higher risk of end-organ disease (eg, cardiovascular disease, renal dysfunction, liver disease, and perhaps neurocognitive decline) and that viral replication independent of CD4 cell counts may increase morbidity [1–3] and possibly mortality [4, 5]. At the same time, ART has also become less demanding for patients: increasing potency has made treatment more forgiving of suboptimal adherence [6], diminished toxicities have eased the burden of adverse effects [7], and expanded drug selection allows more flexible assembly of regimens to suit individual patient needs. Earlier this decade, from 2000 through 2006, the Department of Health and Human Services (DHHS) expert panel had recommended against ART initiation in patients with a CD4 cell count of >500 cells/µL. In April 2007, the panel revised the recommendation to “optional” in this group [8], and in December 2009 the recommendation was further modified to an “optional/moderate” recommendation. In January 2010, the Division of HIV/AIDS at San Francisco General Hospital (SFGH) adopted a “universal ART” recommendation, based on assessment of individual patient benefits, to initiate ART in all untreated HIV-infected persons irrespective of CD4 cell count. This recommendation was subsequently endorsed by the San Francisco Department of Health in March 2010 [9].
Although guidance has increasingly advocated treatment at higher CD4 cell counts, the extent to which evolving standards have been translated into routine care is not completely understood. A recent study showed that the fraction of patients who suppress HIV RNA has increased over the past decade, but differences by CD4 cell count at clinic entry, which may differ significantly, were not presented [10]. In particular, results for ART uptake in patients with CD4 cell counts of >500 cells/µL is of interest because “test, link, and care plus” (TLC+) initiatives are expected to bring more patients with higher CD4 cell counts into the care system [11]. In addition, changes in HIV RNA suppression rates after clinic entry in relation to dates of benchmark guidelines are also unknown. Assessing the associations between guideline issuance and patient outcomes can shed light on the process of evidence translation and also yield practice-based evidence, both topics of growing attention in the implementation and dissemination sciences. Finally, in March 2012, the DHHS guideline committee formally recommended treatment for all HIV-infected persons with a BIII rating [12]. Analyses from a setting where local treatment guidance anticipated national guidance may therefore foreshadow wider changes in practice and patient outcomes.
In this analysis, we describe changes in the HIV RNA levels among patients at a public health HIV clinic in San Francisco (the Ward 86 clinic at SFGH) over the course of a decade. We focus particular attention on untreated patients who enter care with CD4 cell counts of >500 cells/µL. Temporal thresholds of interest—against which changes in patient HIV RNA levels will be assessed—include publication dates of benchmark clinical practice guidelines from DHHS as well as 1 January 2010 (the date of the SFGH universal ART policy).
METHODS
We evaluated a cohort of HIV-infected adults who made at least one primary care visit at the Ward 86 HIV clinic from 1 January 2001 to 1 November 2011 who were untreated at the time of enrollment (defined as no ART within 90 days of clinic entry). The Ward 86 clinic is attached to SFGH, which is the “safety net” healthcare provider and is funded by taxpayers. The clinic serves mostly patients who are uninsured or insured through public assistance programs. The prevalence of homelessness, substance abuse, and psychiatric comorbidities in the urban population in San Francisco is high [13].
Sociodemographic and clinical data were retrieved from the clinic's electronic medical record system. Laboratory data are electronically fed into the clinical electronic records from the database in the central laboratory. HIV RNA levels were truncated at 500 copies/mL and 500 000 copies/mL because these thresholds represent upper and lower ranges of assays available early in the decade. Four calendar intervals representing potential changes in practice standards were analyzed. The first interval, from 1 January 2001 to 4 April 2005, represented a period when DHHS guidelines recommended against therapy for patients with a CD4 cell count of >500 cells/µL). The second interval, from 5 April 2005 to 1 December 2007, presented the second half of the period in which guidelines did not change and serves as a “control” to evaluate temporal trends not related to changes in guidelines. The third interval, from 2 December 2007 to 1 January 2010, represented the first period in which DHHS guidelines for patients with CD4 cell counts of >500 cells/µL were revised from “D” (“not recommended”) to “C” (“optional”) [8]. The fourth interval, from 2 January 2010 to 30 December 2011, spanned the period after the after the SFGH universal ART policy and administrative database closure. The universal ART recommendation was based on local expert consensus on benefits to individual health only and not with respect of putative prevention of HIV transmission. This recommendation consisted of (1) an announcement and press conference; (2) a community forum event dedicated to this recommendation; (3) discussion at provider meetings at the Ward 86 clinic; (4) a statement on the Division of HIV/AIDS website (http://php.ucsf.edu); and (5) press coverage including by the New York Times. Patient were defined as not being treated with ART at entry if we identified no records of ART in the preceding 90 days before entry in the medical records. Virologic suppression was defined as the first date of an HIV RNA level of <500 copies/mL. Virologic rebound was defined as the first date of HIV RNA level of >1000 copies/mL after first virologic suppression.
In descriptive analyses, we calculated unadjusted within-patient mean HIV RNA levels over time stratified by entry CD4 cell count and calendar year. These estimates provide serial snapshots of the overall burden of HIV RNA levels over time. We also estimated the cumulative incidence of HIV RNA suppression (defined at a cutoff of 500 copies/mL) after the first clinic visit, stratified by CD4 cell count at clinic entry and by calendar time representing the 4 intervals described above. In these estimates, we used a competing risks approach rather than traditional Kaplan-Meier methods to estimate the occurrence of HIV RNA suppression given that some deaths occur in patients who never suppressed HIV RNA. Kaplan-Meier estimates, which treat all observation time among those without the event as censored, are inappropriate because deaths among patients who had unsuppressed HIV RNA at the time of death do not so much preclude observation of the event of interest (HIV RNA suppression) as it renders this event no longer meaningful [14–16]. To identify factors associated with the occurrence of HIV RNA suppression, we used a log-link Poisson model with robust standard errors to estimate a binary outcome of having suppressed 6 months after clinic entry [17]. We analyzed the “risk” or probability of suppression at a given time point instead of using methods based on the rate or hazard of HIV RNA suppression (ie, Cox proportional hazards model) because the time to suppression may be artifactually influenced by when the HIV RNA test was ordered. For example, patients who seem unreliable might tend to have HIV RNA levels ordered earlier than other patients, particularly following ART initiation, therefore apparently decreasing time to first suppression. A model for the probability of the event 6 months after clinic entry avoids this potential bias because almost all patients have had a viral load determination by 6 months. In addition, we used a Poisson-based model instead of logistic regression in order to provide interpretable “risk ratios.” Observation time was administratively censored for unsuppressed patients at the start of the next interval of interest to prevent contamination of effects across calendar thresholds. Among those patients who successfully suppressed HIV RNA, we estimated the occurrence and predictors of virologic rebound using survival analyses, an analysis that is less sensitive to timing of HIV RNA ordering since it occurs over a longer period. All multivariable analysis included all available covariates since the number of outcomes was large, all sociodemographic factors are potential confounders based on a priori knowledge, and none represented plausible “common effects” of calendar interval and the outcome [18]. Ethical approval was granted by the University of California, San Francisco, committee on human research. All analyses were conducted in Stata software (version 11.0).
RESULTS
Between 1 January 2001 and 30 December 2011, 2245 untreated patients entered care at the Ward 86 clinic. The median age at enrollment was 39 years (interquartile range [IQR], 33–45 years); the vast majority of patients were men (1955 patients [87.1%]), most were white (1217 patients [54.2%]), 349 patients (15.6%) identified as Hispanic, and 700 patients (21.1%) had any history of intravenous drug use. The median CD4 cell count was 310 cells/µL (IQR, 150–487 cells/µL), and the median HIV RNA level was 33 230 copies/mL (IQR, 10 246–109 850 copies/mL) (Table 1).
Table 1.
Patient Characteristics at Clinic Enrollment at the Ward 86 Clinic Among Patients Who Made at Least One Visit From 1 January 2001 to 30 December 2011 and Were Untreated at Enrollment (n = 2245)
| Characteristic | Value |
|---|---|
| Median age, years (IQR) | 39 (33–45) |
| Male sex | 1955 (87.1) |
| Race | |
| White | 1217 (54.2) |
| Black | 589 (26.2) |
| Asian | 128 (5.7) |
| Other | 311 (13.9) |
| Hispanic ethnicity | 349 (15.6) |
| History of intravenous drug use | 474 (21.1) |
| Median CD4 cell count at clinicentry, cells/µL (IQR) | 310 (150–487) |
| CD4 cell count at clinic entry, cells/µL | |
| <200 | 732 (33) |
| 201–350 | 536 (24) |
| 351–500 | 443(20) |
| >500 | 534 (24) |
| Median HIV RNA level at clinic entry, copies/mL (IQR) | 33 230 (10 246–109 850) |
| Calendar interval of enrollment in clinic | |
| Interval 1 | 1195 (53.2) |
| Interval 2 | 429 (19.1) |
| Interval 3 | 335 (14.9) |
| Interval 4 | 286 (12.7) |
Data are No. (%) of patients unless otherwise indicated. Interval 1, 1 January 2001 through 4 April 2005; interval 2, 5 April 2005 through 1 December 2007; interval 3, 2 December 2007 through 1 January 2010; interval 4, 2 January 2010 through 30 November 2011.
Abbreviations: HIV, human immunodeficiency virus; IQR, interquartile range.
Over the course of the decade, the fraction of patients with HIV RNA levels undetectable over the entire calendar year (defined as the average of all HIV RNA level determinations in that year for a given patient) increased from 34% to 72%. Overall, this trend was most apparent early in the decade for patients with lower CD4 cell counts at entry, whereas the changes accelerated near the end of the decade for patients who entered care with high CD4 cell counts (Figure 1). Changes in the incidence of virologic suppression after clinic entry were greatest among patients who entered with CD4 cell counts of >500 cells/µL and across after the San Francisco universal ART recommendation in January of 2010 as compared with other groups who entered with lower CD4 cell counts and across other temporal thresholds (Figure 2). For example, for patients who entered clinic with a CD4 cell count of ≤200 cells/µL, the cumulative incidence of HIV RNA suppression by 1 year was 36.0% (95% CI, 31.1%–40.8%) among patients who entered before April 2005, 42.1% (95% CI, 33.2%–50.7%) between April 2005 and January 2007, 61.5% (95% CI, 48.8%–72.0%) between 1 December 2007 and January 2010, and 61.0% (95% CI, 44.2%–74.1%) after 1 January 2010. During the same intervals, the 1 year cumulative incidence of suppression for those who entered with a CD4 cell count of >500 cells/µL was 10.1% (95% CI, 6.6%–14.6%), 9.1% (95% CI, 3.6%–17.4%), 14.1% (95% CI, 7.5%–22.8%), and 52.8% (95% CI, 38.2%–65.4%), respectively.
Figure 1.

Distribution of average within-patient human immunodeficiency virus (HIV) RNA levels in each calendar year for patients who were untreated at clinic enrollment, stratified by CD4 cell count at entry.
Figure 2.

Cumulative incidence of human immunodeficiency virus (HIV) RNA suppression (viral load, <500 copies/mL) after first primary care visit at the San Francisco General Hospital Ward 86 clinic, stratified by calendar interval and CD4 cell count at clinic entry.
A log-link Poisson model with robust standard errors to estimate the adjusted risk ratios of HIV RNA suppression 6 months after clinic enrollment showed a highly significant interaction between calendar interval of clinic entry and CD4 cell count (P < .001 for test of heterogeneity). The largest changes in the risk ratio for suppression of HIV RNA occurred in patients with CD4 cell counts of >500 cells/µL and across the 1 January 2010 threshold. For example, in comparing the period after the universal ART announcement (ie, 1 January 2010) with the period immediately before (ie, 2 December 2007 to 1 January 2010), the adjusted risk ratio HIV RNA suppression at 6 months after clinic entry was 1.19 (95% CI, .72–1.97) for patients with an entry CD4 cell count of ≤200 cells/µL, 1.28 (95% CI, .74–2.22) for those with entry CD4 cell count of 201–350 cells/µL, 2.59 (95% CI, 1.31–5.13) for those with entry CD4 cell count of 351–500 cells/µL, and 6.52 (95% CI, 2.52–16.89) for patients with an entry CD4 cell count of >500 cells/µL (Table 2).
Table 2.
Factors Associated With Probability of HIV RNA Suppression for Untreated Patients 6 Months After Clinic Enrollment
| Factor | Risk Ratio (95% CI) | P |
|---|---|---|
| Age (per 10 years) | 1.11 (.99–1.24) | .074 |
| Male sex | 1.20 (.86–1.68) | .292 |
| Race | ||
| White | Reference | |
| Asian | 0.88 (.67–1.14) | .339 |
| Black | 0.90 (.60–1.35) | .615 |
| Other | 0.83 (.58–1.18) | .293 |
| Hispanic ethnicity | 1.34 (.96–1.87) | .084 |
| History of intravenous drug use | 0.66 (.50–0.87) | .003 |
| HIV RNA level at clinic enrollment,copies/mL (per log10) | 1.07 (.95–1.20) | .254 |
| CD4 cell count at clinic entry of ≤200 cells/µL | ||
| Interval 2 vs interval 1 | 1.13 (.78–1.64) | .517 |
| Interval 3 vs interval 2 | 1.38 (.90–2.11) | .137 |
| Interval 4 vs interval 3 | 1.19 (.72–1.96) | .508 |
| CD4 cell count at clinic entry of 201–350 cells/µL | ||
| Interval 2 vs interval 1 | 1.73 (.99–30.10) | .055 |
| Interval 3 vs interval 2 | 1.42 (.82–2.48) | .209 |
| Interval 4 vs interval 3 | 1.28 (.73–2.22) | .387 |
| CD4 cell count at clinic entry of 351–500 cells/µL | ||
| Interval 2 vs interval 1 | 1.26 (.47–3.37) | .651 |
| Interval 3 vs interval 2 | 2.09 (.83–5.28) | .120 |
| Interval 4 vs interval 3 | 2.59 (1.31–5.13) | .006 |
| CD4 cell count at clinic entry of >500 cells/µL | ||
| Interval 2 vs interval 1 | 0.19 (.02–1.48) | .113 |
| Interval 3 vs interval 2 | 4.71 (.55–40.03) | .156 |
| Interval 4 vs interval 3 | 6.52 (2.52–16.89) | <.001 |
The effect of calendar interval on the risk of human immunodeficiency virus (HIV) RNA suppression is shown across strata of entry CD4 cell count because of a significant interaction. Interval 1, 1 January 2001 through 4 April 2005; interval 2, 5 April 2005 through 1 December 2007; interval 3, 2 December 2007 through 1 January 2010; interval 4, 2 January 2010 through 30 November 2011.
Abbreviations: CI, confidence interval; HIV, human immunodeficiency virus.
An analysis of the incidence of HIV RNA rebound stratified by pre-therapy CD4 cell count nadir found a lower occurrence of HIV RNA rebound among patients who started at a higher CD4 cell count (P < .001; log-rank test) (Figure 3). In a multivariable model of time to virologic rebound among patients who suppressed successfully and after adjustment for age, sex, history of intravenous drug use, and calendar period of clinic entry, higher CD4 cell count at ART initiation remained associated with lower risk of HIV RNA rebound (Table 3).
Figure 3.
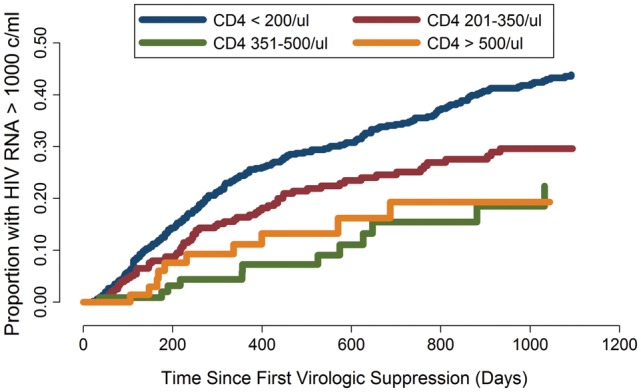
Time from first human immunodeficiency virus (HIV) RNA suppression (viral load, <500 copies/mL) to first virologic rebound (viral load, >1000 copies/mL), stratified by CD4 cell count at antiretroviral therapy initiation.
Table 3.
Factors Associated With Rate of HIV RNA Rebound of >1000 copies/mL From Time of First Suppressed HIV RNA Level
| Factor | Hazard Ratio(95% CI) | P |
|---|---|---|
| Age (per 10 years) | 0.93 (.81–1.07) | .298 |
| Male sex | 0.77 (.58–1.05) | .098 |
| Race | ||
| White | Reference | .073 |
| Asian | 1.26 (.97–1.65) | |
| Black | 0.74 (.44–1.25) | |
| Other | 0.74 (.46–1.21) | |
| Hispanic ethnicity | 1.38 (.89–2.13) | .147 |
| History of intravenous drug use | 1.50 (1.18–1.92) | .001 |
| CD4 cell count at clinic entry, cells/µL | ||
| ≤200 | Reference | .002 |
| 201–350 | 0.70 (.53–0.92) | |
| 351–500 | 0.46 (.27–0.80) | |
| >500 | 0.61 (.34–1.10) | |
| HIV RNA level at clinic entry,log10 copies/mL | 1.03 (.94–1.13) | .514 |
| Date of first primary care visit (per year) | 0.93 (.89–0.96) | <.001 |
Abbreviations: CI, confidence interval; HIV, human immunodeficiency virus.
DISCUSSION
This analysis from a large, public health HIV clinic shows a large and rapid change in HIV RNA outcomes for patients with CD4 cell counts of >500 cells/µL following a new universal ART recommendation to treat all HIV-infected patients irrespective of CD4 cell count. Among those who entered care with a CD4 cell count of >500 cells/µL, the absolute fraction of patients who suppressed HIV RNA in the first year after clinic enrollment rose from approximately 1 in 10 in the decade before to 1 in 2 after the universal ART recommendation. In the era after the January 2010 universal ART recommendation, about one-half of patients quickly suppressed after clinic entry irrespective of CD4 cell count at entry.
The increase in HIV RNA suppression in patients with CD4 cell counts of >500 cells/µL at enrollment argues that initiating ART in patients who are largely asymptomatic, and who may have previously considered themselves ineligible for treatment, is feasible and acceptable in real-world situations to both patients and providers. Concerns about feasibility are normally highlighted in settings where comorbid substance abuse, mental illness, and homelessness are high, and therefore patients differ most markedly from selected populations in many cohort studies and most randomized trials [19]. Our data suggest that most patients, even in real-world settings, are able to accept rapidly changing guidance from providers. These findings also imply that most providers in SFGH quickly adopted a new practice in a setting where adherence is often of concern. Further analysis to identify features of the “early adopters” can inform implementation studies in HIV infection and AIDS care [20, 21].
There are several factors that support a causal interpretation of the association between the universal ART recommendation and increasing HIV RNA suppression rates in patients who enter care with CD4 cell counts of >500 cells/µL. First, the large magnitude of change over a short period (an absolute risk difference of nearly 40% and a risk ratio of 6-fold) suggests a causal relationship because the presence of a confounding factor (whether mismeasured or unmeasured) of that magnitude during a period when the structural aspects of care and the patient population remained largely unchanged is unlikely. Second, the provider and patient community in San Francisco is small, and the promulgation of the recommendation was by local opinion leaders who have routine, one-on-one, face-to-face interactions (a mode of interaction shown to affect provider behavior [22]) with virtually all providers in this clinic. Third, the announcement was directed to the patient community as well as providers through mainstream media, and knowledge about changing practice standards spreads quickly in the community in San Francisco. Anecdotally, new patients enrolling after January 2010 with high CD4 cell counts, in some cases, began initiating conversations with their providers about immediate treatment.
These findings have additional implications given recent 2012 DHHS treatment guidelines that have advocated, for the first time, ART in all patients irrespective of CD4 cell count. First, in concert with TLC+ initiatives, revised national recommendations will likely increase the number of individuals starting ART with CD4 cell count nadirs of >500 cells/µL. This population, whose treatment experience to date is not well understood, should be carefully observed for potential improved health outcomes over time. Second, we note that half of patients with high CD4 cell counts did not achieve rapid suppression after the universal ART recommendation in this study. If the national treatment goals have crystalized around the universal ART benchmark, our findings suggest that a notable gap will remain. Further research on patient, provider, and systems barriers to rapid HIV RNA suppression is needed.
Our findings do not support fears that expanding treatment to largely asymptomatic patients with higher CD4 cell counts will lead to suboptimal adherence. In our analysis, the higher CD4 cell counts at initiation were associated with lower risk of HIV RNA rebound. After adjustment for other risk factors, the highest CD4 cell count stratum at ART initiation was associated with a nearly 40% reduction in the rate of rebound in comparison with those patients who started with a CD4 cell count of <200 cells/µL, an association of greater magnitude than other individual patient characteristics such as race, sex, age, and even intravenous drug use. Although this association is unlikely to be causal, it provides reassurance that in real-world populations, those who uptake ART at higher CD4 cell count thresholds are not less committed to therapy.
Our study has a number of notable limitations. We were not able to assess adherence or specific medication regimens and therefore could not account for changes in these factors over calendar time and their potential influence on HIV RNA suppression. We also did not have rich covariates on psychiatric diagnoses with which to adjust our multivariable analysis, thus making unmeasured confounding possible between calendar interval and virologic suppression, but our clinic has provided safety-net care over the decade and we believe the prevalence of mental illness has not decreased over time. Another limitation is that DHHS guidelines from December 2009 revised their recommendations for treatment in patients with a CD4 cel count of >500 cells/µL from “C” to “B/C,” and we cannot disaggregate those effects from the SFGH universal ART policy, which occurred on 1 January 2010. In addition, we cannot be certain about the “counterfactual” scenario regarding changes in HIV RNA suppression among patients with high CD4 cell counts in which the San Francisco universal ART recommendation never existed. An analysis of virologic outcomes in other urban centers in which local universal ART guidelines were not released over the same calendar periods would be informative. Finally, we acknowledge these data arise from a single center in which providers shared peer networks and opinions. Therefore, the applicability of these findings to other municipalities or health centers is not assured.
In summary, HIV RNA suppression increased in an urban HIV clinic over the past 10 years in patients who entered care at any CD4 cell count stratum, with the biggest change in suppression rates seen in those with an entry CD4 cell count of >500 cells/µL after a universal ART recommendation was announced. These findings indicate that expansion of HIV infection treatment to all persons living with HIV infection and AIDS can be undertaken in real-world patient populations and are encouraging for expanding TLC+ efforts.
Notes
Financial Support. This work was supported by the National Institutes of Health (grants K23 AI084544 and R24 A067039).
Potential conflicts of interest. All authors: No reported conflicts.
All authors have submitted the ICMJE Form for Disclosure of Potential Conflicts of Interest. Conflicts that the editors consider relevant to the content of the manuscript have been disclosed.
References
- 1.Robbins GK, Spritzler JG, Chan ES, et al. Incomplete reconstitution of T cell subsets on combination antiretroviral therapy in the AIDS Clinical Trials Group protocol 384. Clin Infect Dis. 2009;48:350–61. doi: 10.1086/595888. [DOI] [PMC free article] [PubMed] [Google Scholar]
- 2.Mugavero MJ, Napravnik S, Cole SR, et al. Viremia copy-years predicts mortality among treatment-naive HIV-infected patients initiating antiretroviral therapy. Clin Infect Dis. 2011;53:927–35. doi: 10.1093/cid/cir526. [DOI] [PMC free article] [PubMed] [Google Scholar]
- 3.Ho JE, Deeks SG, Hecht FM, et al. Initiation of antiretroviral therapy at higher nadir CD4+ T-cell counts is associated with reduced arterial stiffness in HIV-infected individuals. AIDS. 2011;24:1897–1905. doi: 10.1097/QAD.0b013e32833bee44. [DOI] [PMC free article] [PubMed] [Google Scholar]
- 4.Emery S, Neuhaus JA, Phillips AN, et al. Major clinical outcomes in antiretroviral therapy (ART)-naive participants and in those not receiving ART at baseline in the SMART study. J Infect Dis. 2008;197:1133–44. doi: 10.1086/586713. [DOI] [PubMed] [Google Scholar]
- 5.Kitahata MM, Gange SJ, Abraham AG, et al. Effect of early versus deferred antiretroviral therapy for HIV on survival. N Engl J Med. 2009;360:1815–26. doi: 10.1056/NEJMoa0807252. [DOI] [PMC free article] [PubMed] [Google Scholar]
- 6.Nelson M, Girard PM, Demasi R, et al. Suboptimal adherence to darunavir/ritonavir has minimal effect on efficacy compared with lopinavir/ritonavir in treatment-naive, HIV-infected patients: 96 week ARTEMIS data. J Antimicrob Chemother. 2010;65:1505–9. doi: 10.1093/jac/dkq150. [DOI] [PubMed] [Google Scholar]
- 7.Steigbigel RT, Cooper DA, Kumar PN, et al. Raltegravir with optimized background therapy for resistant HIV-1 infection. N Engl J Med. 2008;359:339–54. doi: 10.1056/NEJMoa0708975. [DOI] [PubMed] [Google Scholar]
- 8.Guidelines for the use of antiretroviral agents in HIV-1-infected adults and adolescents. 2007. Edited by DHHS Panel on Antiretroviral Guidelines for Adults and Adolescents OoARAC. Washington, D.C.: Department of Health and Human Services. [Google Scholar]
- 9.Russell S. City endorses new policy for treatment of H.I.V. New York Times; 3 April 2010. [Google Scholar]
- 10.Moore RD, Bartlett JG. Dramatic decline in the HIV-1 RNA level over calendar time in a large urban HIV practice. Clin Infect Dis. 2011;53:600–4. doi: 10.1093/cid/cir467. [DOI] [PMC free article] [PubMed] [Google Scholar]
- 11.Mayer KH. Linkage, engagement, and retention in HIV care: essential for optimal individual- and community-level outcomes in the era of highly active antiretroviral therapy. Clin Infect Dis. 2011;52(suppl 2):S205–7. doi: 10.1093/cid/ciq043. [DOI] [PubMed] [Google Scholar]
- 12.Panel on Antiretroviral Guidelines for Adults and Adolescents. Guidelines for the use of antiretroviral agents in HIV-1-infected adults and adolescents. Department of Health and Human Services, 2011: 1–166. Available at http://www.aidsinfo.nih.gov/ContentFiles/AdultandAdolescentGL.pdf . Accessed 5 April 2012. [Google Scholar]
- 13.Riley ED, Moore K, Sorensen JL, Tulsky JP, Bangsberg DR, Neilands TB. Basic subsistence needs and overall health among human immunodeficiency virus-infected homeless and unstably housed women. Am J Epidemiol. 2011;174:515–22. doi: 10.1093/aje/kwr209. [DOI] [PMC free article] [PubMed] [Google Scholar]
- 14.Kaplan EL, Meier P. Nonparametric estimation from incomplete observations. J Amer Statist Assn. 1958;53:457–81. [Google Scholar]
- 15.Coviello V, Boggess M. Cumulative incidence estimation in the presence of competing risks. The Stata Journal. 2004;4:103–112. [Google Scholar]
- 16.Satagopan JM, Ben-Porat L, Berwick M, Robson M, Kutler D, Auerbach AD. A note on competing risks in survival data analysis. Br J Cancer. 2004;91:1229–35. doi: 10.1038/sj.bjc.6602102. [DOI] [PMC free article] [PubMed] [Google Scholar]
- 17.Zou G. A modified Poisson regression approach to prospective studies with binary data. Am J Epidemiol. 2004;159:702–6. doi: 10.1093/aje/kwh090. [DOI] [PubMed] [Google Scholar]
- 18.Hernan MA, Hernandez-Diaz S, Robins JM. A structural approach to selection bias. Epidemiology. 2004;15:615–25. doi: 10.1097/01.ede.0000135174.63482.43. [DOI] [PubMed] [Google Scholar]
- 19.Gandhi M, Ameli N, Bacchetti P, et al. Eligibility criteria for HIV clinical trials and generalizability of results: the gap between published reports and study protocols. AIDS. 2005;19:1885–96. doi: 10.1097/01.aids.0000189866.67182.f7. [DOI] [PubMed] [Google Scholar]
- 20.Reif S, Thomas CP, Wallack SS. Factors determining how early adopter physicians use buprenorphine in treatment. J Addict Med. 2007;1:205–12. doi: 10.1097/ADM.0b013e31814c3fa8. [DOI] [PubMed] [Google Scholar]
- 21.Sheikh A, Cornford T, Barber N, et al. Implementation and adoption of nationwide electronic health records in secondary care in England: final qualitative results from prospective national evaluation in “early adopter” hospitals. BMJ. 2011;343:d6054. doi: 10.1136/bmj.d6054. [DOI] [PMC free article] [PubMed] [Google Scholar]
- 22.Lomas J, Enkin M, Anderson GM, Hannah WJ, Vayda E, Singer J. Opinion leaders vs audit and feedback to implement practice guidelines: delivery after previous cesarean section. JAMA. 1991;265:2202–7. [PubMed] [Google Scholar]
- 23.Cheever LW. Engaging HIV-infected patients in care: their lives depend on it. Clin Infect Dis. 2007;44:1500–2. doi: 10.1086/517534. [DOI] [PubMed] [Google Scholar]
- 24.Mugavero MJ, Norton WE, Saag MS. Health care system and policy factors influencing engagement in HIV medical care: piecing together the fragments of a fractured health care delivery system. Clin Infect Dis. 2011;52(suppl 2):S238–46. doi: 10.1093/cid/ciq048. [DOI] [PMC free article] [PubMed] [Google Scholar]