

Abstract
NO and cGMP administered at reperfusion after ischaemia prevent injury to hepatocytes mediated by the MPT (mitochondrial permeability transition). To characterize further the mechanism of protection, the ability of hepatic cytosol in combination with cyclic nucleotides to delay onset of the calcium-induced MPT was evaluated in isolated rat liver mitochondria. Liver cytosol plus cGMP or cAMP dose-dependently inhibited the MPT, required ATP hydrolysis for inhibition and did not inhibit mitochondrial calcium uptake. Specific peptide inhibitors for PKA (protein kinase A), but not PKG (protein kinase G), abolished cytosol-induced inhibition of MPT onset. Activity assays showed a cGMP- and cAMP-stimulated protein kinase activity in liver cytosol that was completely inhibited by PKI, a PKA peptide inhibitor. Size-exclusion chromatography of liver cytosol produced a single peak of cGMP/cAMP-stimulated kinase activity with an estimated protein size of 180–220 kDa. This fraction was PKI-sensitive and delayed onset of the MPT. Incubation of active catalytic PKA subunit directly with mitochondria in the absence of cytosol and cyclic nucleotide also delayed MPT onset, and incubation with purified outer membranes led to phosphorylation of a major 31 kDa band. After ischaemia, administration at reperfusion of membrane-permeant cAMPs and cAMP-mobilizing glucagon prevented reperfusion injury to hepatocytes. In conclusion, PKA in liver cytosol activated by cGMP or cAMP acts directly on mitochondria to delay onset of the MPT and protect hepatocytes from cell death after ischaemia/reperfusion.
Keywords: cAMP, cGMP, glucagon, ischaemia, mitochondrial permeability transition, nitric oxide, protein kinase
INTRODUCTION
I/R (ischaemia/reperfusion) injury is a primary cause of graft dysfunction and failure after liver transplantation [1]. Identification of pathways that ameliorate this injury might lead to improved viability and function after liver transplantation and other types of hepatic surgery. An important mechanism leading to cell death in I/R injury to liver is onset of the MPT [mitochondrial PT (permeability transition)] [2–5]. The MPT is characterized by opening of high-conductance PT pores that allow molecules of up to 1500 Da to diffuse freely through the mitochondrial inner membrane [6]. The net result of PT pore opening is mitochondrial depolarization and uncoupling of oxidative phosphorylation. After uncoupling, impairment of cellular ATP supply is further exacerbated by hydrolysis of ATP by the mitochondrial F1F0-ATPase [7–9]. After PT pore opening, mitochondrial swelling occurs driven by the colloid pressure of proteins in the matrix. This swelling leads to rupture of the mitochondrial outer membrane and release of pro-apoptotic proteins from the intermembrane space, such as cytochrome c, Smac (second mitochondrial-derived activator of caspase)/Diablo [direct IAP (inhibitor of apoptosis)-binding protein with low pI] and others [10–13]. After the MPT, either necrosis or apoptosis ensues depending on cellular ATP. If ATP decreases profoundly, ATP-requiring caspase activation is blocked and necrosis develops. If ATP levels remain above 10–15%, then necrosis is prevented, and caspase-dependent apoptosis occurs instead [14–16].
Previously, we showed that hepatocytes subjected to I/R injury were protected from cell death by either NO (nitric oxide) or cGMP administered at the time of reperfusion [17]. Confocal microscopy demonstrated that NO donors and cell-permeable cGMP analogues prevented onset of the MPT after reperfusion. Moreover, in a cell-free reconstituted system, liver cytosol in the presence of ATP and cGMP suppressed onset of the MPT in isolated rat liver mitochondria [17]. This protection against the MPT was abolished by heat inactivation of cytosol and by the cGMP-dependent protein kinase [PKG (protein kinase G)] inhibitor KT5823. However, KT5823, an ATP analogue, may also inhibit other kinases [18]. Thus the goal of the present study was to characterize further the mechanism of cyclic-nucleotide-dependent inhibition of the MPT in isolated rat liver mitochondria and cultured hepatocytes. In the present study, we show that liver cytosol contains a PKA (protein kinase A) activity activated by both cGMP and cAMP that delays onset of the Ca+2-induced MPT in isolated rat mitochondria. Moreover, since membrane-permeant cAMPs decreased MPT-dependent cell death in hepatocytes subjected to I/R, PKA rather than PKG is likely to be responsible for cytoprotection by NO and cGMP.
MATERIALS AND METHODS
Materials
cAMP-dependent protein kinase catalytic subunit (PKA) was obtained from New England Biolabs, PKI (PKA peptide inhibitor) was from Upstate Biotechnology, [γ-32P] ATP was from PerkinElmer, and DT-3 (PKG inhibitor peptide), cGMP, cAMP and all cyclic nucleotide analogues were from BioLog/Axxora. cGMP-dependent protein kinase (PKG-Iα) and other reagent-grade chemicals were obtained from the Sigma Chemical Company, unless otherwise stated.
Isolation of rat liver mitochondria
Animals were humanely treated using protocols approved by the Institutional Animal Use and Care Committee. Liver mitochondria from overnight-fasted male Sprague–Dawley rats (200–300 g) were isolated as described previously [19]. Briefly, livers were excized and minced in buffer A [250 mM sucrose, 0.5 mM EGTA and 2 mM K+-Hepes buffer (pH 7.4)], followed by homogenization on ice with four strokes of a Teflon Potter–Elvehjem tissue grinder loose-fitting pestle A and one stroke of pestle B at 400 rev./min. Homogenates were diluted to 10% (w/v) with buffer A and centrifuged at 600 g for 15 min at 4°C. The resultant supernatants were centrifuged at 9750 g for 10 min at 4°C, and the pellets were resuspended in buffer A. Centrifugation and resuspension were repeated twice with resuspension in buffer B [250 mM sucrose and 2 mM K+-Hepes (pH 7.4)]. The final pellet was resuspended in buffer B to a protein concentration of 50 mg/ml.
Isolation of mitochondrial outer membranes
Mitochondrial outer membranes were isolated from mitoplasts, as described previously [20]. Briefly, livers (30 g) from 3 to 4 rats were homogenized, as described above, in 70 ml of H-medium [220 mM D-mannitol, 70 mM sucrose, 2 mM K+-Hepes buffer and 0.5 mg/l BSA (pH 7.4)]. The homogenate was further diluted to 10% and centrifuged for 15 min at 660 g. The supernatant was then centrifuged for 15 min at 6780 g, and the resulting pellet resuspended in H-medium and centrifuged for 15 min at 9770 g. This last centrifugation step was repeated, and the pellet was resuspended to exactly 100 mg/ml. Using continuous stirring with a magnetic bar, 3 ml of resuspended mitochondria (300 mg) was mixed with 3 ml of 1.45% digitonin and 0.5 mg/ml BSA in H-medium on ice. After 15 min, the suspension was diluted 4-fold into H-medium and centrifuged for 10 min at 10800 g. The yellow supernatant containing mitochondrial outer membranes was removed and centrifuged for 1 h at 50000 rev./min in a Beckman Ti50 rotor at 4°C. The resultant pellet was resuspended in a few drops of H-medium and contained approx. 3 mg of purified mitochondrial outer membranes. Contamination of isolated outer membranes with inner membrane was assessed by measurements of SDH (succinate dehydrogenase) protein and enzymatic activity. SDH protein and enzyme activity were not detectable (results not shown).
Hepatocyte isolation, culture and incubation
Hepatocytes were isolated and cultured as described previously [17]. I/R in cultured hepatocytes was simulated by anoxia at pH 6.2 in KRH buffer (Krebs–Ringer–Hepes buffer) followed by reoxygenation at pH 7.4, as described previously [5]. Cell death was monitored by propidium iodide fluorimetry, as described previously [21].
Laser-scanning confocal microscopy
Hepatocytes plated on to glass coverslips were co-loaded in KRH buffer with 200 nM TMRM (tetramethylrhodamine methylester; Molecular Probes) and 1 μM calcein/AM for (calcein acetoxymethyl ester) for 15 min at 37°C [14]. To simulate ischaemia, hepatocytes were incubated at pH 6.2 in KRH buffer containing 100 nM TMRM and 3 μM propidium iodide in an anoxic chamber for 4 h. During the last 15 min of anoxic incubation, cells were re-loaded with 0.5 μM calcein/AM to improve cellular calcein loading. Inside the anoxic chamber, hepatocyte-containing coverslips were mounted in a gas-tight POC-R (Perfusion Open Closed-Reduced) chamber (Zeiss). After 4 h, the sealed chamber was mounted on the microscope stage, and reperfusion was initiated by infusion of aerobic KRH buffer at pH 7.4 containing 200 nM TMRM and 3 μM propidium iodide. In some experiments, glucagon (10 nM) was added for the last 20 min of ischaemia and during reoxygenation. The green fluorescence of calcein and red fluorescence of TMRM and propidium iodide were imaged with a Zeiss LSM 510NLO META inverted laser-scanning confocal microscope (Carl Zeiss) using a Zeiss NA (numerical aperture) 1.4 × 63 planapochromat objective lens, as described previously [14].
Preparation of liver cytosolic extract
Rat livers were excised and minced, as described above, and then washed three times in ice-cold PBS [2.67 mM KCl, 1.47 mM KH2PO4, 138 mM NaCl and 8.06 mM Na2HPO4 (pH 7.2)] supplemented with protease inhibitors [2.08 μM 4-(2-aminoethyl)-benzenesulfonyl fluoride, 1.6 μM aprotinin, 80 μM bestatin, 30 μM pepstatin A, 28 μM E-64 and 40 μM leupeptin]. After washing, 3 g of liver was added to 20 ml of PBS with protease inhibitors and homogenized on ice at 400 rev./min with ten strokes of Potter–Elvehjem tissue grinder pestle A followed by three strokes with pestle B. The homogenate was centrifuged for 10 min at 10000 g, and the resultant supernatant was centrifuged again for 1 h at 50000 rev./min in a Beckman Ti50 rotor. The fatty top layer was aspirated, and the remaining supernatant was stored on ice until used or frozen in 20% glycerol at −20°C for use within 48 h. The protein concentration averaged 10–12 mg/ml.
Protein assay
The protein concentration in cytosolic extracts was measured with a Bio-Rad protein assay kit. The protein concentration of purified mitochondria was measured using a biuret method [22].
Mitochondrial respiration
Respiration was measured with a Clark-type oxygen electrode (Hansatech) in respiratory buffer [150 mM sucrose, 7.5 mM KH2PO4, 5 mM MgCl2, 5 mM succinate, 25 mM Hepes buffer and 1 μM rotenone (pH 7.4 at 23°C)] containing 1 mg/ml rat liver mitochondria. Respiration was stimulated with 300 μM ADP. Mitochondria were not used if the ratio of ADP-simulated respiration (State 3) to unstimulated respiration (State 4) was less than 5.
Ca2+-induced mitochondrial swelling
For swelling assays, mitochondria (0.5 mg of protein/ml) were incubated in 96-well (0.3 ml/well) or 24-well (0.5 ml/well) microtitre plates in swelling buffer [200 mM sucrose, 20 μM EGTA, 5 mM succinate, 2 μM rotenone, 1 μg/ml oligomycin, 20 mM Tris, 20 mM Hepes and 1 mM KH2PO4 (pH 7.3 at 23°C)], as described previously [19]. Swelling was assessed by decreased absorbance at 540 nm using a ThermoMax 96-well plate reader (Molecular Devices) or FLUOstar fluorescence plate reader (BMG). In some experiments, 1 μM Fluo5N (Molecular Probes) and 1 μM TMRM were included to assess extra-mitochondrial Ca2+ and mitochondrial polarization respectively, as described previously [19]. Induction of the MPT was initiated with 200–300 μM CaCl2. Swelling traces are representative of three or more experiments.
Measurement of cGMP and cAMP
Hepatocellular cGMP and cAMP were determined using commercial kits (Cayman Chemicals) according to the manufacturer’s instructions. cGMP and cAMP were harvested from PBS-washed cells in 1 ml of ice-cold 70% ethanol. Protein precipitates were removed by centifugation at 14000 g for 5 min at 4°C. Supernatants were dried under vacuum and resuspended in 300 μl of EIA (enzyme immunoassay) buffer from the kit.
Fractionation of liver cytosol and kinase assays
Liver cytosol was prepared, as described above, and separated by FPLC (GE Healthcare) on a calibrated 150 ml Sephacryl S200 size-exclusion column using S200 buffer [50 mM Tris (pH 8.0), 250 mM NaCl, 5 mM DTT (dithiothreitol) and 2.5% (w/v) glycerol]. Fractions were collected and stored at 4°C for kinase activity assays [23]. Briefly, 5 μl of FPLC fractions were assayed for kinase activity in 45 μl of kinase buffer (20 mM Tris, 10 mM DTT, 20 μM MgATP, 5 μM sp-cGMP or sp-cAMP, and 1 μCi of [γ-32P]ATP with a specific activity of 4000 Ci/mM) with 30 μM Kemptide substrate [24]. After 10 min, 20 μl of reaction were spotted on to P81 paper (Whatman), washed three times in 0.75% phosphoric acid and rinsed once in 100% ethanol. After air-drying, samples were counted with a scintillation counter (Beckman Coulter). PKI was used at 4 μM unless otherwise stated. Fractions possessing kinase activity were pooled and concentrated with 50 kDa cut-off Centricon concentrators (Millipore) for use in swelling assays.
Mitochondrial phospholabelling and electrophoresis
Mitochondria (150 μg) in 100 μl of swelling buffer were incubated at 23°C with catalytic PKA subunit (50 units/μl), 20 μM MgATP and 1 μCi of [γ-32P]ATP with a specific activity of 4000 Ci/mM. One unit of PKA was defined as that phosphorylating 1 pmol of Kemptide substrate in 1 min at 30°C. After 10 min, the mitochondrial suspension was centrifuged at 9000 g for 1 min at 4°C. The pellet was resuspended in 90 μl of Laemmli buffer, and 30 μl was subjected to PAGE on a 4–12% gel (Invitrogen). For phosphorylation of mitochondrial outer membranes, 20 μg of purified mitochondrial outer membranes was incubated for 10 min at 23°C with 100 units/μl catalytic PKA subunit, 20 μM MgATP and 1 μCi of [γ-32P]ATP. The reaction was stopped by the addition of 2 × Laemmli buffer. Half of the stopped reaction (25 μl) containing 10 μg of outer mitochondrial membrane protein was subjected to PAGE. The resultant gels were fixed for 1 h in fix/destain solution (10% methanol and 7% glacial acetic acid) and stained overnight in stain solution [0.08% Coomassie Blue G-250 (Bio-Rad), 8% ammonium sulfate, 1% phosphoric acid and 20% methanol]. The gels were destained in destain solution until bands were not visible, transferred to storage solution (1% acetic acid) for 30 min, and exposed overnight to X-OMAT AR film (Kodak).
Protein digestion and MS
The exposed film was overlaid on the stained gel and Coomassie-Blue-visible bands were excised, minced into <1 mm pieces and placed in siliconized microfuge tubes. Gel fragments were immersed and shaken in destain solution (12 mM ammonium bicarbonate and 40% acetonitrile) for 15 min at room temperature (23°C). If the gel pieces still had Coomassie Blue stain after removing the destain solution, the destain procedure was repeated. Upon removal of destain solution, the tubes were put into a speed-vac and dried down. The dried gels were rehydrated in 25 mM ammonium bicarbonate (pH 8.0) and incubated overnight at 37°C with 0.2 μg of tosyl phenylalanyl chloromethyl ketone-modified sequencing grade trypsin (Promega). After centrifugation at 14000 g for 5 min, supernatants were transferred to new siliconized centrifuge tubes, and the trypsinized gels were washed and shaken for 15 min in 50 μl of 60% acetonitrile/5% formic acid solution. After centrifugation for 5 min at 14000 g, the second supernatants were combined with the first supernatants, dried in a speed-vac, resuspended in 0.1% trifluoroacetic acid and purified with C18 ZipTips (Millipore) according to the manufacturer’s instructions. Using 10 μl of elution buffer (0.1% trifluoroacetic acid, 70% acetonitrile and 1% α-cyano-4-hydroxycinnamic acid), peptides were eluted directly on to a MALDI (matrix-assisted laser-desorption ionization) plate and allowed to dry. The peptides were then analysed with an Applied Biosystems 4700 tandem mass spectrometer (Life Technologies).
Statistics
Differences between groups were analysed using a Student’s t test. A P value of less than 0.05 was considered significant. Data shown are means ± S.E.M.
RESULTS
Inhibition of Ca2+-induced mitochondrial swelling by liver cytosol
In previous work, we showed that liver cytosol delays onset of the MPT in a cGMP-dependent manner [17]. To characterize further the requirements of liver cytosol to delay onset of the Ca2+-induced MPT, we examined the dose-dependence of liver cytosol in delaying onset of the MPT. When mitochondria were incubated in the presence of ATP (20 μM) and 8-pCPT-cGMP (100 μM), no swelling occurred over 30 min (Figure 1, trace a). By contrast, swelling occurred promptly after addition of 250 μM Ca2+, as shown by a large decrease in absorbance (Figure 1, trace b). Relative to the Ca2+-only control, 25 μg/ml liver cytosol (Figure 1, trace c) delayed swelling by approx. 12 min, and 50 μg/ml liver cytosol delayed swelling by approx. 22 min (Figure 1, trace d). Addition of 100 μg/ml liver cytosol delayed swelling only slightly longer than 50 μg/ml cytosol (Figure 1, trace e). Swelling in this assay represents onset of the MPT. To ensure that cGMP had no effect on the Ca2+-induced MPT, mitochondria in the absence of cytosol were treated with membrane-permeant cGMP (0–300 μM). The cGMP treatment of mitochondria had no effect on the MPT following 250 μM Ca2+ (results not shown). Thus liver cytosol delayed the Ca2+-induced MPT in a dose-dependent fashion in the presence of ATP and 8-pCPT-cGMP. Additionally, cAMP could replace cGMP as the cyclic nucleotide required for cytosol-dependent inhibition of the MPT (results not shown).
Figure 1. Inhibition of the MPT by liver cytosol.
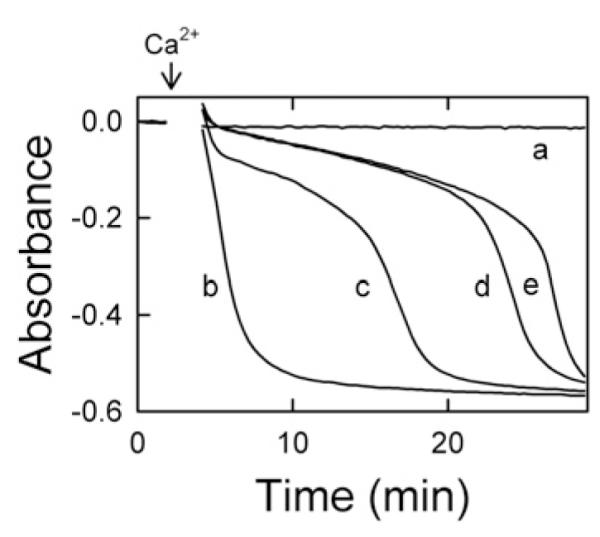
Mitochondria were incubated in swelling buffer in the presence of ATP (20 μM), 8-pCPT-cGMP (100 μM) and 0 (traces a and b), 25 μg/ml (trace c), 50 μg/ml (trace d) or 100 μg/ml (trace e) liver cytosol, as described in the Materials and methods section. In traces (b–e), 250 μM Ca2+ was added where indicated by the arrow. The absorbance at 540 nm was measured. Data are representative of at least three separate experiments.
Requirement of ATP for cytosolic-induced delay of MPT onset
Mitochondria were incubated with 0–20 μM ATP in the presence of a constant amount of cytosol (25 μg/ml) and 8-pCPT-cGMP (100 μM). In the absence of ATP, Ca2+ induced prompt mitochondrial swelling (Figure 2A, trace a). The addition of 10 and 20 μM ATP together with cytosol and 8-pCPT-cGMP delayed onset of the Ca2+-induced MPT in a dose-dependent fashion (Figure 2A, traces c and e). To determine whether delayed MPT onset was a direct effect of ATP, 20 μM ATP (with 8-pCPT-cGMP) was added in the absence of cytosol, but Ca2+-induced swelling was not delayed (Figure 2A, trace d) and was identical with Ca2+-induced swelling in the absence of ATP with and without cytosol plus 8-pCPT-cGMP (Figure 2A, traces a and b). Since higher concentrations of ATP (>50 μM) partially delayed the MPT in the absence of cytosol and 8-pCPT-cGMP (results not shown), such higher concentrations were not used in the present work. Since ADP formed by ATP hydrolysis might act to inhibit MPT onset, the mitochondrial F1F0-ATPase inhibitor oligomycin was routinely included in the swelling buffer. Moreover, ADP (30 and 60 μM) in the presence of diadenosine pentaphosphate (10 μM) to inhibit adenylate kinase did not block the Ca2+-induced MPT (results not shown).
Figure 2. Inhibition of the MPT requires hydrolysable ATP.

Mitochondria were incubated in swelling buffer plus 8-pCPT-cGMP (100 μM), as described for Figure 1, and the absorbance was measured after the addition of 250 μM Ca2+ (indicated by arrows). In (A), additions to the incubation medium were: none (trace a), cytosol (60 μg/ml) (trace b), 10 μM ATP and cytosol (60 μg/ml) (trace c), 20 μM ATP (trace d) and 20 μM ATP and cytosol (60 μg/ml) (trace e). In (B), additions were: none (trace a), ATP (25 μM) (trace b), liver cytosol (60 μg/ml) (trace c), ATP (25 μM) and cytosol (60 μg/ml) (trace d), cytosol (60 μg/ml) and p[NH]ppA (25 μM) (trace e), and cytosol (60 μg/ml) and p[NH]ppA (500 μM) (trace f).
To examine the importance of ATP hydrolysis for inhibition of the MPT, ATP was compared with p[NH]ppA (adenosine 5′- [β,γ-imido]triphosphate), a non-hydrolysable ATP analogue. In the presence of 8-pCPT-cGMP, but the absence of cytosol, Ca2+ addition induced rapid swelling (Figure 2B, trace a). Similarly, rapid Ca2+-induced swelling occurred in the presence of 25 μM ATP and 8-pCPT-cGMP, but no cytosol (Figure 2B, trace b) and of 60 μg/ml cytosol plus 8-pCPT-cGMP without ATP (Figure 2B, trace c). As in Figure 2(A), the combination of cytosol, ATP and 8-pCPT-cGMP delayed onset of the Ca2+-induced MPT (Figure 2B, trace d). However, when 25 μM p[NH]ppA or 500 μM p[NH]ppA replaced ATP in the presence of cytosol plus 8-pCPT-cGMP, the Ca2+-induced MPT was not prevented (Figure 2B, traces e and f).
Effects of cytosol on Ca2+ uptake and mitochondrial membrane polarization
To measure Ca2+ uptake, mitochondria were incubated with the membrane-impermeant Ca2+-indicating green-fluorescing fluorophore Fluo-5N (1 μM), whose fluorescence increases with increasing extra-mitochondrial free Ca2+ concentration. To monitor mitochondrial membrane polarization, the membrane-potential-indicating red-fluorescing fluorophore TMRM (1 μM) was also added to the medium, whose fluorescence decreases (quenches) with increasing membrane potential. Using a fluorescence plate reader, green and red fluorescence was monitored together with absorbance to assess mitochondrial swelling (Figure 3).
Figure 3. Lack of inhibition of mitochondrial Ca2+ uptake by liver cytosol.

Mitochondria were incubated in the presence of Fluo5N (1 μM) and TMRM (1 μM) in swelling buffer, as described in the Materials and methods section, before addition of 250 μM Ca2+ (indicated arrows). Green fluorescence of Fluo5N (A), red fluorescence of TMRM (B) and absorbance at 540 nm (C) were then measured.
Mitochondria incubated with ATP, but without cytosol or 8-pCPT-cGMP (Figure 3A, trace a) or with cytosol without ATP or 8-pCPT-cGMP (Figure 3A, trace b) rapidly accumulated exogenous Ca2+ during the first minute, which occurred even before the first measurements could be made. Subsequently, mitochondria rapidly released the accumulated Ca2+ as the MPT occurred, which also mostly occurred before the first measurement could be made. By contrast, when cytosol was combined with ATP and 8-pCPT-cGMP, Fluo5N fluorescence initially remained low because onset of the MPT was delayed, and Ca2+ was taken up and retained in mitochondria (Figure 3A, trace c). Subsequently after many minutes, Fluo5N fluorescence began to increase, which signified Ca2+ release from mitochondria at onset of the MPT. In the presence of cyclosporin A, a PT pore inhibitor, mitochondria did not release Ca2+ over the course of the incubation, and Fluo5N fluorescence remained low (Figure 3A, trace d).
Polarized mitochondria take up TMRM electrophoretically. As TMRM becomes concentrated inside mitochondria, quenching of TMRM fluorescence occurs. Upon depolarization, mitochondria release TMRM and unquenching of TMRM fluorescence occurs [19]. In parallel to Ca2+ release measured by Fluo5N fluorescence (Figure 3A), Ca2+ addition produced depolarization of mitochondria in the presence of ATP without cytosol or 8-pCPT-cGMP (Figure 3B, trace a) or with cytosol without ATP or 8-pCPT-cGMP (Figure 3B, trace b), as shown by an increase in TMRM fluorescence. By contrast, mitochondria incubated with the combination of ATP, 8-pCPT-cGMP and cytosol remained polarized much longer after Ca2+ addition (Figure 3B, trace c). After a delay of many minutes, mitochondria then began to depolarize in parallel with Ca2+ release. Cyclosporin A completely prevented this increase in TMRM fluorescence (Figure 3B, trace d). Swelling monitored by absorbance closely paralleled mitochondrial Ca2+ release and depolarization, confirming that cyclosporin A sensitive Ca2+ release and depolarization were consequences of the MPT (Figure 3C). Taken together, these results show that cytosol plus ATP and 8-pCPT-cGMP do not prevent mitochondrial Ca2+ uptake as the mechanism of inhibition of the MPT.
Involvement of PKA in the cytosol-induced delay of MPT onset
In previous work, the PKG inhibitor KT-5823 abrogated inhibition of the MPT by cytosol, ATP and 8-pCPT-cGMP [17]. However, KT-5823 may inhibit other protein kinases, particularly PKA [18]. To address whether cytosol-dependent MPT inhibition was mediated by PKA or PKG, peptide inhibitors for PKA (PKI) [25] and PKG (DT-3) [26] were tested for their ability to abolish cytosol-dependent inhibition of the Ca2-induced MPT. When mitochondria were incubated in 8-pCPT-cGMP (100 μM) and ATP (25 μM) in the absence of Ca2+, no MPT occurred unless Ca2+ was added (Figure 4A, traces a and b). When mitochondria were incubated with cytosol (60 μg/ml), 8-pCPT-cGMP (100 μM) and ATP (25 μM), onset of the Ca2+-induced MPT was delayed (Figure 4A, trace c). PKI (10 μM), the PKA inhibitor, completely abolished the cytosol-dependent delay in MPT onset (Figure 4A, trace d). By contrast, DT-3 (1 μM), a PKG peptide inhibitor, had no effect (Figure 4A, trace e). Both inhibitors were used at concentrations at least 10-fold higher than their reported IC50 concentration to ensure kinase inhibition would occur.
Figure 4. cGMP-stimulated PKA-like activities in cytosol and fractionated cytosol.
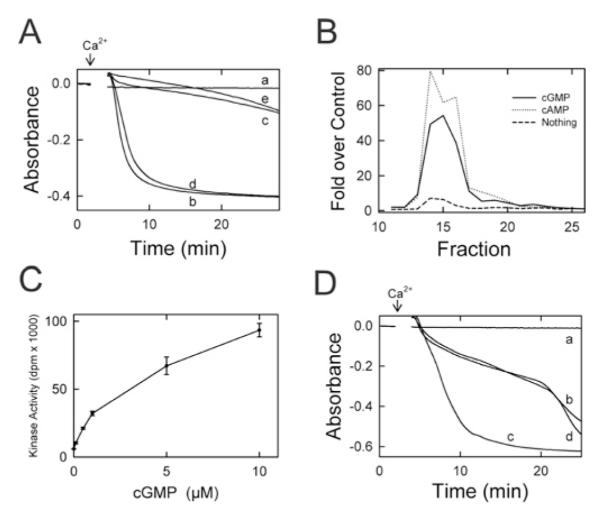
(A) Isolated mitochondria were incubated in swelling buffer with 8-pCPT-cGMP (100 μM) and ATP (25 μM), and the absorbance was measured, as described in Figure 1. Other additions to the incubation buffer were: none (traces a and b), cytosol (60 μg/ml) (trace c), cytosol plus PKI (10 μM) (trace d), and cytosol plus DT-3 (1 μM) (trace e). In traces (b–e), 250 μM Ca2+ was added where indicated by the arrow. (B) Liver cytosol was loaded on to an S200 column and fractionated by FPLC, as described in the Materials and methods section. Shown are kinase activities from 10 μl of each fraction measured in the presence of 5 μM sp-cAMP (dotted line), 5 μM sp-cGMP (solid line) or no activator (dashed line). (C) Phosphorylation of Kemptide substrate (30 μM) was measured in the presence of 6.4 μg of the pooled fractions 14–17 in the presence of 0–10 μM cGMP and 500 μM IBMX (isobutylmethylxanthine), as described in the Materials and methods section. (D) Mitochondria were incubated with 100 μM 8-pCPT-cGMP and 30 μM MgATP, as described in (A), and the absorbance was measured. Additions to the incubation buffer were none (trace a), concentrated fractions 14–17 (20 μg/ml) (trace b), concentrated fractions plus 4 μM PKI (trace c) and concentrated fraction plus 1 μM DT-3 (trace d). In traces (b–d), 250 μM Ca2+ was added where indicated by the arrow.
Delay of the MPT by cGMP- and cAMP-stimulated kinase activity in liver cytosol
To characterize cyclic-nucleotide-stimulated kinase activity in liver cytosol, fractionation of liver cytosol was performed with a calibrated size-exclusion S200 FPLC column. Kinase assays were performed on the fractions in the absence (control) and presence of the PDE (phosphodiesterase)-resistant cyclic nucleotides sp-cGMP and sp-cAMP. Cyclic-nucleotide-stimulated kinase activity was greatest in fractions 14–17, corresponding to a molecular mass range of 180–220 kDa (Figure 4B). In pooled fractions 14–17, cGMP/cAMP-stimulated kinase activity was abolished by the PKA inhibitor PKI (4 μM) (Table 1). By contrast, the PKG peptide inhibitor DT-3 (1 μM) did not inhibit kinase activity (Table 1). Nonetheless, cGMP stimulated the kinase activity of pooled fractions 14–17 with half-maximal stimulation at 3–4 μM (Figure 4C).
Table 1. Cyclic-nucleotide-stimulated kinase activity and inhibitor sensitivity of pooled FPLC fractions 14–17.
Liver cytosol was fractionated by FPLC, as described in the Materials and Methods section. As indicated, kinase activity of pooled fractions 14–17 was measured in the presence of 5 μM sp-cAMP or 5 μM sp-cGMP with and without 4 μM PKI and 1 μM DT-3. Activity (± S.E.M.) is expressed as the multiple of activity in the presence of added nucleotide only.
| Nucleotide | No inhibitor | PKI | DT-3 |
|---|---|---|---|
| sp-cAMP | 28.1± 1.45 | 1.6± 0.21* | 28.9± 1.33 |
| sp-cGMP | 16.8± 0.91 | 0.98± 0.07* | 17.1± 0.70 |
P < 0.001.
Pooled fractions 14–17 were assayed for the ability to delay onset of the calcium-induced MPT. The pooled fractions were first concentrated 40-fold by 50 kDa centrifugal filtration, as described in the Materials and methods section. In the presence of 8-pCPT-cGMP and ATP, no swelling of mitochondria was observed during the course of the experiment (Figure 4D, trace a), unless Ca2+ was added in which case swelling was rapid (results not shown). The concentrated pooled fractions delayed Ca2+-induced swelling in the presence of 8-pCPT-cGMP and ATP (Figure 4D, trace b), and PKI (4 μM), a peptide inhibitor of PKA, abolished this delay (Figure 4D, trace c). The peptide inhibitor of PKG, DT-3 (1 μM), had no effect on the observed delay (Figure 4D, trace d).
Inhibition of the MPT by purified PKA
To test directly whether PKA inhibits Ca2+-induced swelling of isolated mitochondria, rat liver mitochondria were treated with increasing amounts of a constitutively active catalytic subunit of PKA. In the absence of PKA, mitochondria did not swell (Figure 5A, trace a) unless Ca2+ was added (Figure 5A, trace b). Ca2+-induced swelling occurred identically in mitochondria exposed to ATP alone (Figure 5A, trace c) and to PKA alone (Figure 5A, trace d). By contrast, treatment with the catalytic subunit of PKA in the presence of ATP inhibited Ca2+-induced swelling in a dose-dependent fashion (Figure 5A, traces e and f).
Figure 5. Direct effect of the catalytic subunit of PKA on the MPT and phosphorylation of mitochondrial proteins.

(A) Mitochondrial swelling was measured by absorbance during incubation in swelling buffer, as described in the Materials and methods section. Additions were none (trace a), 250 μM Ca2+ (arrow) plus 25 μM ATP (trace b), 250 μM Ca2+ plus 17 units/μl PKA (trace d), 250 μM Ca2+, 25 μM ATP and 8 units/μl PKA (trace e), and 250 μM Ca2+, 25 μM ATP and 17 units/μl PKA (trace f).(B) Mitochondrialswelling was measured with additions of none (trace a),250 μMCa2+ (arrow) plus 25 μM ATP (trace b), and 250 μM Ca2+, 25 μM ATP and 20 units/μl PKG (trace c). (C) Autoradiograms of phosphorylated proteins after incubation of 30 μM [γ-32P]-labelled ATP were prepared with intact mitochondria (lane 1), mitochondria plus 17 units/μl catalytic PKA (lane 2) and PKA alone (lane 3), as described in the Materials and methods section. (D) Autoradiograms were prepared after incubation of mitochondrial outer membranes with [γ-32P]-labelled ATP plus no further addition (lane 1), 17 units/μl catalytic PKA (lane 2) and PKA and 4 μM PKI (lane 3). In (C and D), the molecular mass in kDa is indicated on the right-hand side.
Since PKA and PKG phosphorylate similar sites [27], we evaluated the effect of purified PKG Iα on mitochondrial swelling. Mitochondrial swelling did not occur with cGMP and ATP alone (Figure 5B, trace a), but occurred rapidly after Ca2+ addition (Figure 5B, trace b). By contrast, PKG Iα in the presence of cGMP and ATP inhibited swelling after Ca2+ (Figure 5B, trace c).
Phosphorylation of proteins of intact mitochondria and purified mitochondrial outer membranes by the constitutively active catalytic subunit of PKA
To determine phosphorylation of mitochondrial proteins, mitochondria were incubated with [γ-32P]ATP. When whole mitochondria were incubated with [γ-32P]ATP without PKA, only two phosphorylated bands were visible with estimated molecular masses of 40 kDa and 31 kDa (Figure 5C, lane 1). By contrast, when mitochondria were incubated with [γ-32P]ATP plus PKA, the regions around the 40 kDa and 31 kDa bands intensified, and additional strong bands of estimated molecular masses of 47 kDa and 18 kDa became visible, plus weaker bands of estimated molecular masses of 170 kDa and 100 kDa (Figure 5C, lane 2). When the PKA inhibitor PKI was present with PKA, only the two phosphorylated bands (40 kDa and 31 kDa) observed in the absence of PKA were present (results not shown). When catalytic PKA was incubated with [γ-32P]ATP in the absence of mitochondria, only a 40 kDa band was visible (Figure 5C, lane 3). This band is likely to be the PKA catalytic subunit, since PKA is a 41 kDa protein that autophosphorylates [28].
Unlike whole mitochondria where 40 kDa and 31 kDa phosphorylated bands were visible in the absence of PKA (Figure 5C, lane 1), no phosphorylated bands were visible when mitochondrial outer membranes were incubated with [γ-32P]ATP without PKA (Figure 5D, lane 1). When purified outer membranes were incubated with [γ-32P]ATP and PKA, strong phosphorylated bands became present at 40 kDa and 31 kDa with weaker bands at 100 kDa, 49 kDa, 17 kDa and 15 kDa (Figure 5D, lane 2). Furthermore, when mitochondrial outer membranes were incubated with [γ-32P]ATP and PKA in the presence of PKI, all bands disappeared, with the exception of a faint 40 kDa band of autophosphorylated PKA (Figure 5D, lane 3).
The 40 kDa phosphorylated bands in both whole-mitochondrial and outer membrane extracts presumably included autophosphorylated PKA. Attempts to sequence the 31 kDa band from whole mitochondria (Figure 5C, lane 2) were unsuccessful because of the large number of inner membrane and matrix proteins present in the extracts. However, the phosphorylated 31 kDa band from outer membranes (Figure 5D, lane 2) was identified by MALDI–TOF (MALDI–time-of-flight) MS fingerprinting to include VDAC1 (voltage-dependent anion channel 1; SwissProt accession number Q9Z2L0) with a Protein Prospector MOWSE score of 1.31×10¹¹. The recovered peptides represented 77% (217 out of 282 amino acids) of full-length VDAC1. Efforts to identify the weak 100 kDa, 49 kDa, 17 kDa and 15 kDa phosphorylated bands from outer membranes were unsuccessful.
Membrane-permeant cAMP protects hepatocytes from I/R-induced cell death
Since catalytic PKA delayed onset of the MPT in isolated mitochondria, we assessed whether PKA activation by membrane-permeant cAMP analogues protects hepatocytes against MPT-dependent I/R injury. I/R was simulated by anoxia at pH 6.2 for 4 h followed by reoxygenation at pH 7.4, as described previously [17]. After reperfusion at pH 7.4, cell death detected by propidium iodide fluorimetry increased progressively to approx. 60% after 2 h (Figure 6A, open circles). pH values less than 7 inhibits the MPT, and reperfusion at pH 6.2 prevented most cell death, as observed previously (Figure 6A, filled circles) [17]. The membrane-permeant PKA activator 8-pCPT-cAMP added just prior to reperfusion at pH 7.4 also decreased cell death in a dose-dependent fashion. After 2 h of reperfusion, cell death decreased from 61% without 8-pCPT-cAMP to 55%, 35% and 22% respectively, with 10, 100 and 200 μM 8-pCPT-cAMP (Figure 6A). Since 8-pCPT-cAMP can also activate PKG [29], we assessed sp-cAMP, a more selective PKA activator, for protection against I/R injury. After 2 h of reperfusion, cell death decreased from 63% without sp-cAMP to 58%, 53% and 43% respectively, with 10, 100 and 200 μM sp-cAMP (Figure 6B).
Figure 6. Protection by cAMP analogues against cell death after simulated I/R injury.

Hepatocytes were incubated in anaerobic KRH buffer at pH 6.2 for 4 h to simulate ischaemia. (A) Hepatocytes were reoxygenated with aerobic KRH at pH 6.2 (●) or at pH 7.4 in the presence of 0 (○), 10 μM (▴), 100 μM (∎) and 200 μM (▾) 8-pCPT-cAMP, as described in the Materials and methods section. Results are means ± S.E.M. (B) Hepatocytes were reoxygenated with aerobic KRH at pH 6.2 (●) and at pH 7.4 in the presence of 0 (○), 10 μM (▴), 100 μM (∎), and 200 μM (▾) sp-cAMP. Values are from four or more hepatocyte isolations for each group.
Glucagon prevents the MPT and cell death after I/R to hepatocytes
In hepatocytes, glucagon activates adenylate cyclase and increases intracellular cAMP [30]. Accordingly, we evaluated the effect of this physiological cAMP-mobilizing agonist on MPT onset and cell death after simulated I/R. To assess the effect of glucagon on MPT onset, the cytosol of hepatocytes was loaded with calcein, a 623 Da solute that does not ordinarily permeate through the mitochondrial inner membrane [31]. TMRM was also present to monitor mitochondrial polarization. Confocal microscopy of green-fluorescing calcein at the end of ischaemia just prior to reperfusion revealed numerous dark voids in the cytoplasm representing individual mitochondria excluding the fluorophore, whereas mitochondrial TMRM fluorescence was dim, indicating depolarization during ischaemia (Figure 7A). After reperfusion, the voids of calcein fluorescence began to fill within 15 min and disappeared entirely after approx. 30 min. Additionally, mitochondria did not accumulate TMRM, indicating an absence of mitochondrial repolarization. Mitochondrial inner membrane permeabilization and sustained depolarization after reperfusion signified onset of the MPT. Subsequently after inner membrane permeabilization occurred, cell viability was lost in both cells in the field within 45 min, as indicated by loss of virtually all green cytosolic calcein fluorescence and nuclear labelling with propidium iodide (Figure 7A, far-right-hand panels). By contrast, when hepatocytes were treated with glucagon, mitochondrial dark voids did not fill with green calcein fluorescence after reperfusion (Figure 7B). Instead, mitochondria repolarized in a sustained fashion as shown by uptake of red-fluorescing TMRM, and calcein fluorescence was retained in the cytoplasm out to 2 h (Figure 7B, far-right-hand panels). Thus glucagon prevented MPT onset and cell death after I/R.
Figure 7. Mitochondrial inner membrane permeabilization and depolarization after I/R of hepatocytes: protection by glucagon.

Overnight cultured rat hepatocytes were subjected to 4 h of anoxia at pH 6.2 to simulate ischaemia followed by reoxygenation at pH 7.4 to simulate reperfusion, as described in the Materials and methods section. Hepatocytes were ester-loaded with green-fluorescing calcein into the cytosol to monitor inner membrane permeability and reperfused with red-fluorescing TMRM and propidium iodide to monitor mitochondrial polarization and loss of cell viability respectively. In (B), glucagon (10 nM) was added 15 min prior to and then continuously after reperfusion. In (A), note that mitochondrial voids in the green calcein fluorescence filled after reperfusion, which was followed by loss of nearly all cytoplasmic calcein fluorescence and nuclear labelling with propidium iodide after 40–45 min (arrows). Mitochondria did not take up TMRM. In panels marked ‘3x’, red fluorescence intensity was upwardly rescaled by a factor of 3 to illustrate better nuclear labelling with propidium iodide and the absence of mitochondrial TMRM uptake. In (B) in the presence glucagon, mitochondrial voids of calcein fluorescence were not lost, and mitochondria rapidly accumulated TMRM. Nuclear labelling with propidium iodide and loss of cytoplasmic calcein fluorescence did not occur even after 120 min of reperfusion. Each experiment is representative of three or more replicates. PI, propridium iodide.
cGMP and cAMP levels after I/R
Previously, we showed that NO donors protect against I/R injury in hepatocytes [17]. To determine changes in cGMP and cAMP after reperfusion with an NO donor, cyclic nucleotides were measured during the first hour of reperfusion in the presence of the NO donor DETA NONOate. In the first 5 min of reperfusion, cGMP increased 400% compared with normoxic incubation, and remained elevated through the first hour of reperfusion (Figure 8A). By contrast, cAMP decreased more than 80% in the first 5 min of reperfusion compared with normoxia (Figure 8B). Subsequently, cAMP recovered partially, but after 60 min of reperfusion cAMP was still only 30% of levels in untreated normoxic hepatocytes. Thus cGMP rather than cAMP is most likely to be stimulating protein kinase after reperfusion in the presence of NO donors.
Figure 8. cAMP and cGMP levels in NO-treated hepatocytes following simulated I/R injury.

Hepatocytes were incubated in anaerobic KRH buffer at pH 6.2 for 4 h to simulate ischaemia. At reperfusion the hepatocytes were treated with DETA NONOate, and cAMP (A) and cGMP (B) were measured, as described in the Materials and Methods. Values represent the average of three separate cultures of 1×10⁶ hepatocytes.
DISCUSSION
In previous work, NO protected hepatocytes from MPT-dependent I/R injury, which led us to hypothesize that a cGMP-activated protein kinase exists in the cytosol which delays onset of the MPT and protects hepatocytes from cell death [17]. In the present study, we provide evidence that this cGMP-activated protein kinase is PKA, and that PKA in hepatic cytosol acts directly on mitochondria to inhibit MPT onset and protect hepatocytes from cell death after I/R injury.
In our earlier study, ODQ, a soluble guanylate cyclase inhibitor, abrogated NO protection against cell death [17]. This finding implies that NO-stimulated formation of cGMP is in the cytoprotective pathway. In support, Br-cGMP, a cGMP analogue, protected hepatocytes from cell death after I/R. Moreover, NO increased cGMP in hepatocytes during reperfusion. In cultured hepatocytes, confocal microscopy showed that both NO and Br-cGMP inhibited the MPT after reperfusion, and in isolated rat liver mitochondria liver cytosol inhibited onset of the MPT in a cGMP- and ATP-dependent manner, an effect abrogated by the PKG inhibitor KT5823. Although these findings pointed to PKG as mediating cytoprotection by NO and cGMP, other evidence indicates that hepatocytes do not express any known form of PKG [32]. Accordingly, the goal of the present study was to better characterize the cyclic-nucleotide-stimulated kinase activity in liver cytosol that is responsible for inhibiting the MPT. Our evidence is consistent with the conclusion that the cytoprotective kinase is PKA, rather than PKG.
Enzymatic and pharmacological experiments indicated the presence of a highly active cyclic-nucleotide-dependent protein kinase activity in liver cytosol that inhibited Ca2+-induced onset of the MPT. Cytosolic extract was prepared by high-speed centrifugation of a homogenate of 3 g of liver in 20 ml of buffer. Assuming an approx. 80% intracellular volume fraction for liver and a 60% volume fraction for cytosol within the intracellular space [33], then our liver cytosolic extract represented a 16-fold dilution of the cytosol. In the presence of cyclic nucleotide and ATP, cytosolic extract inhibited onset of the MPT with a maximum effect at approx. 100 μg/ml, corresponding to a 400-fold dilution of cytosol (Figure 1). This titration signifies high kinase activity in the cytosol and implies specific phosphorylation target sites on mitochondria that inhibit MPT onset.
Inhibition of the MPT determined with a swelling assay was confirmed by showing that mitochondrial depolarization and release of calcium associated with the MPT were also blocked by cytosolic extract plus ATP and cyclic nucleotide (Figure 2). One possible mechanism for inhibition of the Ca2+-induced MPT is blockade of electrogenic mitochondrial Ca2+ accumulation, as reported for the cytoprotectant and MPT inhibitor minocycline [4]. However, using Fluo-5N as a probe for extra-mitochondrial Ca2+, we found that cytosolic extract did not prevent mitochondrial Ca2+ uptake, the necessary first step in the Ca2+-induced onset of the MPT (Figure 2).
The ATP requirement for cytosol to inhibit the MPT may indicate that ATP is needed as a regulatory molecule rather than as a phosphate donor. However, p[NH]ppA, a non-hydrolysable analogue of ATP, could not replace ATP in promoting cytosol- and cyclic-nucleotide-dependent MPT inhibition, which is consistent with a phosphate donor role for ATP in the inhibition (Figure 3).
In ATP dose–response experiments, the observed half-maximal ATP concentration to inhibit the MPT in the presence of cytosolic extract and cyclic nucleotide was between 10 and 20 μM. The Km for ATP by PKA and PKG is 3.1 μM and 7.1 μM respectively [34], which are both close to values observed in the MPT assay. A probable reason that more ATP was needed to inhibit the MPT is that both mitochondria and cytosol possess ATPases that decrease the effective concentration of ATP.
Previously, the PKG inhibitor KT-5823 was shown to abrogate cyclic-nucleotide- and cytosol-dependent protection against the MPT [17]. A possible role for PKG in blocking the MPT is also supported in the present work by the observation that purified recombinant PKG Iα delayed onset of the Ca2+-induced MPT (Figure 5). Nonetheless, previous reports question the specificity and use of KT-5823 for PKG [35–37]. Furthermore, Northern blots and PCR of liver mRNA fail to reveal expression of any known form of PKG (PKG-Iα/β or PKG-II) [32,38]. Additionally, in the present work, the highly specific PKG-I peptide inhibitor (DT-3; Ki = 25 nM) [26] did not block cytosol-dependent inhibition of the MPT (Figure 4). Thus PKG is most probably not the kinase in liver cytosol that delays onset of the MPT.
Since KT-5823, a staurosporine analogue, inhibits a number of protein kinases, including PKA [18,36,39,40], we examined the effects of highly specific peptide inhibitors of PKA and PKG to address further the possible involvement of PKG and PKA in cytosol-dependent inhibition of the MPT. PKI, a peptide inhibitor of PKA [41], prevented protection against the MPT by cytosol, cyclic nucleotide and ATP, whereas DT-3, a PKG-I inhibitory peptide [26], did not (Figure 4). PKI and DT-3 were chosen because they are widely recognized to be potent and extremely specific inhibitors of their respective kinases with no cross inhibition. These findings indicated that PKA, and not PKG, is the probable effector kinase responsible for the cytosol-induced delay of the MPT.
To characterize protein kinase activity in liver cytosolic extracts further, gel filtration was performed on a calibrated S200 column. Using Kemptide as a substrate, enriched cGMP/cAMP-stimulated protein kinase activity was identified in fractions eluting at apparent molecular masses between 170 and 200 kDa. Kinase activity was stimulated by both cGMP and cAMP analogues, but was inhibited by PKI, the PKA inhibitor, and not by DT-3, the PKG inhibitor (Table 1). This finding is consistent with previous reports that both cAMP and cGMP are capable of activating PKA [42]. The apparent molecular mass of 170–200 kDa for this PKA activity is also consistent with the expected size of the inactive PKA tetramer, composed of two catalytic (41 kDa) and two regulatory (45 kDa) subunits with a total molecular mass of 172 kDa [43].
Fractions eluting between 170 and 200 kDa were pooled, concentrated and assessed in the MPT swelling assay. The pooled fractions in the presence of cGMP delayed onset of the MPT (Figure 4D, trace b), an effect abrogated by PKI (Figure 4D, trace c). Taken together, these experiments support the conclusion that PKA activity in liver cytosol underlies cyclic-nucleotide-dependent inhibition of the MPT. The molecular mass of this activity also would appear to rule out contributions to MPT inhibition by MAPKs (mitogen-activated protein kinases) and JNKs (c-Jun N-terminal kinases), whose molecular masses are less than 50 kDa [44,45].
To address whether additional cytosolic proteins are required for PKA-dependent inhibition of the Ca2+-induced MPT, we evaluated the effects of the recombinant purified constitutively active catalytic subunit of PKA (Figure 5A). Similar to cytosolic extract, the catalytic subunit of PKA delayed onset of the calcium-induced MPT in a dose-dependent fashion (Figure 5A, traces e and f). ATP was required for this PKA catalytic subunit-dependent inhibition (Figure 5A, trace c). This evidence indicates that PKA acts directly on mitochondria rather than by a cascade of reactions involving other cytosolic proteins.
Although PT pore components remain in dispute, proposed models often include VDAC as one of the components [46]. However, previous work shows that the Ca2+-induced MPT still occurs in VDAC-deficient mitochondria [47]. Although VDAC may not be an integral part of PT pores, VDAC may still regulate MPT onset. In support of this hypothesis, we found that VDAC1 was present in the major phosphorylated 31 kDa band separated by PAGE from purified outer membranes after exposure to PKA, as determined by MALDI–TOF MS fingerprint analysis. Previous work has also shown that purified VDAC1 is a substrate for PKA in vitro [48], that PKA phosphorylation of VDAC blocks or inhibits association of VDAC with other proteins, such as Bax and tBid, and that PKA-dependent VDAC phosphorylation decreases VDAC conductance [48]. Since association of Bax and tBid with mitochondria promotes cell death signalling, decreased Bax and tBid association with mitochondria may represent another mechanism by which PKA activation is protective during reperfusion. Nonetheless, a protein of similar molecular mass other than VDAC may be the real target of PKA. For example, a 32 kDa protein in VDAC-deficient mitochondria appears to be the target of MPT inhibition by Ro 68–3400 [47].
NO administered during reperfusion of ischaemic hepatocytes increases cGMP, an effect blocked by ODQ, a guanylate cyclase inhibitor [17]. However, PKA activation might also occur due to increased cAMP after reperfusion with NO donors. To address which cyclic nucleotide, cGMP or cAMP, activates PKA after NO treatment during reperfusion, cAMP and cGMP were measured during the first hour of reperfusion in NO-treated hepatocytes (Figure 7A). Whereas cGMP increased more than 4-fold compared with normoxic controls, cAMP decreased 4-fold. These results suggest that decreased cAMP with a consequent decrease in PKA activity may be a factor promoting MPT onset during reperfusion, which NO-dependent cGMP formation acts to counteract. In support of this concept, the membrane-permeant cAMP agonists 8-pCPT-cAMP and sp-cAMP deceased cell death after reperfusion dose-dependently (Figure 6). Similarly, the cAMP-mobilizing hormone glucagon also protected against cell death after I/R, and protection was associated with prevention of the MPT in the reperfused hepatocytes (Figure 7). These data are consistent with the conclusion that PKA activation by cAMP and its analogues protect hepatocytes from I/R injury.
Other reports show cGMP activation of PKA both in vivo [49,50] and in vitro [51]. Elevated cGMP may activate PKA due to the degeneracy of the PKA–cyclic nucleotide-binding sites [43]. In the present study, cGMP increased kinase activity of pooled FPLC fractions of cytosol with half-maximal stimulation at approx. 3 μM (Figure 4C). This activation by cGMP is similar to that previously described for cGMP-activation of type II PKA [51], which is expressed in the liver [52].
Other protein kinases that may regulate onset of the MPT after I/R include PKCε (protein kinase Cε), GSK-3β (glycogen synthase kinase-3β) and JNK. PKCε is a cytosolic serine/threonine kinase that translocates to mitochondria to delay onset of the MPT, whereas GSK-3β and JNK, particularly the JNK-2 isoform, promote the MPT [53–55]. However, these protein kinases are insensitive to PKI and KT5823 and have molecular masses well below the 170–200 kDa range of the protein kinase identified in liver cytosolic extract that causes cyclic-nucleotide-dependent inhibition of MPT onset. Thus the kinase in liver cytosol that modulates onset of the MPT in the presence of cGMP and cAMP is unlikely to be PKCε, GSK-3β or JNK-2.
In conclusion, PKA activation by cGMP and cAMP at reperfusion protects ischaemic hepatocytes from MPT-dependent cell death after reperfusion. Protection by PKA seems to be a direct effect on mitochondria that does not require other proteins, and is not related to inhibition of mitochondrial Ca2+ uptake. Specific PKA peptide inhibitors, such as PKI, but not PKG peptide inhibitors, block protection. The molecular targets of phosphorylation by PKA that confer cytoprotection remain to be determined. Future progress in identifying critical PKA phosphorylation sites for cytoprotection may lead to a better understanding of the exact molecular composition of PT pores.
Acknowledgments
FUNDING
This work was supported, in part, by the National Institutes of Health [grant numbers DK073336, DK34987, DK071477, DK37034, DK070844].
Abbreviations used
- calcein/AM
calcein acetoxymethyl ester
- DTT
dithiothreitol
- GSK-3β
glycogen synthase kinase-3β
- I/R
ischaemia/reperfusion
- JNK
c-Jun N-terminal kinase
- KRH
Krebs–Ringer–Hepes
- MALDI
matrix-assisted laser-desorption ionization
- MALDI–TOF
MALDI–time-of-flight
- MPT
mitochondrial permeability transition
- NO
nitric oxide
- PKA
protein kinase A
- PKCε
protein kinase Cε
- PKG
protein kinase G
- PKI
PKA peptide inhibitor
- p[NH]ppA
adenosine 5′-[β,γ-imido]triphosphate
- PT
permeability transition
- SDH
succinate dehydrogenase
- TMRM
tetramethylrhodamine methylester
- VDAC
voltage-dependent anion channel
Footnotes
AUTHOR CONTRIBUTION Peter Pediaditakis initiated the design of the study, performed the mitochondrial swelling assays, kinase assays and chromatographic separations, and drafted the manuscript. Jae-Sung Kim assisted in the design, performance and analysis of I/R experiments with cultured hepatocytes. Lihua He assisted in the calcium uptake experiments. Xun Zhang performed the confocal microscopy experiments. Lee Graves assisted in the design and interpretation of the kinase assays and MS. John Lemasters had the responsibility for overall planning and conduct of the work, and final editing of the manuscript. All authors read and approved the final manuscript.
REFERENCES
- 1.Jaeschke H. Molecular mechanisms of hepatic ischemia-reperfusion injury and preconditioning. Am. J. Physiol Gastrointest. Liver Physiol. 2003;284:G15–G26. doi: 10.1152/ajpgi.00342.2002. [DOI] [PubMed] [Google Scholar]
- 2.Kim JS, He L, Qian T, Lemasters JJ. Role of the mitochondrial permeability transition in apoptotic and necrotic death after ischemia/reperfusion injury to hepatocytes. Curr. Mol. Med. 2003;3:527–535. doi: 10.2174/1566524033479564. [DOI] [PubMed] [Google Scholar]
- 3.Suleiman MS, Halestrap AP, Griffiths EJ. Mitochondria: a target for myocardial protection. Pharmacol. Ther. 2001;89:29–46. doi: 10.1016/s0163-7258(00)00102-9. [DOI] [PubMed] [Google Scholar]
- 4.Theruvath TP, Zhong Z, Pediaditakis P, Ramshesh VK, Currin RT, Tikunov A, Holmuhamedov E, Lemasters JJ. Minocycline and N-methyl-4-isoleucine cyclosporin (NIM811) mitigate storage/reperfusion injury after rat liver transplantation through suppression of the mitochondrial permeability transition. Hepatology. 2009;47:236–246. doi: 10.1002/hep.21912. [DOI] [PMC free article] [PubMed] [Google Scholar]
- 5.Qian T, Nieminen AL, Herman B, Lemasters JJ. Mitochondrial permeability transition in pH-dependent reperfusion injury to rat hepatocytes. Am. J. Physiol. 1997;273:C1783–C1792. doi: 10.1152/ajpcell.1997.273.6.C1783. [DOI] [PubMed] [Google Scholar]
- 6.Halestrap AP, McStay GP, Clarke SJ. The permeability transition pore complex: another view. Biochimie. 2002;84:153–166. doi: 10.1016/s0300-9084(02)01375-5. [DOI] [PubMed] [Google Scholar]
- 7.Imberti R, Nieminen AL, Herman B, Lemasters JJ. Mitochondrial and glycolytic dysfunction in lethal injury to hepatocytes by t-butylhydroperoxide: protection by fructose, cyclosporin A and trifluoperazine. J. Pharmacol. Exp. Ther. 1993;265:392–400. [PubMed] [Google Scholar]
- 8.Nieminen AL, Saylor AK, Herman B, Lemasters JJ. ATP depletion rather than mitochondrial depolarization mediates hepatocyte killing after metabolic inhibition. Am. J. Physiol. 1994;267:C67–C74. doi: 10.1152/ajpcell.1994.267.1.C67. [DOI] [PubMed] [Google Scholar]
- 9.Halestrap AP, Doran E, Gillespie JP, O’Toole A. Mitochondria and cell death. Biochem. Soc. Trans. 2000;28:170–177. doi: 10.1042/bst0280170. [DOI] [PubMed] [Google Scholar]
- 10.Zamzami N, Susin SA, Marchetti P, Hirsch T, Gomez-Monterrey I, Castedo M, Kroemer G. Mitochondrial control of nuclear apoptosis. J. Exp. Med. 1996;183:1533–1544. doi: 10.1084/jem.183.4.1533. [DOI] [PMC free article] [PubMed] [Google Scholar]
- 11.Morin D, Pires F, Plin C, Tillement JP. Role of the permeability transition pore in cytochrome C release from mitochondria during ischemia-reperfusion in rat liver. Biochem. Pharmacol. 2004;68:2065–2073. doi: 10.1016/j.bcp.2004.07.006. [DOI] [PubMed] [Google Scholar]
- 12.Bradham CA, Qian T, Streetz K, Trautwein C, Brenner DA, Lemasters JJ. The mitochondrial permeability transition is required for tumor necrosis factor α-mediated apoptosis and cytochrome c release. Mol. Cell. Biol. 1998;18:6353–6364. doi: 10.1128/mcb.18.11.6353. [DOI] [PMC free article] [PubMed] [Google Scholar]
- 13.Gustafsson AB, Gottlieb RA. Heart mitochondria: gates of life and death. Cardiovasc. Res. 2008;77:334–343. doi: 10.1093/cvr/cvm005. [DOI] [PubMed] [Google Scholar]
- 14.Kim JS, Qian T, Lemasters JJ. Mitochondrial permeability transition in the switch from necrotic to apoptotic cell death in ischemic rat hepatocytes. Gastroenterology. 2003;124:494–503. doi: 10.1053/gast.2003.50059. [DOI] [PubMed] [Google Scholar]
- 15.Lemasters JJ. Dying a thousand deaths: redundant pathways from different organelles to apoptosis and necrosis. Gastroenterology. 2005;129:351–360. doi: 10.1053/j.gastro.2005.06.006. [DOI] [PubMed] [Google Scholar]
- 16.Qian T, Herman B, Lemasters JJ. The mitochondrial permeability transition mediates both necrotic and apoptotic death of hepatocytes exposed to Br-A23187. Toxicol. Appl. Pharmacol. 1999;154:117–125. doi: 10.1006/taap.1998.8580. [DOI] [PubMed] [Google Scholar]
- 17.Kim JS, Ohshima S, Pediaditakis P, Lemasters JJ. Nitric oxide protects rat hepatocytes against reperfusion injury mediated by the mitochondrial permeability transition. Hepatology. 2004;39:1533–1543. doi: 10.1002/hep.20197. [DOI] [PubMed] [Google Scholar]
- 18.Davies SP, Reddy H, Caivano M, Cohen P. Specificity and mechanism of action of some commonly used protein kinase inhibitors. Biochem. J. 2000;351:95–105. doi: 10.1042/0264-6021:3510095. [DOI] [PMC free article] [PubMed] [Google Scholar]
- 19.Blattner JR, He L, Lemasters JJ. Screening assays for the mitochondrial permeability transition using a fluorescence multiwell plate reader. Anal. Biochem. 2001;295:220–226. doi: 10.1006/abio.2001.5219. [DOI] [PubMed] [Google Scholar]
- 20.Schnaitman C, Greenawalt JW. Enzymatic properties of the inner and outer membranes of rat liver mitochondria. J. Cell Biol. 1968;38:158–175. doi: 10.1083/jcb.38.1.158. [DOI] [PMC free article] [PubMed] [Google Scholar]
- 21.Nieminen AL, Gores GJ, Bond JM, Imberti R, Herman B, Lemasters JJ. A novel cytotoxicity screening assay using a multiwell fluorescence scanner. Toxicol. Appl. Pharmacol. 1992;115:147–155. doi: 10.1016/0041-008x(92)90317-l. [DOI] [PubMed] [Google Scholar]
- 22.Gornall AG, Bardawill DJ, David MM. Determination of serum proteins by means of the biuret reaction. J. Biol. Chem. 1949;177:751–66. [PubMed] [Google Scholar]
- 23.Graves LM, Bornfeldt KE, Raines EW, Potts BC, Macdonald SG, Ross R, Krebs EG. Protein kinase A antagonizes platelet-derived growth factor-induced signaling by mitogen-activated protein kinase in human arterial smooth muscle cells. Proc. Natl. Acad. Sci. U.S.A. 1993;90:10300–10304. doi: 10.1073/pnas.90.21.10300. [DOI] [PMC free article] [PubMed] [Google Scholar]
- 24.Kemp BE, Graves DJ, Benjamini E, Krebs EG. Role of multiple basic residues in determining the substrate specificity of cyclic AMP-dependent protein kinase. J. Biol. Chem. 1977;252:4888–4894. [PubMed] [Google Scholar]
- 25.Dalton GD, Dewey WL. Protein kinase inhibitor peptide (PKI): a family of endogenous neuropeptides that modulate neuronal cAMP-dependent protein kinase function. Neuropeptides. 2006;40:23–34. doi: 10.1016/j.npep.2005.10.002. [DOI] [PubMed] [Google Scholar]
- 26.Dostmann WR, Taylor MS, Nickl CK, Brayden JE, Frank R, Tegge WJ. Highly specific, membrane-permeant peptide blockers of cGMP-dependent protein kinase Iα inhibit NO-induced cerebral dilation. Proc. Natl. Acad. Sci. U.S.A. 2000;97:14772–14777. doi: 10.1073/pnas.97.26.14772. [DOI] [PMC free article] [PubMed] [Google Scholar]
- 27.Pearson RB, Kemp BE. Protein kinase phosphorylation site sequences and consensus specificity motifs: tabulations. Methods Enzymol. 1991;200:62–81. doi: 10.1016/0076-6879(91)00127-i. [DOI] [PubMed] [Google Scholar]
- 28.Cauthron RD, Carter KB, Liauw S, Steinberg RA. Physiological phosphorylation of protein kinase A at Thr-197 is by a protein kinase A kinase. Mol. Cell. Biol. 1998;18:1416–1423. doi: 10.1128/mcb.18.3.1416. [DOI] [PMC free article] [PubMed] [Google Scholar]
- 29.Sandberg M, Butt E, Nolte C, Fischer L, Halbrugge M, Beltman J, Jahnsen T, Genieser HG, Jastorff B, Walter U. Characterization of Sp-5,6-dichloro-1-β-D-ribofuranosylbenzimidazole- 3′ ,5′-monophosphorothioate (Sp-5,6-DCl-cBiMPS) as a potent and specific activator of cyclic-AMP-dependent protein kinase in cell extracts and intact cells. Biochem. J. 1991;279:521–527. doi: 10.1042/bj2790521. [DOI] [PMC free article] [PubMed] [Google Scholar]
- 30.Geelen MJ, Vaartjes WJ. Levels of cyclic 3′-5′-adenosine monophosphate (cAMP) in maintenance cultures of rat hepatocytes in response to insulin and glucagon. Lipids. 1977;12:577–580. doi: 10.1007/BF02533384. [DOI] [PubMed] [Google Scholar]
- 31.Nieminen AL, Saylor AK, Tesfai SA, Herman B, Lemasters JJ. Contribution of the mitochondrial permeability transition to lethal injury after exposure of hepatocytes to t-butylhydroperoxide. Biochem. J. 1995;307:99–106. doi: 10.1042/bj3070099. [DOI] [PMC free article] [PubMed] [Google Scholar]
- 32.Kulhanek-Heinze S, Gerbes AL, Gerwig T, Vollmar AM, Kiemer AK. Protein kinase A dependent signalling mediates anti-apoptotic effects of the atrial natriuretic peptide in ischemic livers. J. Hepatol. 2004;41:414–420. doi: 10.1016/j.jhep.2004.05.017. [DOI] [PubMed] [Google Scholar]
- 33.Loud AV. A quantitative stereological description of the ultrastructure of normal rat liver parenchymal cells. J. Cell Biol. 1968;37:27–46. doi: 10.1083/jcb.37.1.27. [DOI] [PMC free article] [PubMed] [Google Scholar]
- 34.Flockhart DA, Freist W, Hoppe J, Lincoln TM, Corbin JD. ATP analog specificity of cAMP-dependent protein kinase, cGMP-dependent protein kinase, and phosphorylase kinase. Eur. J. Biochem. 1984;140:289–295. doi: 10.1111/j.1432-1033.1984.tb08100.x. [DOI] [PubMed] [Google Scholar]
- 35.Walter U, Gambaryan S. Roles of cGMP/cGMP-dependent protein kinase in platelet activation. Blood. 2004;104:2609. doi: 10.1182/blood-2004-06-2389. [DOI] [PubMed] [Google Scholar]
- 36.Bain J, McLauchlan H, Elliott M, Cohen P. The specificities of protein kinase inhibitors: an update. Biochem. J. 2003;371:199–204. doi: 10.1042/BJ20021535. [DOI] [PMC free article] [PubMed] [Google Scholar]
- 37.Gambaryan S, Geiger J, Schwarz UR, Butt E, Begonja A, Obergfell A, Walter U. Potent inhibition of human platelets by cGMP analogs independent of cGMP-dependent protein kinase. Blood. 2004;103:2593–2600. doi: 10.1182/blood-2003-09-3349. [DOI] [PubMed] [Google Scholar]
- 38.Tamura N, Itoh H, Ogawa Y, Nakagawa O, Harada M, Chun TH, Suga S, Yoshimasa T, Nakao K. cDNA cloning and gene expression of human type Iα cGMP-dependent protein kinase. Hypertension. 1996;27:552–557. doi: 10.1161/01.hyp.27.3.552. [DOI] [PubMed] [Google Scholar]
- 39.Burkhardt M, Glazova M, Gambaryan S, Vollkommer T, Butt E, Bader B, Heermeier K, Lincoln TM, Walter U, Palmetshofer A. KT5823 inhibits cGMP-dependent protein kinase activity in vitro but not in intact human platelets and rat mesangial cells. J. Biol. Chem. 2000;275:33536–33541. doi: 10.1074/jbc.M005670200. [DOI] [PubMed] [Google Scholar]
- 40.Hidaka H, Kobayashi R. Pharmacology of protein kinase inhibitors. Annu. Rev. Pharmacol. Toxicol. 1992;32:377–397. doi: 10.1146/annurev.pa.32.040192.002113. [DOI] [PubMed] [Google Scholar]
- 41.Glass DB, Cheng HC, Mende-Mueller L, Reed J, Walsh DA. Primary structural determinants essential for potent inhibition of cAMP-dependent protein kinase by inhibitory peptides corresponding to the active portion of the heat-stable inhibitor protein. J. Biol. Chem. 1989;264:8802–8810. [PubMed] [Google Scholar]
- 42.Lincoln TM, Komalavilas P, Boerth NJ, MacMillan-Crow LA, Cornwell TL. cGMP signaling through cAMP- and cGMP-dependent protein kinases. Adv. Pharmacol. 1995;34:305–322. doi: 10.1016/s1054-3589(08)61094-7. [DOI] [PubMed] [Google Scholar]
- 43.Francis SH, Corbin JD. Structure and function of cyclic nucleotide-dependent protein kinases. Annu. Rev. Physiol. 1994;56:237–272. doi: 10.1146/annurev.ph.56.030194.001321. [DOI] [PubMed] [Google Scholar]
- 44.Davis RJ. Signal transduction by the JNK group of MAP kinases. Cell. 2000;103:239–252. doi: 10.1016/s0092-8674(00)00116-1. [DOI] [PubMed] [Google Scholar]
- 45.Seger R, Krebs EG. The MAPK signaling cascade. FASEB J. 1995;9:726–735. [PubMed] [Google Scholar]
- 46.Halestrap AP, Brenner C. The adenine nucleotide translocase: a central component of the mitochondrial permeability transition pore and key player in cell death. Curr. Med. Chem. 2003;10:1507–1525. doi: 10.2174/0929867033457278. [DOI] [PubMed] [Google Scholar]
- 47.Krauskopf A, Eriksson O, Craigen WJ, Forte MA, Bernardi P. Properties of the permeability transition in VDAC1−/− mitochondria. Biochim. Biophys. Acta. 2006;1757:590–595. doi: 10.1016/j.bbabio.2006.02.007. [DOI] [PubMed] [Google Scholar]
- 48.Bera AK, Ghosh S, Das S. Mitochondrial VDAC can be phosphorylated by cyclic AMP-dependent protein kinase. Biochem. Biophys. Res. Commun. 1995;209:3–7. doi: 10.1006/bbrc.1995.1491. [DOI] [PubMed] [Google Scholar]
- 49.Forte LR, Thorne PK, Eber SL, Krause WJ, Freeman RH, Francis SH, Corbin JD. Stimulation of intestinal Cl- transport by heat-stable enterotoxin: activation of cAMP-dependent protein kinase by cGMP. Am. J. Physiol. 1992;263:C607–C615. doi: 10.1152/ajpcell.1992.263.3.C607. [DOI] [PubMed] [Google Scholar]
- 50.Kurjak M, Fritsch R, Saur D, Schusdziarra V, Allescher HD. NO releases bombesin-like immunoreactivity from enteric synaptosomes by cross-activation of protein kinase A. Am. J. Physiol. 1999;276:G1521–G1530. doi: 10.1152/ajpgi.1999.276.6.G1521. [DOI] [PubMed] [Google Scholar]
- 51.Leboulle G, Muller U. Synergistic activation of insect cAMP-dependent protein kinase A (type II) by cyclicAMP and cyclicGMP. FEBS Lett. 2004;576:216–220. doi: 10.1016/j.febslet.2004.08.079. [DOI] [PubMed] [Google Scholar]
- 52.Skarpen E, Thoresen GH, Tasken K, Samuelsen JT, Jahnsen T, Schwarze PE, Huitfeldt HS. Localization of cAMP-dependent signal transducers in early rat liver carcinogenesis. Histochem. Cell Biol. 1998;109:203–209. doi: 10.1007/s004180050219. [DOI] [PubMed] [Google Scholar]
- 53.Kaplowitz N, Shinohara M, Liu ZX, Han D. How to protect against acetaminophen: don’t ask for JUNK. Gastroenterology. 2008;135:1047–1051. doi: 10.1053/j.gastro.2008.08.031. [DOI] [PubMed] [Google Scholar]
- 54.Theruvath TP, Snoddy MC, Zhong Z, Lemasters JJ. Mitochondrial permeability transition in liver ischemia and reperfusion: role of c-Jun N-terminal kinase 2. Transplantation. 2008;85:1500–1504. doi: 10.1097/TP.0b013e31816fefb5. [DOI] [PMC free article] [PubMed] [Google Scholar]
- 55.Yeste-Velasco M, Folch J, Jimenez A, Rimbau V, Pallas M, Camins A. GSK-3β inhibition and prevention of mitochondrial apoptosis inducing factor release are not involved in the antioxidant properties of SB-415286. Eur. J. Pharmacol. 2008;588:239–243. doi: 10.1016/j.ejphar.2008.04.019. [DOI] [PubMed] [Google Scholar]