

Abstract
G-quadruplexes, DNA tertiary structures highly localized to functionally important sites within the human genome, have emerged as important new drug targets. The putative G-quadruplex-forming sequence (Pu27) in the NHE-III1 promoter region of the c-Myc gene is of particular interest as stabilization of this G-quadruplex with TMPyP4 has been shown to repress c-Myc transcription. In this study, we examine the Pu27 G-quadruplex-forming sequence and its interaction with TMPyP4. We report that the Pu27 sequence exists as a heterogeneous mixture of monomeric and higher-order G-quadruplex species in vitro and that this mixture can be partially resolved by size exclusion chromatography (SEC) separation. Within this ensemble of configurations, the equilibrium can be altered by modifying the buffer composition, annealing procedure, and dialysis protocol thereby affecting the distribution of G-quadruplex species formed. TMPyP4 was found to bind preferentially to higher-order G-quadruplex species suggesting the possibility of stabilization of the junctions of the c-Myc G-quadruplex multimers by porphyrin end-stacking. We also examined four modified c-Myc sequences that have been previously reported and found a narrower distribution of quadruplex configurations compared to the parent Pu27 sequence. We could not definitively conclude whether these G-quadruplex structures were selected from the original ensemble or if they are new G-quadruplex structures. Since these sequences differ considerably from the wild-type promoter sequence, it is unclear whether their structures have any actual biological relevance. Additional studies are needed to examine how the polymorphic nature of G-quadruplexes affects the interpretation of in vitro data for c-Myc and other G-quadruplexes. The findings reported here demonstrate that experimental conditions contribute significantly to G-quadruplex formation and should be carefully considered, controlled, and reported in detail.
INTRODUCTION
A G-quadruplex is a DNA tertiary structure formed by the unimolecular folding of a guanine-rich sequence bearing four or more runs containing at least two guanine bases1. Bi- or tetramolecular quadruplexes can form from strands containing fewer runs of guanine. A G-quadruplex is typically composed of two or three stacked G-tetrads. Each tetrad is composed of four guanines in a square planar arrangement stabilized by Hoogsteen hydrogen bonds. A cation, usually sodium or potassium, is associated with 1 or 2 stacked G-quartets by coordination with the O6 of the guanine molecules, stabilizing the tetrad arrangement and promoting G-quadruplex formation1, 2
Among the first G-quadruplexes studied were those formed from the human telomere sequence3. Generally recognized as repeats of d(GGGTTA), telomeres are DNA sequences that cap the ends of chromosomes and are thought to contribute to genetic stability by preventing the ends of the chromosome from being eroded away during replication. The human telomere is 5-8 thousand base pairs in length with a single stranded 3′ overhang of 100 to 200 bases4. The formation of G-quadruplexes in these 3′ overhangs has been shown to decrease the activity of telomerase, an enzyme which is responsible for maintaining the length of telomeric DNA. Since telomerase activation has been found to be involved in greater than 90% of all cancer5, quadruplex formation in the human telomere is an attractive anti-cancer drug target. Small molecules that stabilize G-quadruplexes formed from telomeric oligonucleotide sequences in vitro have been shown to inhibit telomerase activity leading to cellular senescence and cell death in cell-based experiments6-8. Although most commonly associated with the human telomere, G-quadruplex forming sequences are also found throughout the genome9. A search of the human genome has revealed more than 370,000 potential G-quadruplex forming sequences9, 10. Recent research suggests that G-quadruplex-forming sequences are not randomly distributed but are concentrated in functionally important sites9. In particular, the occurrence of potential G-quadruplex-forming sequences is much higher in proto-oncogenes such as c-Myc11, c-Kit12, 13, Bcl-214, VEGF15, and HIF-1α16 than in other areas of the genome; whereas the occurrence of G-quadruplex-forming sequences in tumor suppressor genes tends to be much lower17.
The human c-Myc gene is a particularly significant oncogene. Alteration of this gene or its expression has been associated with many types of cancer, including but not limited to breast, lung, prostate and hematological cancers18, 19. A putative G-quadruplex-forming sequence has been discovered in the promoter region of this oncogene. The NHE-III1, a 27 base-pair guanine-rich sequence demonstrated to form G-quadruplexes in vitro20 and located upstream of the c-Myc P1 promoter, is believed to be the predominant regulator of c-Myc expression21. In a study employing a cell-based luciferase reporter system, the formation of G-quadruplexes in NHE-III1 was proposed as a mechanism for regulating c-Myc expression22. Sequence mutations that destabilize G-quadruplex formation in vitro resulted in an increase of c-Myc expression in the cells, while actions that promote G-quadruplexes formation, e.g. treating the cell with the G-quadruplex stabilizing compound meso-Tetra(N-methyl-4-pyridyl)porphine (TMPyP4)23 (Figure 1A) among others24, led to a decrease in c-Myc expression. The binding mechanism of TMPyP4 to c-Myc and other G-quadruplexes remains an area of investigation (Figure 1B-C)25-29. We believe that several factors are likely to have contributed to the discrepancies regarding the TMPyP4 binding mechanism, which include the lack of examining the inherent polymorphism and therefore a lack of definitive structures of the G-quadruplexes formed from the c-Myc promoter sequence without major perturbation of the sequence, general lack of understanding of the binding preferences, and variability and a lack of detail in reporting experimental conditions27, 28, 30-32 leading to the formation of G-quadruplexes.
Figure 1.

TMPyP4 binding to quadruplex. (A) The chemical structure of the cationic porphyrin, TMPyP4 and (B) NMR solution structure (PDB: 2A5R) of TMPyP4 binding a unimolecular G-quadruplex formed from the modified c-Myc promoter sequence, Pu24I, (C) X-ray crystal structure (PDB: 2HRI) of TMPyP4 binding to the bimolecular G-quadruplex formed from the human telomere sequence, TAG3T2AG3.
G-quadruplex formation can be highly polymorphic33, 34. In the presence of sodium, it is generally accepted that the human telomere sequence, G3(T2AG3)3, folds into a single anti-parallel G-quadruplex topology, often termed a “basket” configuration, with a lateral, a diagonal, and a lateral connecting loop35. In the presence of potassium, the predominant cation inside the cell and the nucleus, the same sequence can adopt a number of different topologies with variations in connecting loop types, strand/segment orientations, numbers of G-quartets, and glycosyl torsion angles depending on the conditions (e.g. buffer composition, the presence of organic solvents such as acetonitrile or ethanol, DNA concentration, ion concentration, annealing profile, and the presence of various biological molecules). While it is a relatively simple G-quadruplex-forming sequence, the human telomere sequence can potentially fold into more than 200 intramolecular conformations33. For more complex G-quadruplex-forming sequences, such as those commonly found in the promoter regions of many oncogenes, this issue can be greatly exacerbated. As an example of one such sequence, the c-Myc parent sequence (i.e. Pu27, Figure 2) has 5 runs of 3 or more guanines and can potentially display a much greater degree of polymorphism than in the telomere sequence. Consequently, when a G-quadruplex-forming sequence is studied, certain steps are usually taken to reduce this inherent polymorphism.
Figure 2.
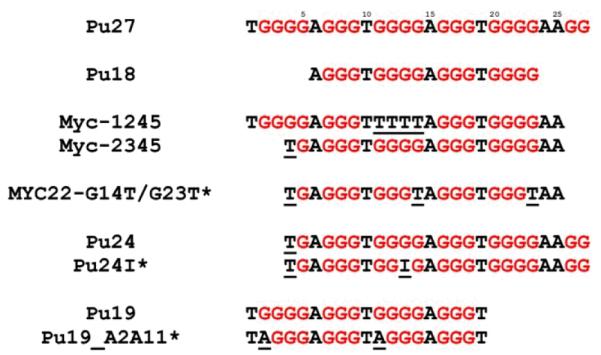
Sequence information for the c-Myc G-quadruplex-forming sequence and reported derivatives. Substituted bases are underlined. Complete NMR structures are available for sequences marked with asterisk.
The most common approach to reducing the structural polymorphism of G-quadruplex-forming sequences is through sequence modification36, 37. Initially, in the case of the parent c-Myc sequence (i.e. Pu27), the five runs of three or more guanines are truncated to four runs (Pu18 and Pu19) or truncated and then further modified by addition of a base (i.e. Myc-2345 and Pu24). Subsequent base substitutions and subtractions, generally reducing the number of guanines to exactly four runs of three guanines or forcing certain regions of the sequence to be loops, have also been used to yield several sequences with reduced polymorphism (i.e. Myc-2345 to MYC22-G14T/G23T, Pu19 to Pu19_A2A11, Myc-1245). Some sequences can be further modified by base substitutions with non-canonical bases such as inosine (i.e. Pu24 to Pu24I). Among these sequences, only a selected few are sufficiently enriched in one particular topology necessary for the determination of the complete structure by NMR (i.e. MYC22-G14T/G23T, Pu24I, Pu19_A2A11)27, 38-41. Regardless of the approach taken, the results are often new sequences that are markedly different from the parent sequence (Figure 2).
Other sequence modifications include incorporation of 8-methylguanine or 8-bromoguanine which are known to produce G-quadruplex structures with a syn glycosidic configuration42-45, while use of O6-methylguanine, inosine, or 6-thioguanine have been shown to destabilize G-quadruplex formation46-49. Incorporation of 8-aminoguanine and 8-methylguanine promote formation of tetramolecular parallel quadruplexes such as those formed by TG4T50, 51. Modifications of the sugar-phosphate backbone by insertion of 5′-5′ or 3′-3′ polarity inversion have also been shown to have a dramatic effect on G-quadruplex formation and stability52-54 and use of RNA or LNA force adoption of a anti glycosidic guanosine conformation55-58. In addition to sequence modifications, another common approach to reduce polymorphism is by changing the solution conditions. The addition of biological molecules59 (e.g. sugar, proteins), presence of co-solvents (e.g. acetonitrile, PEG)60, 61, choice of divalent versus monovalent cations62, 63, and cation concentration64, 65 all play a major role in directing G-quadruplex formation and determining stability.
Among the limitations of the methods described above for resolving the polymorphism of G-quadruplex structures is that such an approach can often result in drastic and unpredictable perturbation of the system. The untested assumption is that these means of reducing polymorphism enriches a member of the ensemble of species originally formed by the parent sequence. In fact, it is possible that such a perturbation can shift the equilibrium to favor species that might not actually form in vitro or in vivo33. G-quadruplex polymorphism has severely hindered investigation of quadruplex structure, biophysical properties, small molecule interaction, and the thermodynamics of quadruplex formation. We have reported that techniques commonly used to study G-quadruplex DNA are typically too low in resolution to distinguish between species in a mixture, e.g. CD spectroscopy, UV-Vis spectroscopy, ultracentrifugation, and gel electrophoresis, while high resolution techniques, e.g. NMR spectroscopy, are of limited utility for mixtures containing multiple G-quadruplex topologies34.
Recently, we reported results for ten different G-quadruplex-forming promoter sequences66 ( including c-Myc) examined by SEC, a technique that was able to show their polymorphism in vitro without perturbing the system by sequence modifications67. It was discovered that these ensembles of structures are more complex than previously thought, a factor masked by the determination of single supposedly representative structures. In addition to the diverse topologies from individual strands, we observed that G-quadruplexes can associate together to form dimers, trimers, and higher-order G-wire structures in vitro66. We employed SEC to resolve the polymorphism of the c-Kit promoter sequence, (CG3)2(CG)2(AG3)2T (PDB: 2KJ2), into three fractions that were revealed by AUC to be of a monomer species, a dimer species, and a higher-order G-wire species.
Here, we examine in detail the structural polymorphism of the c-Myc promoter G-quadruplex-forming sequence and describe the influence of experimental conditions (e.g. DNA concentration, ion concentration, buffer components, annealing conditions, dialysis procedure, etc.) on the polymorphism. We observe the interactions of TMPyP4 with the c-Myc G-quadruplex ensemble in solution and demonstrate that it binds preferentially to some G-quadruplex structures. As a consequence, TMPyP4 perturbs the distribution of species within the ensemble. In addition, we also examine several modified c-Myc sequences which showed reduced polymorphism compared to the parent Pu27 sequence. However, we cannot definitely conclude whether such G-quadruplex structures existed within the original ensemble or were produced as a consequence of sequence modification.
RESULTS AND DISCUSSION
Examination of the Polymorphism of the c-Myc Promoter G-Quadruplex Forming Sequence (Pu27)
G-quadruplexes formed from a single G-quadruplex-forming DNA sequence can sometimes adopt multiple topologies in solution that exist in equilibrium with one another33. The complexity of such a G-quadruplex containing system in vitro is poorly understood and often underrepresented. The Pu27 sequence has been previously demonstrated by non-denaturing gel electrophoresis to form higher-order species22. This observation and its possible implications for data analysis are frequently ignored and rarely discussed in many studies, especially those examining interactions between small molecules and G-quadruplexes formed from the Pu27 sequence22, 32. In the current work, we prepared the Pu27 sequence by initially rehydrating commercially obtained Pu27 sequence in KPEK 200 buffer (6mM K2HPO4, 2 mM KH2PO4, 186 mM KCl, 1 mM EDTA disodium salt dehydrate, pH 7.0) to a stock solution with a concentration of approximately 1 mM. The stock solution was dialyzed overnight (~16 hours) in buffer. After dialysis, the sample was diluted to a concentration of 200 μM, annealed in a 100°C water bath for 10 minutes, and allowed to cool to room temperature overnight. The annealed samples were then analyzed by SEC and NMR at 200 μM or further diluted to 0.50 OD (~2 μM) for CD and AUC analysis. These conditions are outlined in detail in the Experimental Section and will be referred to throughout the text as the standard conditions. Pu27 G-quadruplexes prepared using these conditions were highly heterogeneous and shown to contain at least seven species by SEC analysis (Figure 3A). Dilution of the sample for AUC did not alter the distribution of species observed (Supporting Information, Figure S1); however, AUC analysis of the same sequence revealed a mixture consisting of at least 3 species of different sizes (Figure 3B).
Figure 3.

The structural polymorphism of the c-Myc G-quadruplex-forming sequence (Pu27) prepared under standard conditions was examined by (A) SEC, (B) AUC, and (C) CD. (A) Absorbance of DNA was monitored at 260 nm and normalized to the area under the curve. (B), c(s) is the concentration distribution of sedimenting species based on absorbance at 260 nm and normalized to the area under the curve. (C), circular dichroism, Δε, was normalized to strand concentration.
The heterogeneity of the G-quadruplex species was undetectable by CD spectroscopy (Figure 3C), a method commonly used to characterize G-quadruplex structures. The CD spectrum of the c-Myc G-quadruplex mixtures appeared as one species of what had been attributed to an all-parallel G-quadruplex with a positive peak at 260 nm and a negative peak at 240 nm68, 69. 1D 1H-NMR analysis was conducted on the mixture and showed a broad spectrum of overlapping GN1H resonances in the imino/amino proton region (Supporting Information, Figure S2), characteristic of the G-quadruplex associated Hoogsteen hydrogen bonds. The overlapping resonances indicated that the solution contained either a complex mixture of G-quadruplexes or a structure of multiple DNA strands (i.e. G-wire) or both. Lastly, in 5 subsequent Pu27 samples that were also prepared under the same conditions, we observed the same general distribution of the 7 G-quadruplex species with only slight variations within experimental reproducibility (Supporting Information, Figure S3)
Examination of Fractions Obtained from SEC Separation of c-Myc G-quadruplex-Forming Sequence
Chromatographic separation of the Pu27 sequence yielded 7 fractions. 1D 1H-NMR spectroscopy on the 7 fractions demonstrated GN1H resonances in the imino/amino proton region for all 7 fractions indicating that all fractions contained G-quadruplex structures (Supporting Information, Figure S4). Similar to the NMR spectrum of the mixture sample (Supporting Information, Figure S2), NMR spectra for fractions 1 to 6 all displayed broad overlapping resonances. Thus, these fractions could also contain G-wire structures in addition to G-quadruplexes. Initial analysis of the fractions was accomplished by individually re-injecting each fraction into SEC to examine whether there was re-equilibration between the fractions (Figure 4A). Fractions 1 and 7 appeared predominantly as one species with very little re-equilibration observed for these samples. For fractions 2-6, while also appearing predominantly as one species, some minor re-equilibration was observed compared to fractions 1 and 7. Furthermore, when analyzed individually by AUC, each fraction sedimented essentially as a single species, which indicated that each component was thermodynamically stable or that re-equilibration and multimerization occurred very slowly at room temperature (Figure 4B). The AUC samples were saved and stored at room temperature. Even after one week, the samples remained unchanged (Supporting Information, Figure S5) with only minor variations within experiment reproducibility. In addition, remixing of species separated by SEC did not change the distribution of species upon re-analysis by both SEC and AUC (Supporting information, Figure S6).
Figure 4.

Seven fractions collected from SEC separation of the Pu27 sequence prepared under standard conditions were examined by (A) SEC, (B) AUC, and (C) CD. (A) Absorbance of DNA was monitored at 260 nm and normalized to the area under the curve. (B), c(s) is the concentration distribution of sedimenting species based on absorbance at 260 nm and normalized to the area under the curve. (C), Δε was calculated and normalized to G-quadruplex concentration.
AUC analysis of fraction 7 yielded an experimentally determined molecular weight of 8,900 Da, which corresponds closely with the calculated molecular weight for one Pu27 strand (8,687.6 Da) indicating that this fraction is likely one or more unimolecular G-quadruplexes (Table 1). Fraction 6 (14,600 Da) consisted of G-quadruplex species that appeared to be intermediates between monomer and dimer. Fractions 5 (18,100 Da) and 4 (21,200 Da) each appeared to contain dimer G-quadruplexes while fractions 3 (30,000 Da), 2 (35,700 Da), and 1 (47,600 Da) were higher-order trimer, tetramer, and pentamer G-quadruplexes, respectively. This confirmed the previous AUC observation (Figure 3B) that the Pu27 sequence existed as a mixture between monomers (fraction 7) and higher-order G-quadruplex species (fractions 1-6). In addition, going from fraction 7 to fraction 1, the frictional ratio increased, which indicated that the higher-order Pu27 G-quadruplexes exhibited a more elongated solution structure compared to the monomer G-quadruplexes (Table 1). Together, these findings suggest the aggregation of lower-order G-quadruplex species to form higher-order G-quadruplex species in vitro.
Table 1.
Hydrodynamic Properties of SEC Separated Pu27 c-Myc G-Quadruplex Fractions
| Fraction | Elution Volume (mL) |
Sedimentation Coefficient (S20,W) |
Molecular Weight (D) |
Frictional Ratio |
|---|---|---|---|---|
| 1 | 18.2 | 5.89 | 47,600 | 1.468 |
| 2 | 19.1 | 5.22 | 35,700 | 1.369 |
| 3 | 20.3 | 4.52 | 30,000 | 1.408 |
| 4 | 21.6 | 3.83 | 21,200 | 1.318 |
| 5 | 22.1 | 3.61 | 18,100 | 1.259 |
| 6 | 23.1 | 3.11 | 14,600 | 1.264 |
| 7 | 24.3 | 2.38 | 8,900 | 1.188 |
We employed CD spectroscopy to further characterize the chromatographically separated G-quadruplex species. Similar to the mixture, all 7 fractions appeared by CD as one species of what has been attributed to an all-parallel G-quadruplex with a positive peak at 260 nm and a negative peak at 240 nm (Figure 4C)68, 69. The spectrum for the monomer G-quadruplex (fraction 7) had the smallest magnitude while the magnitudes of the spectra for the higher-order species (fraction 1-6) were greater. Increase in normalized circular dichroism (Δε) is observed for higher-order G-quadruplex structures70. In the current work, we normalized the circular dichroism values with respect to the number of strands using the extinction coefficient calculated by the nearest neighbor method. This value corresponded to the absorbance of the single-stranded form of the Pu27 sequence. However, the absorbance of the G-quadruplex form of a sequence is known to be less than the single-stranded absorbance71 which leads to an underestimation of the G-quadruplex concentration and an overestimation of the Δε. This unknown was a limitation to our normalization method and prevents us from making any definitive conclusions regarding the CD data of the Pu27 G-quadruplex structures from the 7 fractions.
Lastly, it should be noted that the 7 fractions collected might not represent the complete picture of the polymorphism exhibited by the Pu27 sequence. These fractions did not account for any G-quadruplex species that might have eluted at less than 18.2 ml, as indicated by the shoulder of the SEC chromatogram (Figure 3A). In addition, it should be noted that techniques such as SEC and AUC are low resolution techniques that might not be able to discern between species which have similar hydrodynamic properties. The tailing of the SEC peaks (Figure 4A) and broadening of AUC distribution curve (Figure 4B) suggested that several, if not all, fractions may contain more than one G-quadruplex species. In fact, fraction 7 was shown by 1D 1H-NMR to be a mixture of at least two species (Supporting Information, Figure S4). The enrichment by SEC separation allowed for individual GN1H resonances to be observed rather than just the broad spectrum that was observed for the mixture (Supporting Information, Figure S2). However, there were more resonances than expected for one topology implying that fraction 7 remained a mixture of several G-quadruplex monomers. The NMR spectra of the other fractions revealed that all displayed overlapping GN1H resonances indicative of higher order species and/or possibly mixtures of several species.
Effect of Annealing on G-Quadruplex Distribution in vitro
The annealing protocol used can play an important role in G-quadruplex formation. We conducted several experiments to determine whether different aspects of the annealing process may affect the distribution of Pu27 G-quadruplex species in solution. Our protocol to prepare samples for AUC and CD analysis called for the samples to be diluted from the annealed concentration of 200 μM (~50 A260) to 2 μM (~0.50 A260). We asked the question, “Will the distribution of G-quadruplex species change if the samples are annealed at 2 μM instead of 200 μM?” When annealed at the lower concentration (2 μM), we observed by both SEC and AUC a dramatic increase in the amount of monomer G-quadruplexes with a corresponding decrease in the amount of higher-G-quadruplexes (Figure 5). To further explore the concentration dependency of G-quadruplex formation we examined the distribution of Pu27 G-quadruplexes at three different concentrations of 100 μM, 200 μM, and 400 μM (Supporting Information, Figure S7). SEC analysis revealed a concentration dependent effect between 400 μM and 200 μM with the higher concentration of DNA shifting the equilibrium toward higher-order G-quadruplexes. This concentration-dependent effect was not observed between 200 μM and 100 μM.
Figure 5.

The concentration dependency of G-quadruplex formation was examined by SEC (A) and AUC (B). (A) Absorbance of DNA was monitored at 260 nm and normalized to the area under the curve. (B), c(s) is the concentration distribution of sedimenting species based on absorbance at 260 nm and normalized to the area under the curve.
In addition to the concentration, we also investigated how the distribution of G-quadruplex species can be affected by annealing temperature and quenching process. In the first experiment, Pu27 G-quadruplex solutions were prepared at 200 μM. One was annealed at 100°C in a water bath, one at 120°C under pressure in a silicon oil bath, and one was not annealed (room temperature). All were examined by SEC (Supporting Information, Figure S8A). There were only minor differences between the chromatograms of the sample annealed at 100°C and the sample that was not annealed. However, with the sample annealed at 120°C, a dramatic shift occurred and a decreased amount of higher-order G-quadruplex species was observed with the complementary increased amount of lower-order and monomer species. It is possible that at 120°C, the structures of some of the higher melting G-quadruplexes were disrupted. When these G-quadruplexes refolded while cooling, a new equilibrium was established resulting in an altered composition of G-quadruplex species in solution. In addition to the annealing temperature dependency, we also observed a change in distribution of G-quadruplex species with a higher amount of monomer species when the annealed sample was quenched on ice for 10 minutes rather than allowed to slowly cool to room temperature overnight (Supporting Information, Figure S8B). The findings from these three experiments highlight the importance of experimental protocol and annealing in determining the distribution of G-quadruplexes in solution.
Effect of Sample Preparation on G-Quadruplex Distribution in vitro
In addition to annealing, preparation of G-quadruplex samples often involves dialysis to remove small fragments remaining from synthesis of the oligonucleotide sequence and to facilitate the folding of the oligonucleotides into G-quadruplexes. An experiment was conducted to determine the effect of dialysis conditions on Pu27 G-quadruplex species distribution. Four different batches of Pu27 oligonucleotide were prepared by rehydrating the sample in KPEK 200 to a concentration of 1000 μM. One sample was kept without dialysis while three samples were dialyzed overnight in KPEK 200, one using a 0.1-.0.5 kDa MWCO membrane, one using a 0.5-1.0 kDa MWCO membrane. All four samples were diluted to a concentration of 200 μM, annealed at 100°C for 10 minutes, slowly cooled overnight to room temperature, and analyzed using SEC. A greater amount of higher-order species was observed in dialyzed samples compared to samples not dialyzed (Supporting Information, Figure S9). In addition, as the MWCO of the dialysis membrane was increased, an increase in higher-order species was observed. The A260 of the sample from before and after dialysis differed by only about 5-10%, which is within the standard for typical recovery from dialysis, indicating that the increased amount of larger G-quadruplex species observed was not due to the smaller species being dialyzed out of solution. Rather, it suggests some type of interactions between G-quadruplex structures and the dialysis membrane leading to the formation of higher-order structures. These interactions could be specific to the particular dialysis membrane being used in this study and it is possible that a different set of results could be obtained if a different type of dialysis membrane was utilized.
We also observed that the distribution of G-quadruplexes species formed from the Pu27 sequence was sensitive to other minor, seemingly innocuous, changes in sample preparation. For example, DNA obtained commercially is usually shipped lyophilized. We observed more monomeric G-quadruplexes when the lyophilized DNA was initially dissolved in deionized water instead of KPEK (Supporting Information, Figure S10). In addition to changes in sample preparation processes, minor differences in buffer composition can have significant effect on G-quadruplex formation (Supporting Information, Figure S11). When the acid form of EDTA was substituted for the disodium salt dihydrate form, more monomeric species were observed. These findings further supported that G-quadruplex formation can be affected at any step of the sample preparation process and the procedure employed should be carefully reported.
Effect of Potassium Concentration on G-Quadruplex Distribution in vitro
The concentration of potassium in solution has been known to play a large role in G-quadruplex stability and formation65. We examined the effect of altered potassium concentration on the distribution of Pu27 G-quadruplexes in solution. The Pu27 sequence was prepared in buffers with varying concentrations of potassium 25 mM, 200 mM, and 400 mM. The potassium concentration of 25 mM was chosen because it has been previously demonstrated that this is the minimum concentration of potassium required for G-quadruplex formation65. The Pu27 samples were initially rehydrated and dialyzed in the corresponding buffer, diluted to 200 μM, annealed at 100°C for 10 minutes with slow cooling, and analyzed by SEC or further diluted to 2 μM for AUC analysis. In high potassium conditions (400 mM), the distribution was predominantly higher-order species while in low potassium conditions (25 mM) it was predominantly monomers (Figure 6A-B). Additionally, 1H-NMR analysis of the sample in 25 mM potassium revealed a GN1H resonance pattern similar to that of fraction 7 (Supporting Information, Figure S12). These findings suggest that, in addition to stabilization of the G-quartet stem, potassium ions also interacts with G-quadruplexes externally and help drive the formation of higher-order G-quadruplex species.
Figure 6.

The potassium concentration dependency of G-quadruplex formation was examined by SEC (A), AUC (B), and DSC (C). (A) Absorbance of DNA was monitored at 260 nm and normalized to the area under the curve. (B), c(s) is the concentration distribution of sedimenting species based on absorbance at 260 nm and normalized to the area under the curve. (C) Excess heat capacity measurement for DSC was normalized with respect to strand concentration (200 μM)
The sample of G-quadruplexes in 400 mM K+ was diluted in a low potassium buffer until the potassium concentration was reduced to 25 mM. In order to account for any effect the dilution process might have on G-quadruplex equilibrium, another sample was diluted while keeping the potassium concentration at 400 mM. Similarly, the 25 mM K+ sample was diluted in high potassium buffer to bring the final potassium concentration to 400 mM for the test sample or kept at 25 mM K+ as a control. The process of dilution alone did not alter the distribution of G-quadruplex species (Supporting Information, Figure S13). Going from high potassium conditions (400 mM) to low potassium conditions (25 mM) resulted in less of the higher-order species and more of the lower-order species such as monomers while a change to higher potassium concentration led to lesser amount of monomers and higher amount of higher-order G-quadruplexes (Supporting Information, Figure S14). It should be noted that this is a very slow process. These changes were only observable after nearly two weeks of incubation as one day of incubation revealed no changes.
The effect of potassium concentration on G-quadruplex formation was also examined using DSC melting (Figure 6C). Under standard conditions in 200 mM K+ buffer, the Pu27 G-quadruplexes were extremely stable, requiring superheating past the boiling point of water to melt. The high melting temperature was an indicator of the stability of the G-quadruplex structures. In addition, the large change in excess heat capacity of the system between 80°C to 120°C further indicated the stability of these G-quadruplex structures. The DSC data agreed with previous observations by SEC that annealing at 100°C is not at a sufficiently high enough temperature to unfold some of the higher-order G-quadruplex species (Supporting Information, Figure S7A). Compared to the thermogram at 200 mM K+, the thermogram under high potassium conditions (400 mM) shifted to the right to indicate increased stability while the thermogram under low potassium conditions (25 mM) shifted to the left to indicate decreased stability. This observation correlates with that seen by SEC and AUC that in high potassium (400 mM) there is an increase in higher-order, presumably more stable, G-quadruplex species, while in low potassium (25 mM), there are more of lower-order, presumably less stable G-quadruplexes. It should be noted that the presence of additional cations alone could result in an increase in melting temperature. Therefore, from the data we were not able to determine how much of the increase in melting temperature was due to the increase in higher-order structures and how much was due to the stabilizing effects of higher potassium concentration. However, these findings indicate that, in additional to sample preparation protocols (e.g. annealing, dialysis, etc.), experimental conditions are also important and that detailed reporting of methodology is necessary when studying with G-quadruplex structures.
Interaction of TMPyP4 with the Pu27 G-Quadruplex-Forming Sequence
As the discovery of small-molecule G-quadruplex-based inhibitors is one goal of G-quadruplex research, we examined the effect of the polymorphism of a G-quadruplex-forming sequence on in vitro small molecule binding experiments by looking at the interactions of TMPyP4 with the Pu27 sequence. TMPyP4 displayed a preference for the higher-order subpopulations of the Pu27 G-quadruplex distribution (Figure 7). The species that eluted at 20.3 and 21.6 mL, corresponding to fractions 4 and 5 (i.e. dimer G-quadruplex species) were the most preferred and their association with TMPyP4 can be seen at as low as a 1:32 [TMPyP4]:[Pu27] molar ratio. The next preferred subset was the monomer species that eluted at 24.3 mL, corresponding to fraction 7, followed by the higher-order species that eluted at less than 20.0 mL, corresponding to fraction 1, 2, and 3. Lastly, it is interesting to note a lack of observed TMPyP4 interaction with the species that eluted at 23.1 mL, corresponding to fraction 6 (i.e. the monomer/dimer intermediate G-quadruplex species), but it does not rule out possible TMPyP4 binding to these species at higher concentrations. These results indicate that small molecules may not bind the different G-quadruplex forms within the same sequence distribution equally, a significant finding when contemplating using structure-based drug design.
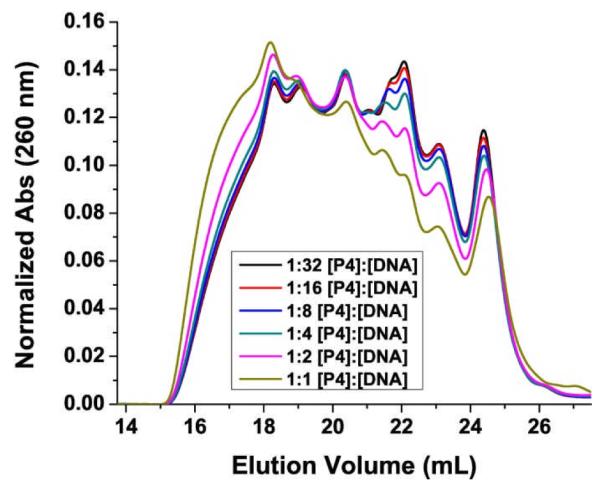
Figure 7.

The interactions of TMPyP4 with Pu27 G-quadruplexes at different molar ratios were examined by SEC. The DNA bound form of TMPyP4 were monitored at 445 nm and normalized to the area under the curve
Another important observation is that TMPyP4 not only prefers to bind to higher-order species but it also directly alters the polymorphic distribution of G-quadruplex towards formation of these higher-order species (Figure 8). The addition of TMPyP4 to the Pu27 system resulted in lower amounts of the species that eluted 24.3 mL, 23.1 mL, 22.1 mL, 21.6 mL and 20.3 mL and greater amounts of the species that eluted at 19.1 mL and 18.2 mL as well as other higher-order species that elute before 18.2 mL. This observation is important as it suggests that there is induced change in the original distribution thus altering the baseline and potentially altering the response in any given experiment. On the other hand, the findings from this and previous experiments were able to provide some insight into the binding mode of TMPyP4. These findings suggest that TMPyP4 binds to Pu27 c-Myc, and possibly other G-quadruplexes, through end-pasting which is consistent with previous reports28, 72. This binding mode facilitates TMPyP4 stabilization of G-quadruplex aggregation by the TMPyP4 interactions between G-quadruplexes.
Figure 8.
The effect of TMPyP4 interactions with DNA on the distribution of Pu27 G-quadruplexes in solution were examined by SEC. Absorbance of DNA was monitored at 260 nm and normalized to the area under the curve.
Polymorphism of Modified c-Myc G-Quadruplex-Forming Sequences
We end our discussion by examining four modified c-Myc G-quadruplex forming sequences reported in the literature (Myc-1245, Myc-2345, MYC22-G14T/G23T, and Pu24). These sequences were prepared under the same standard conditions that we used for the Pu27 sequence and analyzed using NMR (Supporting Information, Figure S15), SEC, AUC and CD (Figure 9). The 1D 1H-NMR spectra for the four sequences were comparable to previously reported spectra. Individual resonances were observed for all four sequences compared to the broad overlapping resonances observed for the Pu27 sequence. The NMR data were in agreement with SEC and AUC findings which demonstrated the enrichment of monomer G-quadruplexes (Figure 9A-B). In fact, of the four sequences, MYC22-G14T/G23T was enriched the most in single monomeric species and yielded the cleanest NMR spectrum (Supporting Information, Figure S15C). In addition, the G-quadruplex structures from the modified sequences did not aggregate to the same extent as the G-quadruplex structures from the Pu27 sequence, suggesting some fundamental differences between the two systems. This observation was further supported by CD spectroscopy, which showed a Δε spectrum of greater magnitude for the Pu27 sequence compared to the modified sequences (Figure 9C).
Figure 9.

The polymorphism of c-Myc G-quadruplexes formed from the Pu27 sequence and four derivative sequences prepared under standard conditions was examined by (A) SEC, (B) AUC, and (C) CD. (A) Absorbance of DNA was monitored at 260 nm and normalized to the area under the curve. (B), c(s) is the concentration distribution of sedimenting species based on absorbance at 260 nm and normalized to the area under the curve. (C), circular dichroism, Δε, was normalized to strand concentration.
Furthermore, it should be noted that the monomer G-quadruplexes formed from the modified sequences eluted and sedimented more slowly than the monomer G-quadruplexes formed from the Pu27 sequence. One possible explanation is that the modified sequences are smaller (22-25 bp) than the parent sequence (27 bp). However, another possible explanation is that sequence modifications did not select for a G-quadruplex topology from the original ensemble but induced a new topology altogether. While we were not able to make a definitive comparison between the G-quadruplex structures formed by the modified sequences and the G-quadruplex structures formed by the parent sequence, these findings further emphasized the limitation of sequence modification in that a new topology can potentially be induced that is not part of the original distribution, or, at the very least, a topology is artificially selected that might not be preferred in vivo33.
CONCLUSION
The c-Myc sequence in solution is a highly polymorphic ensemble of structures containing a mixture of monomers andhigher-order G-quadruplexes. We demonstrated that the higher-order species always exist in vitro. Even in the low potassium conditions (25 mM) where the monomers are predominant, a small fraction of the G-quadruplex species still existed in the higher-order form. The existence of higher order c-Myc G-quadruplex structures in vitro is a critical detail often ignored since it is believed that only the monomers are relevant in vivo. It also leads to the question “What is the relevance of an affinity constant measured for a compound against the c-Myc G-quadruplexes if the compound prefers the higher order species in vitro?” With careful controls and taking into account the polymorphism a more realistic measurement can be reported.
We have shown that the distribution of G-quadruplex species is highly sensitive to variability in sample preparation. Small differences in experimental conditions can lead to dramatic differences in the system being studied. The concentration of ions and DNA played major roles in determining the distribution between higher-order and monomer species of G-quadruplexes. Preparation of G-quadruplex samples often involves dialysis to remove small fragments left over from synthesis, and annealing at high temperature to unfold the DNA allowing for G-quadruplex formation as the sample cools. We show here that the choice and method of dialysis and annealing protocol can greatly influence the distribution of c-Myc G-quadruplex species. EDTA is often added to the DNA buffer as a chelating agent to deplete metal ions, i.e. Ca2+ and Fe3+, as these divalent cations could affect G-quadruplex stabilities by directly interacting with the DNA62, 63 or by acting as cofactors for metal-dependent DNA hydrolytic enzymes. However, the addition of EDTA to the sample buffer can result in significantly different G-quadruplex populations. The polymorphism observed becomes even more complicated when ligands are introduced. It was demonstrated that not only does TMPyP4 prefer one species of the G-quadruplex population over another but that the ligand itself actively plays a role in changing the equilibrium between the species. With so many different factors to consider and multiple opportunities along the way to introduce new variability, it is not difficult to see why there are differences in reports regarding TMPyP4 interactions with G-quadruplexes.
The biological relevance of such in vitro quadruplex systems is currently unknown. However, these findings indicate that sample preparation should be carefully considered, controlled, and reported when working with G-quadruplexes. G-quadruplexes represent an exciting area in the future of anticancer therapy. An understanding and appreciation of the complexity associated with G-quadruplex would result in higher reproducibility of data and more efficient targeted drug discovery.
EXPERIMENTAL SECTION
Oligonucleotide Preparation, Annealing, and Small Molecule Acquisition
The c-Myc G-quadruplex-forming sequence (Pu27) was purchased from Integrated DNA Technologies (Coralsville, IA) and consists of the sequence: 5′ – TGGGGAGGGTGGGGAGGGTGGGGAAGG – 3′ The standard conditions for Pu27 G-quadruplex formation is described in this section and depicted in Figure 3. Deviations from standard conditions were noted accordingly in the results section and Figure 3. A stock solution of the Pu27 oligonucleotide was dissolved in KPEK 200 (200 mM K+) buffer, which is composed of K2HPO4 (6mM), KH2PO4 (2mM), KCl (185mM), EDTA disodium salt dihydrate (1mM), pH 7.0. Dialysis was performed overnight using Spectrum Laboratories (Rockford, IL, USA) 0.1-0.5 kDa MWCO dialysis devices following manufacturer’s instructions. The DNA was quantified using a NanoDrop 2000 instrument (Thermo Scientific, Wilmington, DE). Samples were made at 200 μM strand concentration (with ε=279,900 L·M−1·cm−1 for the single-strand form) by dilution of the dialyzed Pu27 stock solution with KPEK 200. The oligonucleotide samples were annealed in a water bath by heating to 100°C, holding the samples at temperature for 10 minutes, and gradually cooling to room temperature overnight.
A 10mM concentrated stock solution of TMPyP4 (Frontier Scientific, Logan, UT) was produced by weighing out the compound and dissolving in DMSO. TMPyP4 concentration was quantified using a NanoDrop 2000 instrument. To prepare TMPyP4 for titration against Pu27, the stock solution of TMPyP4 was diluted by a factor of 4 in DMSO. 10μL of diluted TMPyP4 was mixed with 125μL of 200μM dialyzed and annealed Pu27 G-quadruplex (7.4% DMSO final volume) to form the 1:1 [TMPyP4]:[Pu27] mixture. TMPyP4 was further diluted for the 1:2, 1:4, 1:8, 1:16, 1:32 samples. A sample without TMPyP4 and 7.4% DMSO was examined by SEC and found that the presence of DMSO did not alter the distribution of G-quadruplex species in solution.
Size-Exclusion Chromatography (SEC)
SEC was performed over 600 minutes using a Waters system (Waters 2998 Photodiode Array Detector and Waters 600 Pump, Waters Corporation, Milford, MA) with monitoring of the c-Myc G-quadruplex at an absorbance of 260nm and of DNA-bound TMPyP4 at an absorbance of approximately 445nm. Two Superdex™ 75 10/300 columns connected serially (GE Healthcare, Piscataway, NJ) were employed for sample separation using a flow rate of 0.05 mL/min with 50μL injection volumes of the sample. The mobile phase was consisted of 100 mM KCl, 20 mM K2HPO4, pH 7.0. The absorbance of eluted DNA was adjusted by setting the minimum absorbance between 13.75 and 27.50 mL to 0. Absorbance was normalized by dividing the adjusted absorbance by the total area under the curve between 13.75 and 27.50 mL.
Circular Dichroism (CD)
CD experiments were performed on a Jasco J-710 spectropolarimeter (Jasco Inc., Easton, MD). CD scanning experiments were performed at an A260 of 0.50 from 340nm to 220nm with a data interval of 1nm, band width of 1nm, response of 1 second, scanning speed of 200 nm/minute and a total of four accumulated scans. The CD of the mixture samples were normalized with respect to strand concentration (ε=279,900 L·M−1·cm−1). For the SEC separated fractions, the CD were normalized to the number of G-quadruplexes based on the MW determined by AUC experiments.
Analytical Ultracentrifugation (AUC)
AUC was carried out in a Beckman Coulter ProteomeLab XL-A analytical ultracentrifuge (Beckman Coulter Inc., Brea, CA) at 20°C overnight at 50,000 rpm in standard 2 sector cells. Data were analyzed using the program Sedfit (free software: www.analyticalultracentrifugation.com). Buffer density was determined on a Mettler/Paar Calculating Density Meter DMA 55A at 20.0°C and buffer viscosity was calculated using Sednterp software (free software: www.jphilo.mailway.com). For the calculation of frictional ratio, 0.55 mL/g was used for partial specific volume and 0.3 g/g was assumed for the amount of water bound.
Differential Scanning Calorimetry (DSC)
DSC was conducted using a MicroCal VP-DSC (MicroCal Inc., Piscataway, NJ) for thermal denaturation of the c-Myc oligodeoxynucleotide in 25, 200 and 400 mM total potassium conditions. Prior to scanning DNA samples, 25, 200 or 400 mM potassium buffer scans were collected for thermal equilibration of the instrument and collection of baseline scans for analysis of DSC thermograms. DNA samples were prepared at 200 μM strand concentration under the preparation conditions given above. DSC scan parameters included a temperature range of 20°C to 120°C to encompass the melting temperature even at high potassium concentrations. Data were collected for both heating and cooling scans with a temperature gradient of 30°C/hr to mimic slow annealing conditions. Additional scan parameters included zero hold times for pre and post-scan holds and low gain to minimize noise with slow scanning conditions. Data analysis was done using Origin 7.0 software. Blank buffer scans were subtracted from DNA sample scans and normalized for DNA concentration. Further baseline adjustments were made based on pre- and post-denaturation regions.
Supplementary Material
Acknowledgements
We would like to acknowledge Dr. Robert D. Gray for useful discussions regarding the experiments conducted in this study. Molecular graphics images were produced using the UCSF Chimera package from the Resource for Biocomputing, Visualization, and Informatics at the University of California, San Francisco (supported by NIH P41 RR001081). This work was supported by NIH Grants CA35635 (J.B.C), GM077422 (J.B.C. & J.O.T) and University of Louisville grant, CTSPGP 20058 Award (J.B.C. & J.O.T)
Abbreviations
- NHE-III1
Nuclease Hypersensitivity Element III1
- TMPyP4
meso-Tetra(N-methyl-4-pyridyl)porphine
- SEC
size exclusion chromatography
- AUC
analytical ultracentrifugation
- CD
circular dichroism
- NMR
nuclear magnetic resonance
- DSC
differential scanning calorimetry
- MWCO
molecular weight cutoff
- EDTA
ethylenediaminetetraacetic acid.
Footnotes
Electronic Supplementary Information (ESI) available: Methods, Figure, and Tables. See DOI: 10.1039/b000000x/
References
- 1.Williamson JR. Annual Review of Biophysics and Biomolecular Structure. 1994;23:703–730. doi: 10.1146/annurev.bb.23.060194.003415. [DOI] [PubMed] [Google Scholar]
- 2.Huppert JL. Chemical Society Reviews. 2008;37:1375–1384. doi: 10.1039/b702491f. [DOI] [PubMed] [Google Scholar]
- 3.Neidle S. FEBS Journal. 2010;277:1118–1125. doi: 10.1111/j.1742-4658.2009.07463.x. [DOI] [PubMed] [Google Scholar]
- 4.Wright WE, Tesmer VM, Huffman KE, Levene SD, Shay JW. Gene Dev. 1997;11:2801–2809. doi: 10.1101/gad.11.21.2801. [DOI] [PMC free article] [PubMed] [Google Scholar]
- 5.Shay JW, Bacchetti S. European Journal of Cancer. 1997;33:787–791. doi: 10.1016/S0959-8049(97)00062-2. [DOI] [PubMed] [Google Scholar]
- 6.Riou JF, Guittat L, Mailliet P, Laoui A, Renou E, Petitgenet O, Mégnin-Chanet F, Hélène C, Mergny JL. Proceedings of the National Academy of Sciences. 2002;99:2672–2677. doi: 10.1073/pnas.052698099. [DOI] [PMC free article] [PubMed] [Google Scholar]
- 7.Cuesta J, Read MA, Neidle S. Mini Reviews in Medicinal Chemistry. 2003;3:11. doi: 10.2174/1389557033405502. [DOI] [PubMed] [Google Scholar]
- 8.De Cian A, Lacroix L, Douarre C, Temime-Smaali N, Trentesaux C, Riou JF, Mergny JL. Biochimie. 2008;90:131–155. doi: 10.1016/j.biochi.2007.07.011. [DOI] [PubMed] [Google Scholar]
- 9.Huppert JL, Balasubramanian S. Nucleic Acids Res. 2005;33:2908–2916. doi: 10.1093/nar/gki609. [DOI] [PMC free article] [PubMed] [Google Scholar]
- 10.Huppert JL, Balasubramanian S. Nucleic Acids Res. 2007;35:406–413. doi: 10.1093/nar/gkl1057. [DOI] [PMC free article] [PubMed] [Google Scholar]
- 11.Ambrus A, Chen D, Dai JX, Jones RA, Yang DZ. Biochemistry. 2005;44:2048–2058. doi: 10.1021/bi048242p. [DOI] [PubMed] [Google Scholar]
- 12.Hsu STD, Varnai P, Bugaut A, Reszka AP, Neidle S, Balasubramanian S. Journal of the American Chemical Society. 2009;131:13399–13409. doi: 10.1021/ja904007p. [DOI] [PMC free article] [PubMed] [Google Scholar]
- 13.Phan AT, Kuryavyi V, Burge S, Neidle S, Patel DJ. J Am Chem Soc. 2007;129:4386–4392. doi: 10.1021/ja068739h. [DOI] [PMC free article] [PubMed] [Google Scholar]
- 14.Dai J, Chen D, Jones RA, Hurley LH, Yang D. Nucleic Acids Res. 2006;34:5133–5144. doi: 10.1093/nar/gkl610. [DOI] [PMC free article] [PubMed] [Google Scholar]
- 15.Sun DY, Guo KX, Rusche JJ, Hurley LH. Nucleic Acids Res. 2005;33:6070–6080. doi: 10.1093/nar/gki917. [DOI] [PMC free article] [PubMed] [Google Scholar]
- 16.De Armond R, Wood S, Sun DY, Hurley LH, Ebbinghaus SW. Biochemistry. 2005;44:16341–16350. doi: 10.1021/bi051618u. [DOI] [PubMed] [Google Scholar]
- 17.Eddy J, Maizels N. Nucleic Acids Res. 2006;34:3887–3896. doi: 10.1093/nar/gkl529. [DOI] [PMC free article] [PubMed] [Google Scholar]
- 18.Nesbit CE, Tersak JM, Prochownik EV. Oncogene. 1999;18:3004–3016. doi: 10.1038/sj.onc.1202746. [DOI] [PubMed] [Google Scholar]
- 19.Nilsson JA, Cleveland JL. Oncogene. 2003;22:9007–9021. doi: 10.1038/sj.onc.1207261. [DOI] [PubMed] [Google Scholar]
- 20.Simonsson T, Kubista M, Pecinka P. Nucleic Acids Research. 1998;26:1167–1172. doi: 10.1093/nar/26.5.1167. [DOI] [PMC free article] [PubMed] [Google Scholar]
- 21.Brooks TA, Hurley LH. Genes & Cancer. 2010;1:641–649. doi: 10.1177/1947601910377493. [DOI] [PMC free article] [PubMed] [Google Scholar]
- 22.Siddiqui-Jain A, Grand CL, Bearss DJ, Hurley LH. Proceedings of the National Academy of Sciences. 2002;99:11593–11598. doi: 10.1073/pnas.182256799. [DOI] [PMC free article] [PubMed] [Google Scholar]
- 23.Grand CL, Han H, Muñoz RM, Weitman S, Von Hoff DD, Hurley LH, Bearss DJ. Molecular Cancer Therapeutics. 2002;1:565–573. [PubMed] [Google Scholar]
- 24.Brown RV, Danford FL, Gokhale V, Hurley LH, Brooks TA. Journal of Biological Chemistry. 2011 doi: 10.1074/jbc.M111.274720. [DOI] [PMC free article] [PubMed] [Google Scholar]
- 25.Anantha NV, Azam M, Sheardy RD. Biochemistry. 1998;37:2709–2714. doi: 10.1021/bi973009v. [DOI] [PubMed] [Google Scholar]
- 26.Haq I, Trent JO, Chowdhry BZ, Jenkins TC. Journal of the American Chemical Society. 1999;121:1768–1779. [Google Scholar]
- 27.Seenisamy J, Rezler EM, Powell TJ, Tye D, Gokhale V, Joshi CS, Siddiqui-Jain A, Hurley LH. Journal of the American Chemical Society. 2004;126:8702–8709. doi: 10.1021/ja040022b. [DOI] [PubMed] [Google Scholar]
- 28.Freyer MW, Buscaglia R, Kaplan K, Cashman D, Hurley LH, Lewis EA. Biophysical Journal. 2007;92:2007–2015. doi: 10.1529/biophysj.106.097246. [DOI] [PMC free article] [PubMed] [Google Scholar]
- 29.Wei C, Jia G, Zhou J, Han G, Li C. Physical Chemistry Chemical Physics. 2009;11:4025–4032. doi: 10.1039/b901027k. [DOI] [PubMed] [Google Scholar]
- 30.Seenisamy J, Bashyam S, Gokhale V, Vankayalapati H, Sun D, Siddiqui-Jain A, Streiner N, Shin-ya K, White E, Wilson WD, Hurley LH. Journal of the American Chemical Society. 2005;127:2944–2959. doi: 10.1021/ja0444482. [DOI] [PubMed] [Google Scholar]
- 31.González V, Guo K, Hurley L, Sun D. Journal of Biological Chemistry. 2009;284:23622–23635. doi: 10.1074/jbc.M109.018028. [DOI] [PMC free article] [PubMed] [Google Scholar]
- 32.Ou T-M, Lin J, Lu Y-J, Hou J-Q, Tan J-H, Chen S-H, Li Z, Li Y-P, Li D, Gu L-Q, Huang Z-S. Journal of Medicinal Chemistry. 2011;54:5671–5679. doi: 10.1021/jm200062u. [DOI] [PubMed] [Google Scholar]
- 33.Lane AN, Chaires JB, Gray RD, Trent JO. Nucleic Acids Res. 2008;36:5482–5515. doi: 10.1093/nar/gkn517. [DOI] [PMC free article] [PubMed] [Google Scholar]
- 34.Dailey MM, Miller MC, Bates PJ, Lane AN, Trent JO. Nucleic Acids Research. 2010;38:4877–4888. doi: 10.1093/nar/gkq166. [DOI] [PMC free article] [PubMed] [Google Scholar]
- 35.Wang Y, Patel DJ. Structure. 1993;1:263–282. doi: 10.1016/0969-2126(93)90015-9. [DOI] [PubMed] [Google Scholar]
- 36.Dai J, Carver M, Yang D. Biochimie. 2008;90:1172–1183. doi: 10.1016/j.biochi.2008.02.026. [DOI] [PMC free article] [PubMed] [Google Scholar]
- 37.Yang D, Okamoto K. Future Medicinal Chemistry. 2010;2:619–646. doi: 10.4155/fmc.09.172. [DOI] [PMC free article] [PubMed] [Google Scholar]
- 38.Phan AT, Modi YS, Patel DJ. Journal of the American Chemical Society. 2004;126:8710–8716. doi: 10.1021/ja048805k. [DOI] [PMC free article] [PubMed] [Google Scholar]
- 39.Ambrus A, Chen D, Dai J, Jones RA, Yang D. Biochemistry. 2005;44:2048–2058. doi: 10.1021/bi048242p. [DOI] [PubMed] [Google Scholar]
- 40.Phan AT, Kuryavyi V, Gaw HY, Patel DJ. Nat Chem Biol. 2005;1:167–173. doi: 10.1038/nchembio723. [DOI] [PMC free article] [PubMed] [Google Scholar]
- 41.Mathad RI, Hatzakis E, Dai J, Yang D. Nucleic Acids Research. 2011 doi: 10.1093/nar/gkr612. [DOI] [PMC free article] [PubMed] [Google Scholar]
- 42.Esposito V, Randazzo A, Piccialli G, Petraccone L, Giancola C, Mayol L. Organic & Biomolecular Chemistry. 2004;2:313–318. doi: 10.1039/b314672c. [DOI] [PubMed] [Google Scholar]
- 43.Virgilio A, Esposito V, Randazzo A, Mayol L, Galeone A. Nucleic Acids Res. 2005;33:6188–6195. doi: 10.1093/nar/gki924. [DOI] [PMC free article] [PubMed] [Google Scholar]
- 44.Virgilio A, Esposito V, Randazzo A, Mayol L, Galeone A. Bioorgan Med Chem. 2005;13:1037–1044. doi: 10.1016/j.bmc.2004.11.037. [DOI] [PubMed] [Google Scholar]
- 45.Virgilio A, Esposito V, Citarella G, Pepe A, Mayol L, Galeone A. Nucleic Acids Research. 2012;40:461–475. doi: 10.1093/nar/gkr670. [DOI] [PMC free article] [PubMed] [Google Scholar]
- 46.Mekmaysy CS, Petraccone L, Garbett NC, Ragazzon PA, Gray R, Trent JO, Chaires JB. J Am Chem Soc. 2008;130:6710–6711. doi: 10.1021/ja801976h. [DOI] [PubMed] [Google Scholar]
- 47.Petrovic AG, Polavarapu PL. Journal of Physical Chemistry B. 2008;112:2255–2260. doi: 10.1021/jp075873v. [DOI] [PubMed] [Google Scholar]
- 48.Marathias VM, Sawicki MJ, Bolton PH. Nucleic Acids Res. 1999;27:2860–2867. doi: 10.1093/nar/27.14.2860. [DOI] [PMC free article] [PubMed] [Google Scholar]
- 49.Spackova N, Cubero E, Sponer J, Orozco M. Journal of the American Chemical Society. 2004;126:14642–14650. doi: 10.1021/ja0468628. [DOI] [PubMed] [Google Scholar]
- 50.Gros J, Avino A, de la Osa JL, Gonzalez C, Lacroix L, Perez A, Orozco M, Eritja R, Mergny JL. Chem Commun. 2008:2926–2928. doi: 10.1039/b801221k. [DOI] [PubMed] [Google Scholar]
- 51.Tran PLT, Virgilio A, Esposito V, Citarella G, Mergny J-L, Galeone A. Biochimie. 2011;93:399–408. doi: 10.1016/j.biochi.2010.10.011. [DOI] [PubMed] [Google Scholar]
- 52.Esposito V, Virgilio A, Randazzo A, Galeone A, Mayol L. Chem Commun. 2005:3953–3955. doi: 10.1039/b504455c. [DOI] [PubMed] [Google Scholar]
- 53.Esposito V, Virgilio A, Pepe A, Oliviero G, Mayol L, Galeone A. Bioorganic & Medicinal Chemistry. 2009;17:1997–2001. doi: 10.1016/j.bmc.2009.01.027. [DOI] [PubMed] [Google Scholar]
- 54.Galeone A, Mayol L, Virgilio A, Virno A, Randazzo A. Molecular BioSystems. 2008;4:426–430. doi: 10.1039/b718778e. [DOI] [PubMed] [Google Scholar]
- 55.Bonifacio L, Church FC, Jarstfer MB. International Journal of Molecular Sciences. 2008;9:422–433. doi: 10.3390/ijms9030422. [DOI] [PMC free article] [PubMed] [Google Scholar]
- 56.Kumar N, Maiti S. J Phys Chem B. 2007;111:12328–12337. doi: 10.1021/jp072705u. [DOI] [PubMed] [Google Scholar]
- 57.Tang CF, Shafer RH. J Am Chem Soc. 2006;128:5966–5973. doi: 10.1021/ja0603958. [DOI] [PMC free article] [PubMed] [Google Scholar]
- 58.Qi J, Shafer RH. Biochemistry. 2007;46:7599–7606. doi: 10.1021/bi602392u. [DOI] [PubMed] [Google Scholar]
- 59.Sannohe Y, Sugiyama H. Current Protocols in Nucleic Acid Chemistry. John Wiley & Sons, Inc.; 2001. [DOI] [PubMed] [Google Scholar]
- 60.Xue Y, Kan Z.-y., Wang Q, Yao Y, Liu J, Hao Y.-h., Tan Z. Journal of the American Chemical Society. 2007;129:11185–11191. doi: 10.1021/ja0730462. [DOI] [PubMed] [Google Scholar]
- 61.Miller MC, Buscaglia R, Chaires JB, Lane AN, Trent JO. Journal of the American Chemical Society. 2010;132:17105–17107. doi: 10.1021/ja105259m. [DOI] [PubMed] [Google Scholar]
- 62.Blume SW, Guarcello V, Zacharias W, Miller DM. Nucleic Acids Research. 1997;25:617–625. doi: 10.1093/nar/25.3.617. [DOI] [PMC free article] [PubMed] [Google Scholar]
- 63.Miyoshi D, Nakao A, Sugimoto N. Nucleic Acids Symposium Series. 2001;1:259–260. doi: 10.1093/nass/1.1.259. [DOI] [PubMed] [Google Scholar]
- 64.Gray RD, Li J, Chaires JB. The Journal of Physical Chemistry B. 2009;113:2676–2683. doi: 10.1021/jp809578f. [DOI] [PMC free article] [PubMed] [Google Scholar]
- 65.Gray RD, Petraccone L, Trent JO, Chaires JB. Biochemistry. 2009;49:179–194. doi: 10.1021/bi901357r. [DOI] [PMC free article] [PubMed] [Google Scholar]
- 66.Miller MC, Le HT, Dean WL, Holt PA, Chaires JB, Trent JO. Organic & Biomolecular Chemistry. 2011;9:7633–7637. doi: 10.1039/c1ob05891f. [DOI] [PMC free article] [PubMed] [Google Scholar]
- 67.Miller MC, Trent JO. Current Protocols in Nucleic Acid Chemistry. John Wiley & Sons, Inc.; 2001. [Google Scholar]
- 68.D̄apić V, Abdomerović V, Marrington R, Peberdy J, Rodger A, Trent JO, Bates PJ. Nucleic Acids Research. 2003;31:2097–2107. doi: 10.1093/nar/gkg316. [DOI] [PMC free article] [PubMed] [Google Scholar]
- 69.Karsisiotis AI, Hessari N. M. a., Novellino E, Spada GP, Randazzo A, Webba da Silva M. Angewandte Chemie International Edition. 2011;50:10645–10648. doi: 10.1002/anie.201105193. [DOI] [PubMed] [Google Scholar]
- 70.Petraccone L, Spink C, Trent JO, Garbett NC, Mekmaysy CS, Giancola C, Chaires JB. Journal of the American Chemical Society. 2011;133:20951–20961. doi: 10.1021/ja209192a. [DOI] [PMC free article] [PubMed] [Google Scholar]
- 71.Mergny J-L, Li J, Lacroix L, Amrane S, Chaires JB. Nucleic Acids Research. 2005;33:e138. doi: 10.1093/nar/gni134. [DOI] [PMC free article] [PubMed] [Google Scholar]
- 72.Wei C, Jia G, Yuan J, Feng Z, Li C. Biochemistry. 2006;45:6681–6691. doi: 10.1021/bi052356z. [DOI] [PubMed] [Google Scholar]
Associated Data
This section collects any data citations, data availability statements, or supplementary materials included in this article.