

The nucleosome core particle is the basic unit of chromatin structure in eukaryotes and consists of 147bp of double stranded DNA wrapped twice around a core comprised of histones H4, H3, H2A and H2B, assembled into an octameric arrangement. The nucleosome is essential for compaction of the eukaryotic genome but is also a dynamic assembly that is functional with regards to many processes including those of replication, repair, expression, transcription and recombination. The structure of the histone core1,2 and the nucleosome3 have been determined by x-ray crystallography. X-ray crystallography has been very successful in describing the detailed structure of the nucleosome at high resolution, but although great progress has been achieved through crystallography there are many questions still to be answered and alternative ways of studying the structure and dynamics of the nucleosome and related molecules are desirable.
A small number of studies have been reported that have investigated the structure of the nucleosome using Electron paramagnetic resonance (EPR)4 or Fluorescence resonance energy transfer (FRET)5. Previous EPR studies have used CW EPR to investigate nucleosomes labeled in relatively unsophisticated ways due to the limitations of labeling technology and EPR techniques. FRET has been used to investigate spatial relationships in the nucleosome mainly by looking at FRET intensities of labeled DNA components6. Attempts to label the protein component of the nucleosome has always suffered from the restrictions imposed by the requirement to incorporate two different but complementary fluorophores in a system that is multiply dimeric7(PELDOR is most often measured using two chemically identical spin-labels). Advances in EPR technology and site directed spin labeling have allowed us to approach nucleosome structure by the addition of spin-labels to the histone components at specific locations and to use pulsed EPR to measure distance between labels. The dimeric nature of the histones in the core particle results in symmetrical pairs of spin labels, giving extremely good coverage of the overall protein core.
PELDOR (Pulsed ELectron DOuble Resonance) is an EPR technique that can provide distance measurement between spin labels8-12. Due to the nature of the measurement and the relaxation properties of nitroxide spin labels, the distances available to this technique have often been described as being limited to between approximately 20Å and 80Å. In the case of biological molecules rather than synthetic model compounds, the upper distance limit for the acquisition of high quality experimental data, on a commercially available machine, has so far been about 55Å13 (A reasonable definition of quality being that the data should have a large signal to noise ratio, show good depth of oscillation and be acquired over such a time that at least one full oscillation is recorded).
We report results obtained using PELDOR experiments, on site specifically incorporated nitroxide spin labeled histone H3, included within the core histone octamer (figure 1).
figure 1.
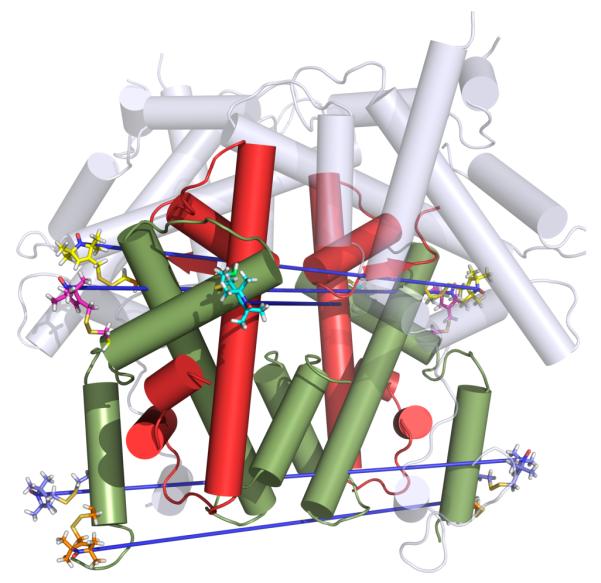
Position of spin labels on the histone octamer. H4 red, H3 green, H2AH2B grey. Distances measured indicated in blue.
Among the distances we report are two distances of about 70Å determined from extremely high quality data showing clear and significant dipolar oscillations of up to 8ms duration. Three other distances are described, all derived from spin labels attached to the H3 histone, of around 60Å, all showing clear and persistent signal oscillation.
Using simple molecular dynamics simulations on spin labeled-models, based on the crystal structure of the nucleosome core octamer (PDB id. 1TZY), we obtain remarkable correspondence between the experimental and predicted distances. (table 1)
Table 1.
For each labeled octamer is listed an experimental distance obtained my Tikhonov regularization of the PELDOR data (α=100), the half height distribution width, and a distance and linewidth, predicted by molecular dynamics.
| Mutation site |
Experiment al distance (Å) |
Distribution width at half height (Å) |
Predicted distance (Å) |
Distribution width at half height (Å) |
|---|---|---|---|---|
| H3V46C | 60 | 10 | 59/64* | 5.6/4.6* |
| H3R49C | 63 | 9 | 64 | 3.5 |
| H3L65C | 70 | 11 | 68 | 6 |
| H3Q76C | 70 | 8 | 72 | 3.5 |
| H3M90C | 59 | 11 | 59 | 4.7 |
split distribution
The extremely well defined oscillations seen in all the five examples described here, illustrate the quality of PELDOR data that can be achieved even in a complex protein oligomer. The ability to measure to 8μs owes much to the use of deuterated solvents14,15 but also to high labeling efficiency and careful sample preparation (supporting information S1) The use of 50% by volume, deuterated glycerol, to ensure that a completely glassy frozen state is achieved, and the optimization of spin-pair density to between 50 and 100μM are both crucial aspects in obtaining a persistent echo and oscillation. In spite of the long detection times the oscillations, shown here, are still truncated, having not decayed to baseline. The truncation of oscillations can lead to inaccurate baseline estimation, giving rise to imprecise distribution widths, inaccurate distances and the generation of Tikhonov artifacts. To diminish inaccurate baseline calculation and to ensure accurate distribution width determination, at least one full oscillation is required. The largest discrepancy between experimental and calculated distance is seen in L65. This data is at the extreme limit of acceptability in terms of oscillation depth, persistence and noise level. The distance distribution shown for this mutant is therefore less reliable as demonstrated by comparison to the dynamics derived distance distribution. Although experiment time domains could be extended further, we found that, for these samples, decreased signal to noise ratios tended to mitigate any further advantage obtained from a more complete description of the oscillations. In order to reliably measure to 8nm one would have to significantly extend the detection time and obtain somewhat greater sensitivity in the PELDOR experiment.
Supplementary Material
Figure 2.

Left column, uncorrected PELDOR data (red), background correction (blue), corrected data (black). Right column, distance distributions derived by Tikhonov regularization with regularization parameter 100 (black), Dynamics determined distance distribution (red). The splitting of the V46 distribution is an artifact caused by the dynamic simulation of a spin label near the N-terminus of the peptide chain.
ACKNOWLEDGMENT
This research of was supported by grants from BBSRC (BB/E022286/1) and the EPRC (EP/F030401/1). A.B. would like to acknowledge receipt of a Wellcome Trust studentship. We thank David Keeble and Graham Smith for discussion.
Footnotes
Supporting Information Available: Sequences and mutation sites used in this study, Protein purification and sample preparation, EPR Data Collection, data analysis, molecular dynamics method and results. This material is available free of charge via the Internet at http://pubs.acs.org.
REFERENCES
- 1.Arents G, Burlingame RW, Wang BC, Love WE, Moudrianakis EN. Proc Natl Acad Sci U S A. 1991;88:10148–52. doi: 10.1073/pnas.88.22.10148. [DOI] [PMC free article] [PubMed] [Google Scholar]
- 2.Wood CM, Nicholson JM, Lambert SJ, Chantalat L, Reynolds CD, Baldwin JP. Acta Crystallogr Sect F Struct Biol Cryst Commun. 2005;61:541–5. doi: 10.1107/S1744309105013813. [DOI] [PMC free article] [PubMed] [Google Scholar]
- 3.Luger K, Mader AW, Richmond RK, Sargent DF, Richmond TJ. Nature. 1997;389:251–60. doi: 10.1038/38444. [DOI] [PubMed] [Google Scholar]
- 4.Chan DC, Piette LH. Biochim Biophys Acta. 1980;623:32–45. doi: 10.1016/0005-2795(80)90005-7. [DOI] [PubMed] [Google Scholar]
- 5.Hoch DA, Stratton JJ, Gloss LM. J Mol Biol. 2007;371:971–88. doi: 10.1016/j.jmb.2007.05.075. [DOI] [PMC free article] [PubMed] [Google Scholar]
- 6.Kelbauskas L, Sun J, Woodbury N, Lohr D. Biochemistry. 2008;47:9627–35. doi: 10.1021/bi8000775. [DOI] [PubMed] [Google Scholar]
- 7.Park YJ, Dyer PN, Tremethick DJ, Luger K. J Biol Chem. 2004;279:24274–82. doi: 10.1074/jbc.M313152200. [DOI] [PubMed] [Google Scholar]
- 8.Milov AD, Salikohov KM, Shirov MD. Fizika Tverdogo Tela. 1981;23:975–982. [Google Scholar]
- 9.Jeschke G, Koch A, Jonas U, Godt A. Journal of Magnetic Resonance. 2002;155:72–82. doi: 10.1006/jmre.2001.2498. [DOI] [PubMed] [Google Scholar]
- 10.Martin RE, Pannier M, Diederich F, Gramlich V, Hubrich M, Spiess HW. Angewandte Chemie-International Edition. 1998;37:2834–2837. doi: 10.1002/(SICI)1521-3773(19981102)37:20<2833::AID-ANIE2833>3.0.CO;2-7. [DOI] [PubMed] [Google Scholar]
- 11.Pannier M, Veit S, Godt A, Jeschke G, Spiess HW. Journal of Magnetic Resonance. 2000;142:331–340. doi: 10.1006/jmre.1999.1944. [DOI] [PubMed] [Google Scholar]
- 12.Schiemann O, Prisner TF. Q Rev Biophys. 2007;40:1–53. doi: 10.1017/S003358350700460X. [DOI] [PubMed] [Google Scholar]
- 13.Schiemann O, Piton N, Mu YG, Stock G, Engels JW, Prisner TF. Journal of the American Chemical Society. 2004;126:5722–5729. doi: 10.1021/ja0393877. [DOI] [PubMed] [Google Scholar]
- 14.Jeschke G, Bender A, Paulsen H, Zimmermann H, Godt A. Journal of Magnetic Resonance. 2004;169:1–12. doi: 10.1016/j.jmr.2004.03.024. [DOI] [PubMed] [Google Scholar]
- 15.Borbat PP, Davis JH, Butcher SE, Freed JH. Journal of the American Chemical Society. 2004;126:7746–7747. doi: 10.1021/ja049372o. [DOI] [PubMed] [Google Scholar]
Associated Data
This section collects any data citations, data availability statements, or supplementary materials included in this article.