

Abstract
Study Objectives:
Determining the presence and severity of obstructive sleep apnea (OSA) is based on apnea and hypopnea event rates per hour of sleep. Making this determination presents a diagnostic challenge, given that summary metrics do not consider certain factors that influence severity, such as body position and the composition of sleep stages.
Methods:
We retrospectively analyzed 300 consecutive diagnostic PSGs performed at our center to determine the impact of body position and sleep stage on sleep apnea severity.
Results:
The median percent of REM sleep was 16% (reduced compared to a normal value of ~25%). The median percent supine sleep was 65%. Fewer than half of PSGs contained > 10 min in each of the 4 possible combinations of REM/NREM and supine/non-supine. Half of patients had > 2-fold worsening of the apnea-hypopnea index (AHI) in REM sleep, and 60% had > 2-fold worsening of AHI while supine. Adjusting for body position had greater impact on the AHI than adjusting for reduced REM%. Misclassification—specifically underestimation of OSA severity—is attributed more commonly to body position (20% to 40%) than to sleep stage (~10%).
Conclusions:
Supine-dominance and REM-dominance commonly contribute to AHI underestimation in single-night PSGs. Misclassification of OSA severity can be mitigated in a patient-specific manner by appropriate consideration of these variables. The results have implications for the interpretation of single-night measurements in clinical practice, especially with trends toward home testing devices that may not measure body position or sleep stage.
Citation:
Eiseman NA; Westover MB; Ellenbogen JM; Bianchi MT. The impact of body posture and sleep stages on sleep apnea severity in adults. J Clin Sleep Med 2012;8(6):655-666.
Keywords: Supine-dominant, REM-dominant, false-negative, phenotype
The diagnosis of obstructive sleep apnea (OSA) and its severity categorization are typically based on the apnea-hypopnea index (AHI) obtained from a single overnight laboratory polysomnogram (PSG). Large studies have shown that OSA is associated with cerebrovascular and cardiovascular morbidity and mortality in proportion to severity.1–3 Accurate assignment of apnea severity is therefore important to establish the diagnosis and to motivate treatment decisions. In addition to patient-specific considerations for individual care, accurate assessment of OSA severity is important at the population level for establishing genetic, epidemiological, and medical associations with OSA. Despite the importance of accurate diagnostic assessment, obtaining this information is challenging given that sleep apnea is a complex process with multiple contributing factors, some of which vary over time. Providers may thus be left uncertain about how to interpret the presence or severity of OSA after a single night's examination of sleep.
Current guidelines suggest offering treatment to patients with AHI values ≥ 5/h (with daytime symptoms or snoring), or > 15/h regardless of symptoms.4,5 The AHI does not capture other details about apnea physiology such as event duration or depth of desaturation but has been accepted as a gateway to diagnosis and treatment. One important question arises with respect to the AHI from a single night: what is the likelihood that an observed AHI value < 5/h or < 15/h would have been higher if more REM sleep or more supine sleep had occurred? A single “negative” study may not be sufficient to rule out OSA, in part due to these factors6,7 that influence the summary AHI values. This is especially pertinent for those patients with high pre-test probability for OSA.8 The ideal approach to studying variability in any diagnostic test is to obtain repeated measures, but for sleep, this is often not feasible due to cost and inconvenience.
BRIEF SUMMARY
Current Knowledge/Study Rationale: Current practice is to summarize the OSA diagnosis and severity by the summary full-night AHI value. We sought to determine how body position and sleep stage composition impact the full-night AHI in 300 diagnostic studies performed in our center.
Study Impact: The common finding of REM-dominance and supine-dominance of OSA has important implications for diagnostic classifications based on a single night PSG. Improved diagnostic phenotyping of OSA patients has important clinical and research implications.
When only a single night of data is available, careful accounting for factors that introduce variability may prove critical for accurate patient-specific interpretation. Among the potential sources of variability in AHI, the dependence of apnea severity on body position and sleep stage may be evident within a single PSG. For example, decreased REM sleep (as is common in the first night effect)9 or absent REM on a split-night study might lead to relative underestimation of AHI for patients who exhibit REM-dominant OSA. Body position in the laboratory may lead to over- or underestimation, depending on a patient's home sleep position patterns. Accounting for these factors may improve the clinical phenotyping of OSA patients, and most importantly, highlight circumstances in which the summary AHI from a single night PSG provides false reassurance in regards to disease severity.
We analyzed 300 diagnostic PSGs spanning a range of summary AHI values to quantify the range of stage- and position-dependence of OSA. We use this cohort to answer the following clinically-relevant questions: (1) What is the distribution of position- and stage-dependence of OSA among clinical diagnostic PSGs; and (2) what are the relative contributions of stage- and position-dependence to misclassification of disease severity?
METHODS
A sample of 300 consecutive overnight diagnostic PSGs performed in 2011 in our center, for a variety of indications, was analyzed for sleep stage and apnea severity information. Retrospective analysis of clinical PSG data was approved by the Partners Human Research Committee. Our pre-specified exclusions were age < 18 years; debilitating neurological disease; sleep efficiency < 60%; total sleep time < 4 h; and use of CPAP, oxygen therapy, or dental appliance during the study night. Sleep was scored according to standard criteria of the American Association of Sleep Medicine10 by experienced sleep technicians. Because our laboratory implements clinical criteria for conversion of diagnostic studies to split-night studies, the distribution of sleep apnea severity is biased toward lower values in this sample of full-night diagnostic studies, with an AHI value of 30/h representing the 98th percentile in this cohort. Although we did not sub-classify apnea events, central apneas were only a minority of events, prohibiting separate analysis of positional dependence of central apnea11; the median number of central apneas per study was 2, with the 95% percentile value of 20 per study.
Most clinical PSG variables did not pass tests for normality, and thus nonparametric statistical tests were generally used for analysis (Mann-Whitney rank test for 2-group comparison, or Kruskal-Wallis with Dunn post hoc for 3-group comparisons). Similarly, correlation coefficients were Pearson or Spearman rank method as appropriate based on distribution normality. To calculate REM-dependence ratios, defined as the REM AHI divided by the NREM AHI, we restricted analysis to patients with ≥ 5 min of REM sleep (n = 285, i.e., 95% of the cohort). To calculate supine-dependence ratios in the initial analysis, defined as the supine AHI divided by the non-supine AHI, we restricted analysis to patients who were supine between 5% and 95% of the night (n = 250, i.e., 83% of the cohort). For subsequent misclassification models, we repeated analysis using 20% to 80% supine to ensure adequate sampling of the supine-dependence ratios. We rounded any AHI values < 1/h up to a value of 1 to avoid artificially inflating dominance ratios due to fractional denominator values. Similar results were obtained when using the RDI (not shown).
We used Mathematica (Wolfram Research, Champaign, IL) to perform the modeling sections. In order to demonstrate the effects of position dependence, we generated contour plots illustrating AHI underestimation according to 2 position-related factors. The first is the protection from sleep apnea afforded by non-supine relative to supine body position. For example, a ratio value of 1 means position independence (no protection while non-supine), while a ratio of zero indicates perfect protection from apnea while non-supine. The second AHI adjustment factor in the contour plots is the proportion of the night spent supine, which can vary from 0–100%. Color gradient encoded the third dimension, AHI, taking into account these two factors varying over their whole range of possible values.
To simulate the effect of body position we made calculations from 4 theoretical cohorts of 1,000 people each based on realistic but conservative parameters. We aimed to approximate the distribution of AHI values in the large population Sleep Heart Health Study, with a peak in the normal range followed by a long-tailed distribution extending into the severe range.12 We assumed that the categories of no apnea (AHI < 5/h), mild apnea (AHI 5–15/h), and moderate apnea (AHI 15–30/h) were normally distributed with mean (SD) values of 2.5/h (1.25), 10/h (2.5), and 22.5/h (7.5), respectively. The severe cohort was modeled using a skew-normal (long-tailed) distribution with a mean AHI of 50/h and 95% of the values between 30/h and 90/h. These modeling assumptions allowed us to test the hypothesis that realistic conservative estimates of body position and supine dominance would lead to substantial misclassification.
For the initial modeling, each subject was assigned an AHI value according to these distributions designed to represent the spectrum of OSA severity. By virtue of the small amount of variance built into the distributions, a small fraction of simulated patients were by chance assigned an AHI value in a different class than the “true” class from which they were drawn. At this initial stage, each subject was also assigned a percentage of the night spent in the supine position (although no position dependence was imposed on the OSA values; this was a place-holder for the next step). These percentages were selected from a normal distribution of the ratio of time spent in the supine versus lateral position. The mean and SD of 1.13 (0.16) were approximated based on those found in the literature,13,14 and were similar to the percent time spent in the supine position in our cohort. In the next step, we imposed a 2-fold worsening of AHI while supine, using the baseline AHI value and the portion of the night spent supine assigned previously to each subject. To capture the reality that position dependence can increase or decrease the overall AHI depending on the baseline, those assigned a supine-to-lateral ratio greater than the mean value had an increase in overall AHI when supine dominance was imposed, while those assigned a ratio less than the mean value had a decrease in overall AHI.
RESULTS
We first illustrate representative clinical scenarios one might encounter when interpreting a single night PSG in a patient suspected of having OSA, in whom respiratory event frequency could depend on sleep stage or body position (Figure 1A). In the schematized 7-h night, about half of the time is spent supine, including 1 of the 3 REM periods. Event frequency is shown under several realistic conditions: (1) position- and stage-independent, (2) only REM dominant, (3) only supine dominant, (4) and supine dominant with additive worsening in the supine REM condition. For comparison, the final condition (5th row) shows supine and REM dominant OSA when the full sleep time was spent supine. This schematic allows one to consider the summary event index across the 4 possible combinations of sleep stage (REM versus NREM) and position (supine versus lateral; Figure 1B). Compared to the “worst-case” circumstance of all-supine sleep, time in the lateral position leads to underestimation of apnea severity. Since some of the variance in overall AHI calculation from a single PSG may be related to supine and/or REM dependence of the OSA severity, observing patients under conditions of greatest apnea vulnerability—typically the combination of supine body position and REM sleep stage—reveals the potential impact of these dependencies.
Figure 1. Schematic of stage- and position-dependent OSA.

(A) Hypnogram from a 7-h PSG, simplified to a single NREM sleep stage. The body position is shown as the dotted line. Tick marks indicate respiratory events. For visual clarity, each tick mark represents 2 apneas. Each row of tick marks is a different potential circumstance: Indep, position- and stage-independence; R-dom, REM dominance alone (2-fold); S-dom, supine dependence alone (2-fold); S&R-dom, supine dominance with worsening in REM only while supine (2-fold for each factor); S&R-dom (all supine), supine and REM dominance (2-fold each) assuming that the patient was supine for the whole night. (B) AHI values from each of the four conditions representing combinations of sleep stage and body position, as well as the total AHI (events/h).
Sleep Stage and Body Position Distributions in Diagnostic PSGs
We analyzed a sample of consecutive diagnostic PSGs (n = 300) from our center, regardless of reason for referral (most were referred for sleep apnea). The characteristics of this population are given in Table 1. The portion of the total sleep time (TST) spent in REM sleep was variable: the median value was 16%, with 22% having < 10% of the TST in REM sleep, and only 13% exhibiting > 25% of the TST in REM sleep (Figure 2A). This reduction in REM sleep may represent the classic first night effect, which also includes excess N1 and decreased sleep efficiency.9 The median portion of the TST spent in the supine position was 65%. Only 19% of patients spent > 90% of the TST in the supine position (Figure 2B). The chance of observing the supine position while in NREM was greater than while in REM sleep (median of 68% versus 54% was supine, respectively; p < 0.003, Mann-Whitney test). It is unknown for individual patients how their time spent supine in the lab relates to their home sleep position patterns. In the lab, patients are encouraged to sleep supine and may even choose to do so because of the sensor montage; thus, the portion supine observed in the lab may be an overestimate compared to home patterns.
Table 1.
Population characteristics
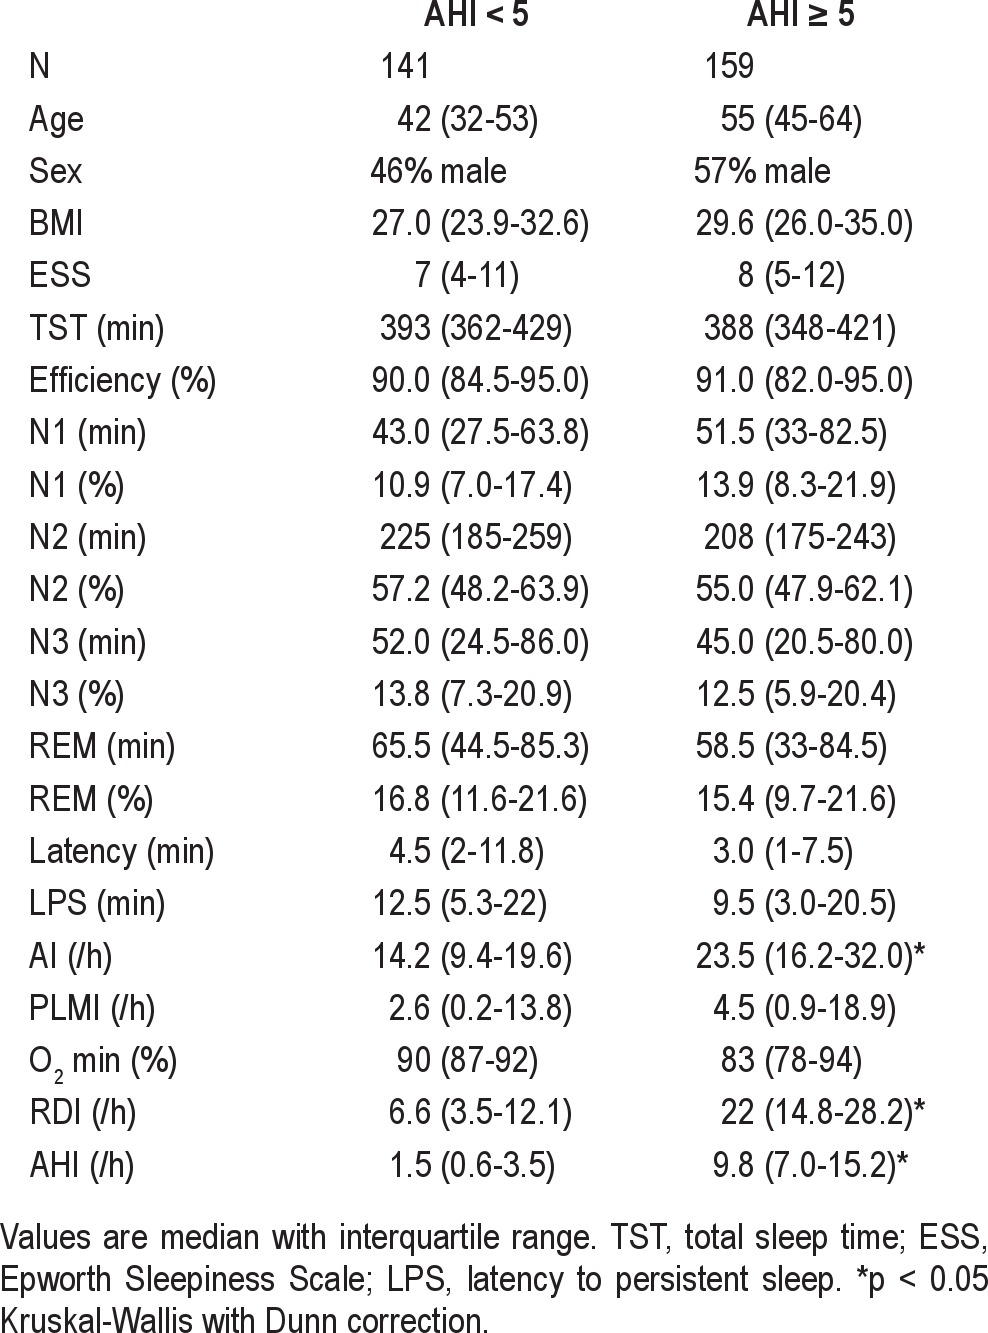
Figure 2. Distribution of sleep stage and body position in diagnostic PSGs.
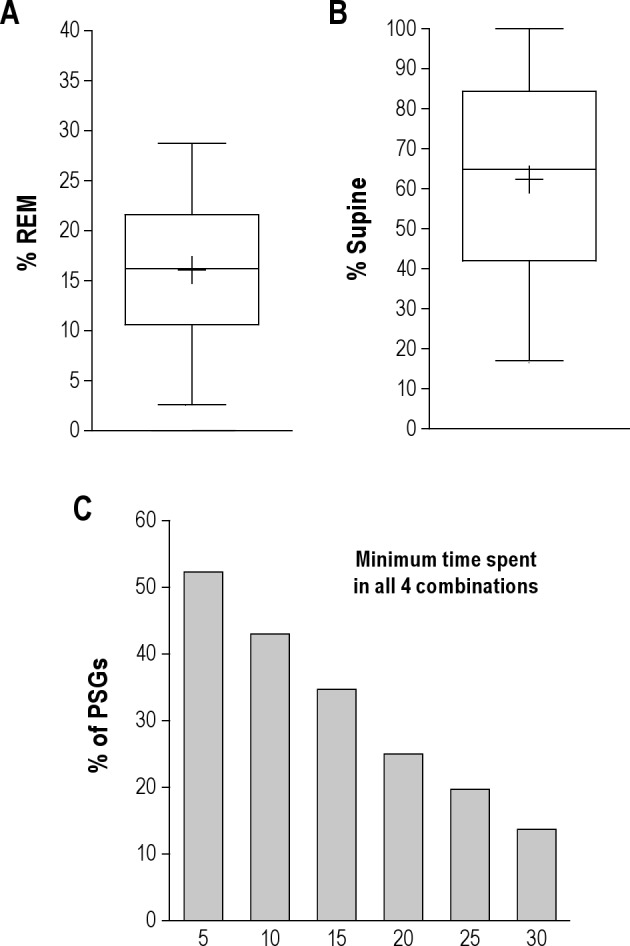
(A) Box and whiskers plot of the percent of the TST spent in REM sleep, showing the median value (central line), mean value (+), 25–75th percentiles (box edges), and 5% to 95% range (whiskers). (B) Box and whiskers plot of the percent of the TST spent in the supine position. (C) Percentage of PSGs containing minimum amounts of time (X-axis in minutes) in each of the four possible combinations of REM/NREM and supine/non-supine.
Only a fraction of the PSGs contained observations sufficient to characterize all 4 possible combinations of REM, NREM, supine, and lateral conditions (Figure 2C). For example, 43% of PSGs contained ≥ 10 min in each combination, while fewer than 20% contained ≥ 25 min in each combination. Single-night PSG is thus somewhat limited in the chances of providing the requisite patient-specific information to accurately determine stage- and position-dependence.
Apnea Severity: Dependence on Sleep Stage and Body Position
Although OSA is often considered a REM-dominant disorder, there is a range of sleep stage dependence reported in the literature. The distribution of ratios of REM versus NREM AHI in our cohort are given in Figure 3A. Among those patients with ≥ 5 min of REM sleep (n = 285), about half had a REM AHI value ≥ 2-fold larger than the NREM AHI (n = 158); the median ratio in this subset of REM dominant patients was 4.8 (IQ range 2.8–7.4), while the median REM dominance ratio in the whole group was 2.2 (IQ range 1.0–5.4). Among the small portion exhibiting a REM to NREM AHI ratio < 0.5 (i.e., > 2-fold NREM dominant; n = 32), the median ratio was 0.33 (IQ range 0.21–0.38). The remaining subjects (n = 95) had < 2-fold difference between REM and NREM AHI values.
Figure 3. Distribution of stage- and position-dominance: AHI ratios.
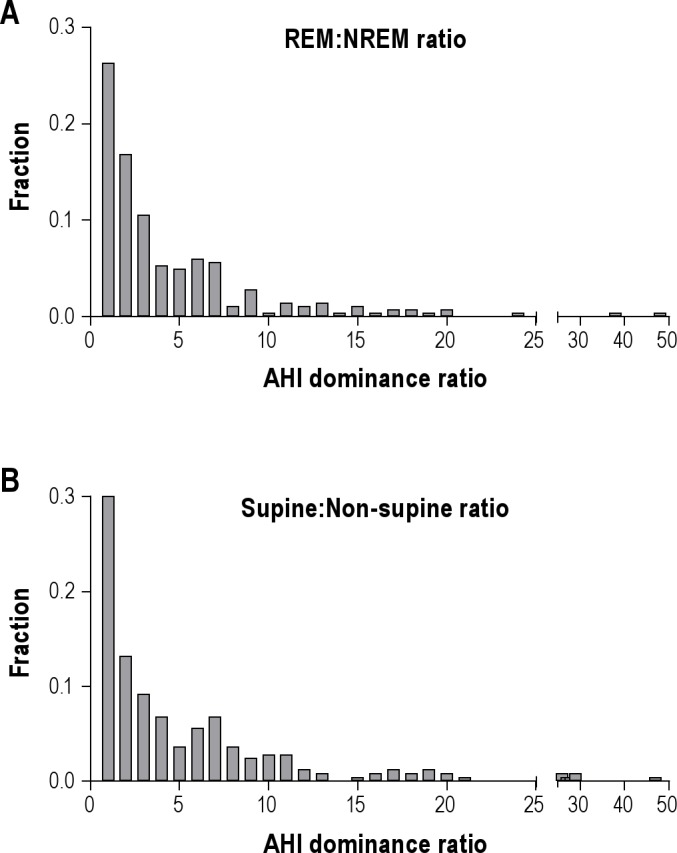
(A) Frequency histogram showing the relative occurrence (Y-axis) of REM: NREM AHI ratios. Larger values indicate increasing REM-dominant OSA. (B) Frequency histogram showing the relative occurrence of supine: non-supine AHI ratios. Larger values indicate increasing supine-dominant OSA.
We also considered several subgroups to further explore REM dominance patterns. For subjects with at least 20, 40, or 60 min of REM sleep (n = 271, 218, or 158, respectively), the median REM dominance ratio was between 2.4 and 2.6, and the percentages of these subgroups with REM dominance ratios > 2 were between 45% and 60%. These values were similar to values obtained from group having ≥ 5 min of REM sleep reported above. Among women (n = 136), the REM dominance was greater, with a median REM dominance ratio of 4.2 (IQ range 1–8.3). Male subjects (n = 152) showed a smaller ratio of 1.9 (IQ range 0.6–4.3; p < 0.0001, Mann-Whitney, compared to the ratio in females). There was no significant correlation between age and the REM dominance ratio for the whole group (Pearson r = 0.02), or when females and males were analyzed separately (Pearson r = 0.04 and 0.09).
In addition to sleep stage effects, body position also influenced OSA severity. The distribution of supine to non-supine AHI ratios is given in Figure 3B. Among patients with ≥ 5% of TST in either supine or non-supine position (n = 250), 60% showed ≥ 2-fold greater AHI in the supine than the non-supine position (n = 149); the median ratio among these supine-dominant patients was 6.5 (IQ range 3.5–10.3), while the median ratio for the whole group was 3.2 (IQ range 1.1–6.9). Only 5 patients had a supine to non-supine AHI ratio < 0.5 (i.e., > 2-fold non-supine dominant OSA). The remaining patients had < 2-fold difference in AHI between supine and non-supine positions (n = 96). Prone sleep was observed in only 15 patients (5%); thus, we could not reliably evaluate the effect of this body position on apnea severity.
We also considered several subgroups to further explore supine dominance patterns. Among subjects with 5% to 95% of the time spent supine (n = 250), males showed higher median supine dominance ratios than females: 4.0 vs 2.2 (p < 0.005, Mann-Whitney). This male preference for supine dominance persisted if we restricted analysis to those with 20% to 80% of sleep in the supine position (3.6 versus 2.2; p < 0.03, Mann-Whitney). Older age affected supine dominance, as there was a small but significant correlation between age and the supine dominance ratio, with Spearman r = 0.28–0.31 for the groups defined by spending 5% to 95% of sleep supine or 20% to 80% supine. Of note, the male subjects were slightly but significantly older in each of these subgroups, by a mean of approximately 5 years, which may have contributed to the male correlation.
AHI Underestimation Due to Reduced Time in REM Sleep
We next considered how the summary (full-night) AHI value could be underestimated due to the underrepresentation of REM sleep that sometimes occurs due to a first night effect. We extrapolated the AHI by scaling individuals with < 25% REM sleep to a value of 25% of the TST. Those with no REM sleep (n = 8) were conservatively assigned a REM AHI of 30/h, which was at the 98th percentile of our cohort's full-night AHI distribution. With these adjustments, the median AHI value of the cohort increased only slightly from 5.3/h (IQ range 1.8–10.4) to 6.2/h (IQ range 2.2–12.9), a change that was not significant (p > 0.1, Mann-Whitney; Figure 4B). Among those with a REM dominance ratio of ≥ 2 or ≥ 5, correction for time spent in REM sleep caused reclassification from a normal AHI to an AHI > 5 in 8% and 11% of cases, respectively. Reclassification from an AHI value of < 15 to > 15 occurred in 11% of those with either ≥ 2 or ≥ 5 REM dominance. Thus, while REM can clearly be associated with worsening apnea, the overall impact of this stage dependence on the full-night average AHI can be small. Although the population-level risk of AHI underestimation due to decreased time spent in REM sleep was small, individual patients can clearly be misclassified on this basis.
Figure 4. AHI underestimation related to time spent in REM and supine position.
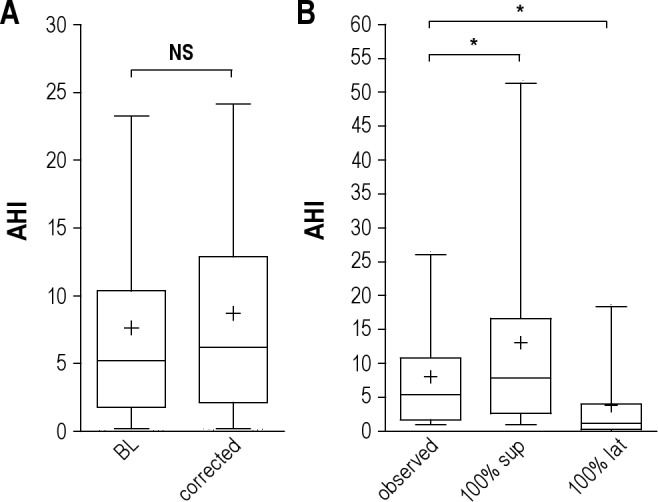
(A) Box and whiskers plots of the percent of the AHI (events/h) in our cohort in baseline conditions (“BL”) compared to that after adjustment for each individual who spent < 25% of TST in REM sleep (“corrected”). Median (central line), mean (+), 25–75th percentiles (box edges), and 5% to 95% range (whiskers) are shown. The groups are not different (Mann-Whitney rank test). (B) Box and whiskers plots of the AHI values related to body position. The baseline condition (“observed”) includes only those patients who spent 20% to 80% of the TST in the supine position. These values are compared to the supine AHI and the lateral AHI. *Significant difference by Kruskal-Wallis test with Dunn post-test.
AHI Underestimation Due to Reduced Time in the Supine Position
Consider a single night PSG during which body position changed—how different might the AHI value be if the patient had slept exclusively supine? To answer this question, we analyzed those patients with 20% to 80% of sleep time spent in the supine position (n = 185), using this more conservative cutoff to increase confidence in the calculation of the supine dominance of AHI values. The supine dominance of this group had a median value of 2.7 (IQ range 1.1–6.7). Extrapolating the AHI values as if the patients were supine the whole night revealed a significant increase in the median AHI, from 5.1/h (IQ range 1.4–9.8) to 7.4/h (IQ range 2.4–15.9) (p < 0.0001, Kruskal-Wallis; Figure 4B). The impact of position change was greater than the impact of subnormal REM sleep described above. We also note the skew of the AHI values well into the severe OSA range with this adjustment. Below we will address the apnea severity misclassification problem suggested by this pattern.
Expected Benefit of Enforced Lateral Sleep
Despite the current limitations in monitoring and enforcing lateral sleep in the home, it is useful to explore the potential for positional therapy based on the distribution of body positions and the relative protection afforded by non-supine sleep. In the subset of patients with 20% to 80% of sleep spent in the supine position, enforced lateral sleep would be expected to lower the median AHI significantly from 5.1/h (IQ range 1.4 to 9.8) to 1.1 (IQ range 1.0–3.9; Figure 4B). Within this group, 58% (n = 55) of those with observed AHI > 5/h (n = 95) would be predicted to normalize (AHI < 5/h) with enforced lateral sleep; similarly, 57% (n = 27) of those with observed AHI > 10 (n = 47) would be predicted to normalize to values < 10/h with enforced lateral sleep. This demonstrates a substantial theoretical benefit afforded by position therapy in patients with mild to moderate OSA as in this cohort.
OSA Severity Misclassification Due to Position Dependence
The above results indicated that the within-patient adjustment for supine sleep position yields a larger effect in terms of potential underestimation at the population level compared to adjustment for the amount of REM sleep. Relative to the worst-case scenario of 100% supine sleep, our results predict OSA category misclassification due to position-dependent OSA combined with time spent non-supine (Figure 5). Among patients who spent < 50% of TST in the supine position (n = 99) and had an overall AHI < 5/h on their PSG (n = 53 of the 99), 14% were predicted to have AHI > 5 if they had spent the full TST supine (Figure 5B). Among patients with observed AHI < 15/h, 24% to 38% would be reclassified to AHI > 15/h if they spent the full TST supine (depending on whether we use a cutoff for analysis of < 50% [n = 99] or < 25% [n = 32] of the TST spent supine). Among those with observed AHI < 30/h, 16% to 38% would be reclassified as severe (> 30/h) had they spent the full night supine. These results suggest that in our cohort the potential risk for misclassification based on body position was substantial and affected all OSA severity categories; in some cases, those with overall AHI values < 5/h had supine AHI values in the moderate or even severe range.
Figure 5. OSA category misclassification: risk due to body position.
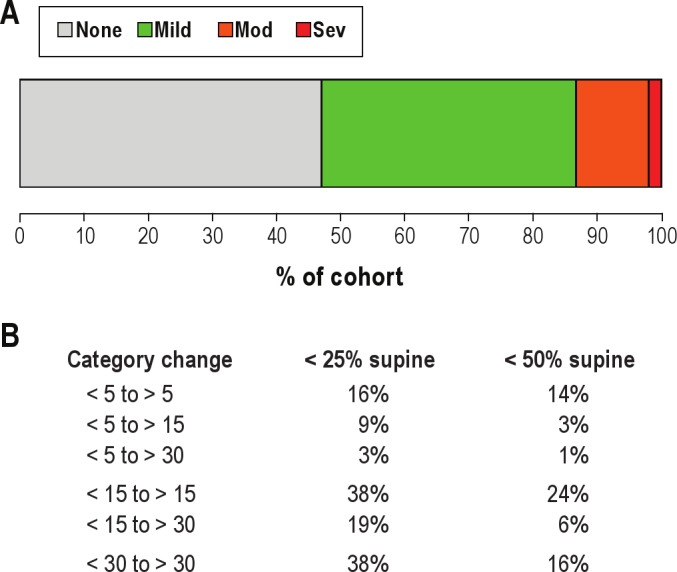
(A) Bar plot of the baseline percentage (X-axis) of the cohort with AHI values in the following disease categories: none (AHI < 5; gray), mild (AHI 5–15; green), moderate (AHI 15–30; orange), and severe (AHI > 30; red). (B) Misclassification for those subjects with either < 25% or < 50% of the TST spent in the supine position (n = 32). The percentage of the cohort that could switch categories based on extrapolation of supine AHI is given.
Visual Guide to Position Related Underestimation of AHI from a Single Night PSG
Next we generated a simple visual framework for considering AHI underestimation given 2 factors obtained on routine laboratory PSG: the portion of the TST spent supine, and the relative protection afforded by non-supine sleep (Figure 6). We conducted simple calculations involving 3 typical patient groups with assumed supine AHI values of 10, 22.5, and 40/h. The percentage of TST spent supine and the relative protection afforded by non-supine sleep were varied to produce a spectrum of observed summary AHI values in each group. For example, a patient with severe OSA based on a supine AHI of 40 could be observed to have an AHI value in the mild or moderate range if lateral position affords at least 2-fold protection and supine position was < 50% of the TST (Figure 2C). These parameters are plausible, having occurred in 60 patients in our cohort (of the 90 with 5% to 50% of TST spent in supine position).
Figure 6. Simulations of AHI underestimation due to body position.

Contour plots illustrate observed AHI values (color gradient scale), when the supine AHI value is 10 (A), 22.5 (B), or 40 (C). In each panel, all possible combinations of the portion of TST spent supine (X-axis) and the relative protection of lateral position compared to supine in terms of AHI (Y-axis; L: S ratio of AHI values) are shown to provide the entire spectrum of possible underestimations in each case. The white contour lines indicate the clinical boundaries for OSA severity categories. In each panel, the observed AHI (color) equals the “true” AHI only when either there is no position dependence (top margin of each panel), or when the time spent supine is 100% (right margin of each panel). Underestimation of the AHI occurs whenever either of these conditions is violated, in proportion to the extent of position dependence of AHI and the proportion of the night spent supine.
Phenotypic Misclassification in a Simulated Population
In the prior sections, we focused on the risk of underestimating AHI values from a single PSG. We now explore the issue of misclassification by over- or underestimation, such as might occur in population studies undertaken for OSA genetics or cardiovascular risk associations. Single-night assessments that neglect position dependence could blur phenotype boundaries, which would increase variance, dilute the strength of associations, and necessitate higher numbers of patients to identify relationships. We modeled 4 groups of patients with supine AHI values (mean ± SD) of 2.5 ± 1.25/h for normal, 10 ± 2.5/h for mild, and 22.5 ± 7.5/h for moderate apnea. The severe group was modeled by a skewed normal distribution with mean of 50/h, and 95% of values within the range of 30–90/h, to reflect the long tail toward higher AHI values, as seen in large studies such as the Sleep Heart Health Study (SHHS).
Values drawn from these baseline control distributions are shown in Figure 3A. Our intention is to provide a baseline distribution against which to compare the same groups with imposed position-related variance rather than to model actual population observations, which lack nadirs between clinical categories. The overlapping categories in this baseline simulation are entirely due to the imposed small degree of stochastic variance in the AHI; these effects are fairly small, with misclassification rates of ~5% (not shown).
In this initial model, each subject was also assigned a percentage of the TST spent supine, but no position dependence was imposed. In Figure 3B, we used this place-holder value to introduce variance into each subject's AHI value due to 2 factors: portion of the TST spent supine and supine dominance of the OSA severity. Supine versus non-supine time ratios were drawn from a normal distribution of ratios (1.13 ± 0.16), based on prior work.13–16 The supine-dominance of AHI was taken to be 2:1. Thus, each subject had their AHI value reassigned based on position dependence imposed upon their previously assigned portion of the TST spent supine. From this plausible source of variation, the overlap in clinical categories became more pronounced (Figure 7B). The OSA category misclassification is summarized in a confusion matrix (Figure 7C). The portion of patients remaining in their original categorical phenotype ranged from 64% to 93%, with 7% to 19% being adjusted to either one category lower or higher than their original category.
Figure 7. OSA severity categories misclassification.
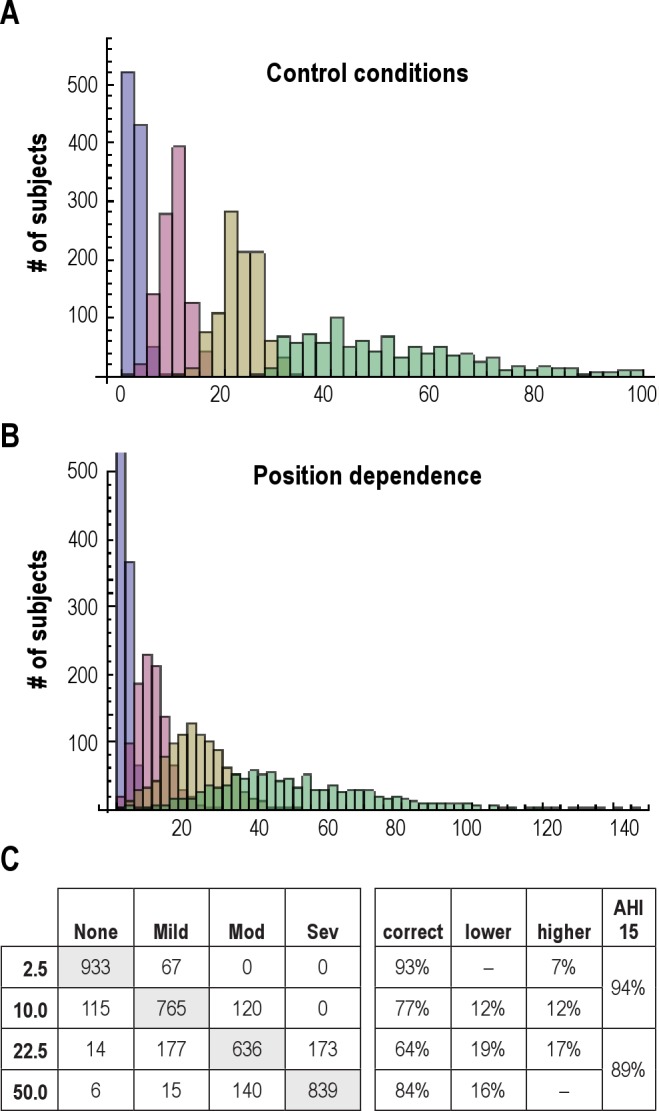
Histogram of AHI values obtained from a simulated cohort of n = 1,000 subjects in each of 4 categories: AHI < 5 (purple), AHI 6-15 (pink), AHI 16-30 (gold), and AHI > 31 (green). See methods for the distribution assumptions in this and subsequent panels. Histogram of AHI values from the same cohort as in panel A after imposing position dependence to the AHI for each individual. Note the change in X-axis range. Confusion matrix showing misclassification of individuals according to the distribution in panel B. Each row is the “true” AHI assigned to each group. Each column is the OSA category assigned given stochastic variation as well as position dependence. Gray shading indicates the correctly classified members of each group. The percentage of individuals misclassified is also given based on the standard categories, as well as a single cutoff value of AHI = 15.
DISCUSSION
Reliance on a single night of sleep data continues to represent a challenge to OSA diagnosis, decision making, and research phenotyping because a single night of sleep often does not provide sufficient examination of all combinations of sleep stages and body positions. This study highlights several important points relevant to interpretation of the single-night sleep study with regard to OSA classification: (1) we found a wide variation in the stage- and position dependence of OSA during routine diagnostic PSG testing; (2) we observed all four combinations of stage (REM and NREM) and position (supine and non-supine) in only a fraction of PSGs; (3) supine dominance had a greater impact than REM dominance regarding the risk of underestimating AHI; (4) the risk of misclassification is substantial, as indicated by models driven by even conservative parameter estimates. Considering position dependence and REM dependence of the AHI provides a framework to guide patient-specific PSG interpretation, although certain limitations clearly remain that are inherent to the single-night assessment of OSA.
What Is the “True” AHI?
The question may arise when patients reporting a lateral sleep position preference in the home are requested to sleep supine during their laboratory PSG. Such a patient might argue that their study's AHI does not accurately represent their AHI at home, particularly if their supine AHI is more severe than other body positions, as is often the case. The true AHI, they would argue, should be that obtained from their more typical sleep position (lateral, in this example). However, it is difficult to know about (or control) body position in sleep. Moreover, if one has severe apnea while supine, one might not want to risk the potential health consequences of OSA occurring during (perhaps unknown) time spent in the supine position. The true AHI in this clinical situation would be the weighted average of supine and lateral values according to a distribution of time spent in different positions over time. Since there is currently no feasible way to routinely measure this, the conservative approach would be to strongly weight the supine AHI in decision making.
From a research standpoint, we suggest that two types of misclassification are most deserving of attention, and which is more relevant would depend upon the goals of the research. From a sleep apnea genetics standpoint, patients should arguably be classified using metrics that capture AHI according to stage and position, as these may carry important phenotypic value. Genetic associations of OSA severity should not, in contrast, depend on stochastic nightly variance in body position or REM% (which presumably are not genetic). On the other hand, in large population studies aiming to draw epidemiological links between OSA severity and cardiovascular events, the “true” AHI value should arguably take into account night-to-night variation (of any cause) occurring within individual patients, because presumably the actual AHI value is contributing to the risk. In other words, the distribution of AHI values over time (from variance in position or other factors) is critical in linking OSA with clinical outcomes. To illustrate that the true AHI is context dependent, consider a theoretical patient with strongly supine-dominant OSA who sleeps exclusively in the lateral position in the home. Such a patient could be classified (appropriately) as mild or even normal in an epidemiological study of cardiovascular outcomes, while the same patient could also be classified (appropriately) as severe OSA in a genetic study of OSA risk.
Sleep Stage Dependence of OSA
Several reports have characterized the stage dependence of OSA, and approximately half of patients with OSA were REM dominant.13–14,17–19 In our study, the distribution of stage dependence was quite large and non-normally distributed (Figure 3). Some individuals had quite large REM: NREM AHI ratios: 27% of subjects had a ratio > 5. The worsening of OSA severity in REM sleep is likely to be related to the accompanying atonia resulting in more prominent airway collapse as well as greater desaturation.20 Despite the fact that REM dominance can be quite substantial, the impact of subnormal REM sleep times on the overall AHI values was small, due to the fact that REM occupies a minority of sleep time even under normal conditions.
Among patients with severe AHI values (e.g., 30–60/h or higher) reported in the literature, NREM dominance was the more common pattern.13,14,17,21 We could not assess this pattern in our cohort, which was comprised of mainly normal, mild, or moderate OSA patients. However, the reported NREM dominance trend for severe OSA is not surprising, since 75% or more of the TST typically consists of NREM sleep. Thus, REM-related events are at a 3:1 “disadvantage” on average, compared to NREM-related events, in terms of contribution to the total night AHI (Supplemental Figure S1). For example, to achieve an overall AHI of 75, with a 3:1 REM-to-NREM AHI ratio, the REM AHI would have to be the nearly impossible rate of 150/h (and the NREM rate would be 50/h).
Despite the relatively lower impact of reduced REM% on the full-night AHI in our cohort, a substantial minority of patients (~10%) exhibited underestimation sufficient to cause clinically important misclassification (using AHI cutoffs of 5 or 15). Patient-specific mitigation of this risk could be reasonably achieved by reassessing borderline cases as if the REM% were a normal (for example, 25%) portion of the TST. The finding of greater REM dominance in females than males suggests that sex should be considered in the clinical interpretation of overall AHI values when subnormal REM% times are encountered. And while the focus of this paper is on the AHI which is itself a summary metric, it should be noted that respiratory pauses can be most severe in REM sleep, by virtue of event duration and oxygen desaturation, but these features are not captured by the AHI.22,23
Position Dependence of OSA
The basis for supine-related worsening of OSA severity likely relates to gravity-driven collapse of the tongue and pharyngeal soft tissue to occlude the airway,15 and in this way may share similarities with REM-related worsening. In our cohort, the distribution of position dependence was quite broad and non-normally distributed (Figure 3), with large ratios > 5 seen in 36% of the subjects. Despite the likely contribution of body position change to variance in OSA severity, only some reports observed this correlation (Table 2).7,–26
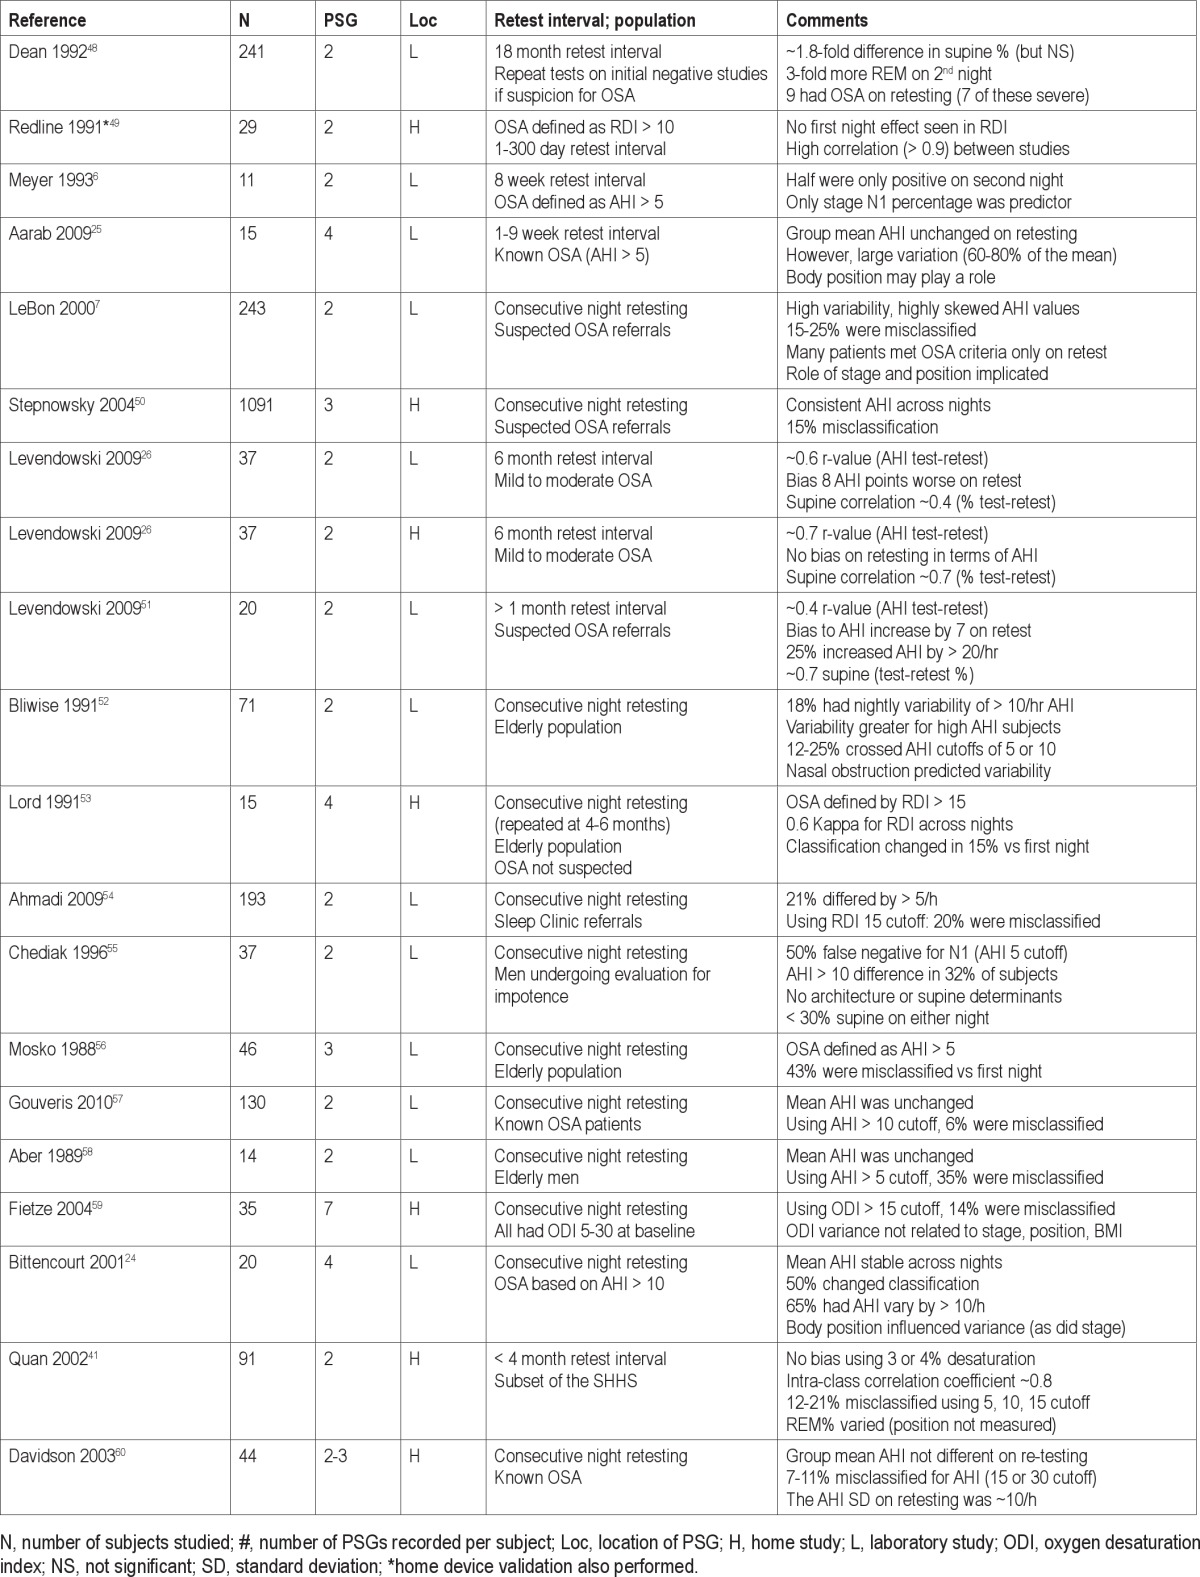
Table 2.
Literature regarding night-to-night variability in OSA
For patients intolerant of CPAP who also have sufficient supine dominance, positional therapy may be considered as a conservative measure.27,28 However, positional therapies such as anti-snore shirts are of uncertain utility and long-term adherence is typically suboptimal.29,30 The lack of available body position monitors contributes to this uncertainty. One recent study aimed to improve the efficacy and compliance with a novel vest-like device to enforce lateral sleep, which also contained an actigraphy monitor to track compliance.31 That study showed promising results in a small population (16 patients) of positional patients, and suggests that improved positional devices may overcome some of the previously reported limitations. In our cohort, the expected benefit of enforced lateral sleep was striking, with > 60% of patients with an AHI > 5/h predicted to normalize (to < 5/h) given this intervention. Enforcing supine sleep during testing has the advantage of decreasing the potential risk of underestimating the AHI. However, it carries the liability that position dependence remains hidden, and thus one may not be able to establish the extent to which lateral sleep position might be protective. It is important to note that few of the approved home PSG devices report body position, which our data suggests is critical for interpretation of the AHI value.32
Interestingly, in comparison to REM dominance, the role of supine dominance appears to be a larger contributor to variance in AHI. This is not unexpected: the body position has a plausible range of time spent supine from 0–100% of the TST, while the plausible range of time spent in REM sleep is more restricted, to about 10% to 30% of the TST (Supplemental Figure S1). This distinction may not hold for split-night studies, in which the AHI during 2–3 hours of baseline sleep might be more sensitive to the presence or absence of a REM period (although the AHI calculated from “simulated” split nights derived from full diagnostic PSGs had high reported correlation with the full night AHI in previous work33).
Finally, supine dominance may be a useful marker of more than just apnea severity. Chervin et al. reported that the supine AHI correlated better with sleepiness than the overall AHI in a large retrospective study.34 From a treatment standpoint, position dependence might serve as a predictor for the efficacy of weight loss or dental appliance interventions,28 although BMI has been reported as an inverse predictor of position dependence.35,36 Neither a recent meta-analysis nor the practice parameter regarding surgical treatments for OSA lists position dependence as a predictor of efficacy.37,38 The degree of supine dependence was influenced by sex and age in our cohort, suggesting these factors should be considered in the evaluation of position-dependence in future work. It is also important to recognize that the time spent supine during a PSG may not be an accurate reflection of the time spent supine during sleep in the home. Due to the routine practice of encouraging supine sleep during clinical studies, the portion supine may in some cases be an overestimate compared to home sleep patterns. Despite this uncertainty, as discussed herein, a conservative approach would be to determine how severe apnea could be while supine, to avoid under-diagnosis.
Night-to-Night Variability
Table 2 illustrates the spectrum of reported variability across two or more nights of testing. The literature varies in terms of population, number of PSG assessments, time between tests, and location of testing. In general, these studies found similar mean AHI values across study nights and good test-retest correlations. However, it is important to note that, despite the reported stability of group means, the individual variability was actually quite large. In order for stable group mean values and high individual misclassifications to both occur, there must be a relative balance among those with increasing, decreasing, or unchanged event rates between the first and subsequent nights of assessment. This serves as a reminder that variability can lead to under- or overestimation of OSA severity for any given individual, even if group means appear stable in test-retest studies. It is also worth noting that apnea classification issues extend beyond the issues covered in this report and those surrounding night to night variability—for example, differences in apnea/hypopnea definitions can alter the apnea indices.39
For reasons of cost and convenience, it is common for large clinical studies to involve single night PSG to establish the diagnosis and severity classification of OSA.40 Although test-retest reliability was reportedly good when home PSG was repeated in a small subsample of the SHHS (n = 91),41 characterizing the phenotype of OSA patients is not straightforward due to heterogeneity of the disease as well as the manner in which it is clinically characterized in various studies.42,43
Clinical Implications
As in many aspects of diagnostic medicine, for practical reasons one must often assign cutoff values to continuous variables, such as the AHI, even when the population distribution does not have clear statistical demarcations to guide these cutoffs. Categorical OSA clinical classifications have facilitated links to sleepiness44 and to cardiovascular risk.2,3 Yet it should be emphasized that considerations regarding how accurate one must be in determining the AHI depends in part on the context. Whether a sleepy patient has an AHI of 20 or 80 per hour on their diagnostic PSG will not change the fact that CPAP is the gold standard treatment. However, patients meeting criteria for OSA while supine may escape diagnosis because only a portion of the PSG was spent in the supine position, which reduced the summary AHI value.
One major limitation of the single-night study of sleep, regarding the ability to adjust for stage- and position-dependence, is that one may not observe all four combinations of REM/NREM and supine/non-supine sleep. For patients who spend the entire PSG supine and have a normal amount of REM sleep, the apnea severity is unlikely to be underestimated. However, even under these conditions that insulate against underestimation, some information is lost, as one is still left with uncertainty as to relative protection afforded by lateral sleep (should a position approach be attempted). For patients with position dependence, the contour plots of Figure 5 can be used as a guide to estimating potential underestimation. For those with an unexpectedly negative single night PSG, considering the pre-test probability of OSA should drive selective decisions to repeat testing.8
Underestimating the AHI has implications for individual patients in whom the diagnosis and treatment decisions are made based on a single study. Repeat testing may be useful in the short term to confirm unexpected results, or over longer time frames to assess worsening.45,46 It is also worth mentioning that while the diagnosis and severity categorization formally rests upon the AHI, this metric does not take into account other potentially important features such as length of event, associated cardiovascular response, depth of desaturation, or fragmentation of EEG metrics of sleep.
The main limitation of our study is that we were limited to single-night PSG, as is customary in the clinical laboratory setting. Ideally, repeated nights of observation would provide important information as to the impact of differences in REM sleep and body position, assuming that these parameters changed from night to night. Such a study would allow important validation to the predictions made herein. In addition, we note that our selected population of mainly mild-to-moderate apnea is more likely to show position dependence compared to patients with severe apnea. Thus, the extent to which the position-related classification issues discussed here may generalize to more severe sleep disordered breathing remains uncertain. By extension, our finding that position is more relevant than sleep stage may not generalize to populations with more severe AHI values, in which position dependence is less apparent.35,47 These patterns however emphasize the potential role of positional therapy in those with mild or moderate sleep apnea.
In summary, supine dominance and REM dominance are important risk factors for underestimating the AHI that can be potentially recognized and accounted for in a patient-specific manner from a single night's study of sleep. Although home monitoring devices may facilitate repeat testing to address certain contributors to AHI variance, many of these do not measure sleep stage or body position,32 thus limiting their value. When position- and/or stage-dependence is evident in a single night PSG, the conditional AHI values should be considered regarding the potential for OSA misclassification, in particular the risk of underestimation of severity or missing the diagnosis altogether. We suggest that routine PSG interpretation should include not only the average AHI and RDI values, but also the details of respiratory event frequency by position and sleep stage. This would enable clinicians to extrapolate the positional data across the spectrum of full-supine sleep (presumed to be the worst case scenario) to the full-lateral sleep position for the purposes of positional therapy considerations. In addition, it would facilitate incorporation of stage-dependent data (perhaps in combination with position data) in the case of underrepresentation of REM sleep in particular. Routine reporting at this level will provide improved patient-specific sleep apnea phenotyping and thus improved management.
DISCLOSURE STATEMENT
This was not an industry supported study. Dr Bianchi and Dr Ellenbogen receive funding from the Department of Neurology, Massachusetts General Hospital. Dr Bianchi receives funding from a Young Clinician Award from the Center for Integration of Medicine and Innovative Technology. Dr Bianchi has a patent pending on a home sleep monitoring device. The other authors have indicated no financial conflicts of interest.
SUPPLEMENTAL MATERIAL
Each plot illustrates the relationship between the full night AHI (Y-axis) and the AHI of the “dominant” condition, whether it be position or stage (X-axis). Three plausible dominance ratios (2:1, 5:1, 10:1) are shown in panels A–C respectively. When REM is the dominant condition of interest, the % time spent in this state can vary in a relatively low range, such as 5%, 15%, or 25% (gray) of TST. However, when supine is the “dominant” condition of interest, time spent in this state can vary without restriction from 0–100%. If REM could vary without restriction, there would be no theoretical difference between supine- versus REM-dependence when it comes to AHI underestimation. As supine position varies over a larger value range, the total AHI also varies to a larger degree (manifested as a steeper slope) for any given dominant AHI value, when one considers the plausible range of supine sleep time (say, 25% to 75%) compared to REM sleep time across its plausible range (5% to 25%). As an example, consider a patient with supine AHI of 40, and 5:1 supine dominance (i.e., non-supine AHI of 8). This patient would have a total AHI of 32 when 75% of the TST is supine, while total AHI is < 15 when only 25% of the TST is supine—resulting in severe versus mild misclassification.

REFERENCES
- 1.Yaggi HK, Concato J, Kernan WN, Lichtman JH, Brass LM, Mohsenin V. Obstructive sleep apnea as a risk factor for stroke and death. N Engl J Med. 2005;353:2034–41. doi: 10.1056/NEJMoa043104. [DOI] [PubMed] [Google Scholar]
- 2.Eastwood PR, Malhotra A, Palmer LJ, et al. Obstructive sleep apnoea: from pathogenesis to treatment: Current controversies and future directions. Respirology. 2010;15:587–95. doi: 10.1111/j.1440-1843.2009.01699.x. [DOI] [PMC free article] [PubMed] [Google Scholar]
- 3.Budhiraja R, Budhiraja P, Quan SF. Sleep-disordered breathing and cardiovascular disorders. Respir Care. 2010;55:1322–32. discussion 30-2. [PMC free article] [PubMed] [Google Scholar]
- 4.Epstein LJ, Kristo D, Strollo PJ, Jr., et al. Clinical guideline for the evaluation, management and long-term care of obstructive sleep apnea in adults. J Clin Sleep Med. 2009;5:263–76. [PMC free article] [PubMed] [Google Scholar]
- 5.American Academy of Sleep Medicine. International Classification of sleep disorders: diagnostic and coding manual. 2nd ed. Westchester, IL: American Academy of Sleep Medicine; 2005. [Google Scholar]
- 6.Meyer TJ, Eveloff SE, Kline LR, Millman RP. One negative polysomnogram does not exclude obstructive sleep apnea. Chest. 1993;103:756–60. doi: 10.1378/chest.103.3.756. [DOI] [PubMed] [Google Scholar]
- 7.Le Bon O, Hoffmann G, Tecco J, et al. Mild to moderate sleep respiratory events: one negative night may not be enough. Chest. 2000;118:353–9. doi: 10.1378/chest.118.2.353. [DOI] [PubMed] [Google Scholar]
- 8.Bianchi MT. Screening for obstructive sleep apnea: Bayes weighs in. The Open Sleep Journal. 2009;2:56–9. [Google Scholar]
- 9.Toussaint M, Luthringer R, Schaltenbrand N, et al. Changes in EEG power density during sleep laboratory adaptation. Sleep. 1997;20:1201–7. doi: 10.1093/sleep/20.12.1201. [DOI] [PubMed] [Google Scholar]
- 10.Silber MH, Ancoli-Israel S, Bonnet MH, et al. The visual scoring of sleep in adults. J Clin Sleep Med. 2007;3:121–31. [PubMed] [Google Scholar]
- 11.Oksenberg A, Arons E, Snir D, Radwan H, Soroker N. Cheyne-Stokes respiration during sleep: a possible effect of body position. Med Sci Monit. 2002;8:CS61–5. [PubMed] [Google Scholar]
- 12.Eiseman NA, Westover MB, Mietus JE, Thomas RJ, Bianchi MT. Classification algorithms for predicting sleepiness and sleep apnea severity. J Sleep Res. 2012;21:101–12. doi: 10.1111/j.1365-2869.2011.00935.x. [DOI] [PMC free article] [PubMed] [Google Scholar]
- 13.Haba-Rubio J, Janssens JP, Rochat T, Sforza E. Rapid eye movement-related disordered breathing: clinical and polysomnographic features. Chest. 2005;128:3350–7. doi: 10.1378/chest.128.5.3350. [DOI] [PubMed] [Google Scholar]
- 14.Liu Y, Su C, Liu R, et al. NREM-AHI greater than REM-AHI versus REM-AHI greater than NREM-AHI in patients with obstructive sleep apnea: clinical and polysomnographic features. Sleep Breath. 2011;15:463–70. doi: 10.1007/s11325-010-0358-z. [DOI] [PubMed] [Google Scholar]
- 15.Oksenberg A, Silverberg DS. The effect of body posture on sleep-related breathing disorders: facts and therapeutic implications. Sleep Med Rev. 1998;2:139–62. doi: 10.1016/s1087-0792(98)90018-1. [DOI] [PubMed] [Google Scholar]
- 16.Cartwright RD. Effect of sleep position on sleep apnea severity. Sleep. 1984;7:110–4. doi: 10.1093/sleep/7.2.110. [DOI] [PubMed] [Google Scholar]
- 17.Siddiqui F, Walters AS, Goldstein D, Lahey M, Desai H. Half of patients with obstructive sleep apnea have a higher NREM AHI than REM AHI. Sleep Med. 2006;7:281–5. doi: 10.1016/j.sleep.2005.10.006. [DOI] [PubMed] [Google Scholar]
- 18.Loadsman JA, Wilcox I. Is obstructive sleep apnoea a rapid eye movement-predominant phenomenon? Br J Anaesth. 2000;85:354–8. doi: 10.1093/bja/85.3.354. [DOI] [PubMed] [Google Scholar]
- 19.Oksenberg A, Arons E, Nasser K, Vander T, Radwan H. REM-related obstructive sleep apnea: the effect of body position. J Clin Sleep Med. 2010;6:343–8. [PMC free article] [PubMed] [Google Scholar]
- 20.Malhotra A, White DP. Obstructive sleep apnoea. Lancet. 2002;360:237–45. doi: 10.1016/S0140-6736(02)09464-3. [DOI] [PubMed] [Google Scholar]
- 21.Muraki M, Kitaguchi S, Ichihashi H, et al. Apnoea-hypopnoea index during rapid eye movement and non-rapid eye movement sleep in obstructive sleep apnoea. J Int Med Res. 2008;36:906–13. doi: 10.1177/147323000803600506. [DOI] [PubMed] [Google Scholar]
- 22.Oksenberg A, Khamaysi I, Silverberg DS. Apnoea characteristics across the night in severe obstructive sleep apnoea: influence of body posture. Eur Respir J. 2001;18:340–6. doi: 10.1183/09031936.01.00038101. [DOI] [PubMed] [Google Scholar]
- 23.Oksenberg A, Khamaysi I, Silverberg DS, Tarasiuk A. Association of body position with severity of apneic events in patients with severe nonpositional obstructive sleep apnea. Chest. 2000;118:1018–24. doi: 10.1378/chest.118.4.1018. [DOI] [PubMed] [Google Scholar]
- 24.Bittencourt LR, Suchecki D, Tufik S, et al. The variability of the apnoea-hypopnoea index. J Sleep Res. 2001;10:245–51. doi: 10.1046/j.1365-2869.2001.00255.x. [DOI] [PubMed] [Google Scholar]
- 25.Aarab G, Lobbezoo F, Hamburger HL, Naeije M. Variability in the apnea-hypopnea index and its consequences for diagnosis and therapy evaluation. Respiration. 2009;77:32–7. doi: 10.1159/000167790. [DOI] [PubMed] [Google Scholar]
- 26.Levendowski D, Steward D, Woodson BT, Olmstead R, Popovic D, Westbrook P. The impact of obstructive sleep apnea variability measured in-lab versus in-home on sample size calculations. Int Arch Med. 2009;2:2. doi: 10.1186/1755-7682-2-2. [DOI] [PMC free article] [PubMed] [Google Scholar]
- 27.van Mannen JP, Richard W, van Kesteren ER, et al. Evaluation of a new simple treatment for positional sleep apnoea patients. J Sleep Res. 2012;21:322–9. doi: 10.1111/j.1365-2869.2011.00974.x. [DOI] [PubMed] [Google Scholar]
- 28.Randerath WJ, Verbraecken J, Andreas S, et al. Non-CPAP therapies in obstructive sleep apnoea. Eur Respir J. 2011;37:1000–28. doi: 10.1183/09031936.00099710. [DOI] [PubMed] [Google Scholar]
- 29.Oksenberg A, Silverberg D, Offenbach D, Arons E. Positional therapy for obstructive sleep apnea patients: A 6-month follow-up study. Laryngoscope. 2006;116:1995–2000. doi: 10.1097/01.mlg.0000237674.66716.a7. [DOI] [PubMed] [Google Scholar]
- 30.Bignold JJ, Deans-Costi G, Goldsworthy MR, et al. Poor long-term patient compliance with the tennis ball technique for treating positional obstructive sleep apnea. J Clin Sleep Med. 2009;5:428–30. [PMC free article] [PubMed] [Google Scholar]
- 31.Heinzer RC, Pellaton C, Rey V, et al. Positional therapy for obstructive sleep apnea: An objective measurement of patients' usage and efficacy at home. Sleep Med. 2012;13:425–8. doi: 10.1016/j.sleep.2011.11.004. [DOI] [PubMed] [Google Scholar]
- 32.Collop NA, Tracy SL, Kapur V, et al. Obstructive sleep apnea devices for out-of-center (OOC) testing: technology evaluation. J Clin Sleep Med. 2011;7:531–48. doi: 10.5664/JCSM.1328. [DOI] [PMC free article] [PubMed] [Google Scholar]
- 33.Khawaja IS, Olson EJ, van der Walt C, et al. Diagnostic accuracy of split-night polysomnograms. J Clin Sleep Med. 2010;6:357–62. [PMC free article] [PubMed] [Google Scholar]
- 34.Chervin RD, Aldrich MS. Characteristics of apneas and hypopneas during sleep and relation to excessive daytime sleepiness. Sleep. 1998;21:799–806. [PubMed] [Google Scholar]
- 35.Mo JH, Lee CH, Rhee CS, Yoon IY, Kim JW. Positional dependency in Asian patients with obstructive sleep apnea and its implication for hypertension. Arch Otolaryngol Head Neck Surg. 2011;137:786–90. doi: 10.1001/archoto.2011.122. [DOI] [PubMed] [Google Scholar]
- 36.Oksenberg A, Silverberg DS, Arons E, Radwan H. Positional vs nonpositional obstructive sleep apnea patients: anthropomorphic, nocturnal polysomnographic, and multiple sleep latency test data. Chest. 1997;112:629–39. doi: 10.1378/chest.112.3.629. [DOI] [PubMed] [Google Scholar]
- 37.Aurora RN, Casey KR, Kristo D, et al. Practice parameters for the surgical modifications of the upper airway for obstructive sleep apnea in adults. Sleep. 2010;33:1408–13. doi: 10.1093/sleep/33.10.1408. [DOI] [PMC free article] [PubMed] [Google Scholar]
- 38.Caples SM, Rowley JA, Prinsell JR, et al. Surgical modifications of the upper airway for obstructive sleep apnea in adults: a systematic review and meta-analysis. Sleep. 2010;33:1396–407. doi: 10.1093/sleep/33.10.1396. [DOI] [PMC free article] [PubMed] [Google Scholar]
- 39.Ruehland WR, Rochford PD, O'Donoghue FJ, Pierce RJ, Singh P, Thornton AT. The new AASM criteria for scoring hypopneas: impact on the apnea hypopnea index. Sleep. 2009;32:150–7. doi: 10.1093/sleep/32.2.150. [DOI] [PMC free article] [PubMed] [Google Scholar]
- 40.Quan SF, Howard BV, Iber C, et al. The Sleep Heart Health Study: design, rationale, and methods. Sleep. 1997;20:1077–85. [PubMed] [Google Scholar]
- 41.Quan SF, Griswold ME, Iber C, et al. Short-term variability of respiration and sleep during unattended nonlaboratory polysomnography--the Sleep Heart Health Study. Sleep. 2002;25:843–9. [PubMed] [Google Scholar]
- 42.Riha RL, Gislasson T, Diefenbach K. The phenotype and genotype of adult obstructive sleep apnoea/hypopnoea syndrome. Eur Respir J. 2009;33:646–55. doi: 10.1183/09031936.00151008. [DOI] [PubMed] [Google Scholar]
- 43.Varvarigou V, Dahabreh IJ, Malhotra A, Kales SN. A review of genetic association studies of obstructive sleep apnea: field synopsis and meta-analysis. Sleep. 2011;34:1461–8. doi: 10.5665/sleep.1376. [DOI] [PMC free article] [PubMed] [Google Scholar]
- 44.Gottlieb DJ, Whitney CW, Bonekat WH, et al. Relation of sleepiness to respiratory disturbance index: the Sleep Heart Health Study. Am J Respir Crit Care Med. 1999;159:502–7. doi: 10.1164/ajrccm.159.2.9804051. [DOI] [PubMed] [Google Scholar]
- 45.Pendlebury ST, Pepin JL, Veale D, Levy P. Natural evolution of moderate sleep apnoea syndrome: significant progression over a mean of 17 months. Thorax. 1997;52:872–8. doi: 10.1136/thx.52.10.872. [DOI] [PMC free article] [PubMed] [Google Scholar]
- 46.Berger G, Berger R, Oksenberg A. Progression of snoring and obstructive sleep apnoea: the role of increasing weight and time. Eur Respir J. 2009;33:338–45. doi: 10.1183/09031936.00075408. [DOI] [PubMed] [Google Scholar]
- 47.Oksenberg A, Dynia A, Nasser K, Gadoth N. Obstructive sleep apnoea in adults: body postures and weight changes interactions. J Sleep Res. 2011 doi: 10.1111/j.1365-2869.2011.00988.x. Epub ahead of print. [DOI] [PubMed] [Google Scholar]
- 48.Dean RJ, Chaudhary BA. Negative polysomnogram in patients with obstructive sleep apnea syndrome. Chest. 1992;101:105–8. doi: 10.1378/chest.101.1.105. [DOI] [PubMed] [Google Scholar]
- 49.Redline S, Tosteson T, Boucher MA, Millman RP. Measurement of sleep-related breathing disturbances in epidemiologic studies. Assessment of the validity and reproducibility of a portable monitoring device. Chest. 1991;100:1281–6. doi: 10.1378/chest.100.5.1281. [DOI] [PubMed] [Google Scholar]
- 50.Stepnowsky CJ, Jr., Orr WC, Davidson TM. Nightly variability of sleep-disordered breathing measured over 3 nights. Otolaryngol Head Neck Surg. 2004;131:837–43. doi: 10.1016/j.otohns.2004.07.011. [DOI] [PubMed] [Google Scholar]
- 51.Levendowski DJ, Zack N, Rao S, et al. Assessment of the test-retest reliability of laboratory polysomnography. Sleep Breath. 2009;13:163–7. doi: 10.1007/s11325-008-0214-6. [DOI] [PubMed] [Google Scholar]
- 52.Bliwise DL, Benkert RE, Ingham RH. Factors associated with nightly variability in sleep-disordered breathing in the elderly. Chest. 1991;100:973–6. doi: 10.1378/chest.100.4.973. [DOI] [PubMed] [Google Scholar]
- 53.Lord S, Sawyer B, O'Connell D, et al. Night-to-night variability of disturbed breathing during sleep in an elderly community sample. Sleep. 1991;14:252–8. [PubMed] [Google Scholar]
- 54.Ahmadi N, Shapiro GK, Chung SA, Shapiro CM. Clinical diagnosis of sleep apnea based on single night of polysomnography vs. two nights of polysomnography. Sleep Breath. 2009;13:221–6. doi: 10.1007/s11325-008-0234-2. [DOI] [PubMed] [Google Scholar]
- 55.Chediak AD, Acevedo-Crespo JC, Seiden DJ, Kim HH, Kiel MH. Nightly variability in the indices of sleep-disordered breathing in men being evaluated for impotence with consecutive night polysomnograms. Sleep. 1996;19:589–92. doi: 10.1093/sleep/19.7.589. [DOI] [PubMed] [Google Scholar]
- 56.Mosko SS, Dickel MJ, Ashurst J. Night-to-night variability in sleep apnea and sleep-related periodic leg movements in the elderly. Sleep. 1988;11:340–8. [PubMed] [Google Scholar]
- 57.Gouveris H, Selivanova O, Bausmer U, Goepel B, Mann W. First-night-effect on polysomnographic respiratory sleep parameters in patients with sleep-disordered breathing and upper airway pathology. Eur Arch Otorhinolaryngol. 2010;267:1449–53. doi: 10.1007/s00405-010-1205-3. [DOI] [PubMed] [Google Scholar]
- 58.Aber WR, Block AJ, Hellard DW, Webb WB. Consistency of respiratory measurements from night to night during the sleep of elderly men. Chest. 1989;96:747–51. doi: 10.1378/chest.96.4.747. [DOI] [PubMed] [Google Scholar]
- 59.Fietze I, Dingli K, Diefenbach K, et al. Night-to-night variation of the oxygen desaturation index in sleep apnoea syndrome. Eur Respir J. 2004;24:987–93. doi: 10.1183/09031936.04.00100203. [DOI] [PubMed] [Google Scholar]
- 60.Davidson TM, Gehrman P, Ferreyra H. Lack of night-to-night variability of sleep-disordered breathing measured during home monitoring. Ear Nose Throat J. 2003;82:135–8. [PubMed] [Google Scholar]
Associated Data
This section collects any data citations, data availability statements, or supplementary materials included in this article.
Supplementary Materials
Each plot illustrates the relationship between the full night AHI (Y-axis) and the AHI of the “dominant” condition, whether it be position or stage (X-axis). Three plausible dominance ratios (2:1, 5:1, 10:1) are shown in panels A–C respectively. When REM is the dominant condition of interest, the % time spent in this state can vary in a relatively low range, such as 5%, 15%, or 25% (gray) of TST. However, when supine is the “dominant” condition of interest, time spent in this state can vary without restriction from 0–100%. If REM could vary without restriction, there would be no theoretical difference between supine- versus REM-dependence when it comes to AHI underestimation. As supine position varies over a larger value range, the total AHI also varies to a larger degree (manifested as a steeper slope) for any given dominant AHI value, when one considers the plausible range of supine sleep time (say, 25% to 75%) compared to REM sleep time across its plausible range (5% to 25%). As an example, consider a patient with supine AHI of 40, and 5:1 supine dominance (i.e., non-supine AHI of 8). This patient would have a total AHI of 32 when 75% of the TST is supine, while total AHI is < 15 when only 25% of the TST is supine—resulting in severe versus mild misclassification.